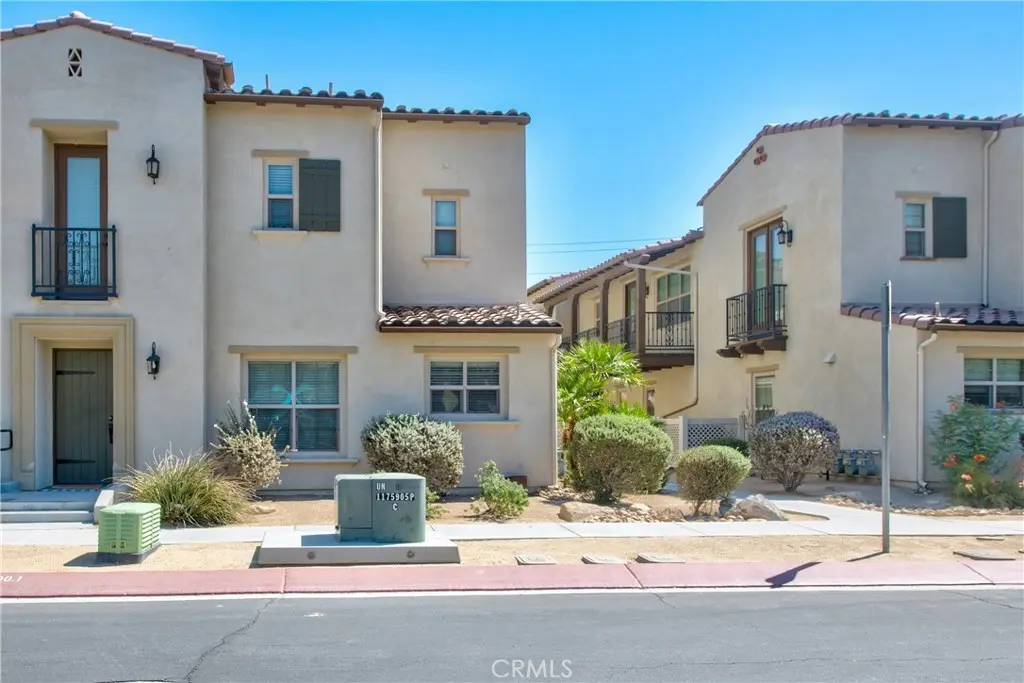
142 Paseo Bravo · Palm Desert, CA
Flood risk 1/10 · Minimal
- FEMA flood zone
- X (unshaded)
- Chance of flooding over 30 yrs
- 0.0%
- Est. flood insurance / yr
- $507 – $1,088
Fire risk 4/10 · Minor
- Est. fire insurance / yr
- $659 – $1,223
Heat risk 9/10 · Severe
- Hot days now (above 114°F)
- 7 days/yr
- Hot days in 30 yrs
- 19 days/yr
Wind risk 1/10 · Minimal
- Chance of severe wind over 30 yrs
- —
Air-quality risk 4/10 · Minor
- Unhealthy air days now
- 5 days/yr
- Unhealthy air days in 30 yrs
- 7 days/yr
Risk factors via First Street. Map © Google.
Why this score? — see what drove the D grade
The composite is a weighted blend of 9 inputs, each scored 0–100. Each bar is that input's sub-score; the figure is the points it added to the 100-point composite (weight × sub-score).
- Cash flow +13.1/30.0
- ARV discount +7.5/15.0
- 1% rule +5.3/10.0
- DSCR +3.9/10.0
- Schools +2.7/10.0
- Livability +2.6/5.0
- Condition / age +2.5/5.0
- Rent growth +2.4/5.0
- Appreciation +0.0/10.0
$369,900
🖨 Deal sheet 📄 Offer letter ✓ Due diligence
Listing remarks MLS
Spectacular Villa Condo @ Spanish Walk! This beautiful home features upgraded wood style flooring through out, 2 bedrooms, plus den/office/dining room or 3rd guest bedroom, 2 baths, maple cabinets, granite surfaces, down lighting, stainless appliances, washer/dryer, custom window coverings, french doors that open to your own large private balcony, two car garage with storage. Spanish Walk offers a community gym, 3 pools & spas, club house, play grounds, parks, billiard room, kids water play area and all within this wonderful gated development. Come see this stunning condo today and live the resort life you deserve!
Key facts
- Fitness center
- Slab counter tops
- New electric oven
Tags
Property features AI
Finance
- Other: Community contains about 390 units; Access via paved city streets; Located in subdivision Spanish Walk
- HOA & community: Part of an association (Management Trust); Monthly association fee ($225) and secondary fee ($320); Onsite property management; Front yard maintenance provided; Playground; Clubhouse; Trash service; Call for association rules
Exterior
- Parking: Attached garage; Direct garage access; 2 garage spaces (2 total parking spaces)
- Security: Card/code access; Smoke detector; Controlled access (association)
- Utilities: Public sewer; District/public water; Sewer connected; Water connected; Electricity connected
- Home design: Multi-family property; Attached property; Planned development; Two-story; Two levels; Has view; Entry on first floor
- Construction: Slate roof; Repairs cosmetic
- Exterior features: Community/association pool; Association spa; Landscaped; Street lighting; Sidewalks; Suburban setting
Interior
- Kitchen: 6-burner stove; Electric oven; Electric stove; Microwave; Refrigerator; Water line to refrigerator; Dishwasher; Garbage disposal; Breakfast nook
- Bedrooms: Primary bedroom (main floor); Additional main floor bedroom; 2 bedrooms on main level
- Bathrooms: 1 full bathroom; 1 three-quarter bathroom; Tile counters; Shower in tub; Bathtub
- Heating & cooling: Central furnace heating; Central cooling
- Interior features: Balcony; Unfurnished; High ceilings (9+ ft); Ceiling fan; Open floor plan; Granite counters; Sliding glass door(s); First floor entry
- Laundry & utility: Washer included; Dryer included; Has laundry
Neighborhood map
What this means for you Summary
Snapshot
- This is a 2-bed/2.0-bath condo listed at $370k.
Deal economics
- At list price, monthly cash flow is $-12 ($-145/yr) — negative.
- To cash-flow at today's rent, offer at most $368k (0.6% below list).
- Meets the 1% rule at list price ($4k rent vs $370k).
- Recommended offer: $368k (0.6% below list) — sets the bar for cash-flow.
- Cap rate 6.3% vs local median 3.5% in Palm Desert — top-decile yield for the area; either an underpriced asset or a hidden risk that comps aren't pricing in. Stress-test before assuming the spread holds.
Location & tenants
- Location reads 51/100 on livability (#1,050 in CA) — a working-class tenant base; expect higher turnover. Strengths: employment B+, housing B; Watch: crime D, amenities F, commute F.
- Palm Springs Unified (suburban): math 21% / reading 42% proficiency, ranked #328 of 517 in CA (top 63%) — families likely to look elsewhere, expect single-tenant / working-renter base with shorter leases; 73% free/reduced lunch — lower-income household profile, screen leases tightly.
- Zoned schools: Palm Springs High (math 30% / reading 51%, grade F, #508 of 1,170 statewide, top 44%, 1,584 students, 97% FRL) — zoned schools average 97% FRL vs 73% district-wide (23 pts higher); higher-poverty schools than district average — tighter screening recommended.
- Market conditions: Rents soft (-0.3%/yr); 626 active listings in the ZIP; 40 comparable units currently listed for rent nearby; rentals lingering (median 44d on market — plan ~5-8 weeks vacancy on turnover, expect pricing pressure); 75% of comp listings sitting > 30 days — soft ceiling on asking rent; solid renter incomes; 9,195 units permitted in Riverside County in 2024 (1,512 in 5+ unit buildings).
- At $3,826/mo this rent would consume 52% of the median local household income ($88k/yr) (locally 1181% of renters already pay >50% of income on rent) — very limited rent-growth headroom before tenants either downsize or default.
Forward outlook
- Local home prices are declining (-3.0%/yr); year-one equity from $3k of loan paydown is wiped out by about $11k of value loss. Plan a longer hold.
- Riverside County population projected at +22% by 2050 — long-run rental-demand tailwind backs the buy-and-hold thesis.
Negotiation context
- Only 4 days on market — expect competitive offers; lowballing is unlikely to land.
- 2 sale attempts since 8y ago; this cycle's ask is 51% above the opening price — seller raised mid-cycle; expect resistance to lowballs.
- Current owner paid $238k; list at $370k implies a 55% gain — meaningful room to come down on a strong offer.
Risks & watch-outs
- Climate carrying-cost: extreme-heat days projected 7→19/yr by 2055 (HVAC capex compounding) — expect insurance premiums to compound above CPI over the hold.
Questions for the listing agent
- What do current leases actually rent for vs. the listed asking? Can we see a recent rent roll and the last 12 months of T-12 income?
- What does the HOA fee cover, when was the last increase, and are there any pending special assessments or reserve-fund shortfalls?
- Any open or pending special assessments — roof, HVAC, plumbing, elevator, façade? What's the per-unit balance and payoff schedule, and is the seller paying it off at close or rolling it to the buyer?
- Is there a deadline driving the sale (1031 exchange, divorce, estate, relocation)? That informs how much negotiation room exists.
- Schools are A-rated — typically a magnet for longer-tenancy family renters. What's the average tenant stay here, and is there a school-zone premium baked into asking?
- Crime grade is D in this area — have there been break-ins, vandalism, or insurance claims at this property in the last 3 years? What carrier currently insures it and at what premium?
- The area grade is low — what's the realistic commute time and amenity access for the typical tenant pool here? Any planned neighborhood developments (good or bad) we should know about?
- What's the average days-on-market for RENTAL listings here right now (not sales)? A rising rental-DOM trend means longer vacancies and softer asking-rent achievability than the comps imply.
- What's the recent tenant-quality profile in this submarket — average credit score on applications, eviction rate, late-payment / NSF rate, and stable-employment percentage? A property-management company in the area should have these aggregated.
- How much new apartment / multifamily construction is in the pipeline within 1–3 miles? Heavy new supply (>2% of stock underway) typically softens rents 12–24 months out; light construction supports rent growth.
Investment metrics
- 1% rule
- 1.03% ✓
- Cap rate
- 6.25%
- Cash-on-cash
- -0.14%
- DSCR
- 0.99
- GRM
- 8.1
CMA / ARV
No comps found within radius.
Projected returns pro-forma
-3.0% appreciation · 0.0% rent growth · sell at horizon
- IRR
- -20.5%
- Equity multiple
- 0.31×
- Total profit
- $-71,570
- Equity at exit
- $55,153
- IRR
- -24.6%
- Equity multiple
- -0.02×
- Total profit
- $-105,214
- Equity at exit
- $31,982
Cash invested: $103,572 (down + closing). Projections, not guarantees.
Landlord ↔ Tenant lean methodology
- Overall (STATE)
- 18 Strongly Tenant-Friendly
- State California
- 18 Strongly Tenant-Friendly · D+13
- County
- — inherits STATE
- City
- — inherits STATE
ZIP-level market 92211
- Rents YoY
- -0.3%
- Active inventory
- 626
- Price-to-rent
- 8.1×
Monthly cashflow live
- Estimated rent
- $3,826 high interval (Pro) →
- Mortgage (P&I)
- −$1,940
- Tax from tax record
- −$395 /mo · $4,744/yr
- Insurance
- −$154
- HOA
- −$545
- Vacancy / Maint / Mgmt
- −$803
- Net cashflow
- $-12
Break-even live
UW: 25.0% down · 7.5% · 30yr · 1.5% tax · 5.0% vac · 8.0% maint · 8.0% mgmt
Financing live
Cash to close
- Down payment
- $92,475
- Closing costs
- $11,097
- Reserves months
- —
- Total cash needed
- —
Loan-product check · same deal, 3 products live
Conventional
25% down · 7.5% · 30yr
- Down + closing
- —
- Monthly P&I
- —
- Monthly cashflow
- —
- DSCR
- —
- Eligible?
- —
Personal DTI + credit; lowest rate.
DSCR
20% down · 8.5% · 30yr
- Down + closing
- —
- Monthly P&I
- —
- Monthly cashflow
- —
- DSCR
- —
- Eligible?
- —
No personal income docs; deal must DSCR.
Hard money
10% down · 12.0% · 12mo
- Down + closing
- —
- Monthly P&I
- —
- Monthly cashflow
- —
- DSCR
- —
- Eligible?
- —
Short-term bridge; refi at stabilization.
Rent comps 40 comps
| Address | Beds | Baths | Sqft | Rent | $/sqft | DOM | Units | Dist |
|---|---|---|---|---|---|---|---|---|
| 194 Paseo Bravo Palm Desert, CA | 2.0 | 3.0 | 1307 | $2,500 | $1.91 | 43d | 1 | 0.02mi |
| 245 Paseo Gregario Palm Desert, CA | 2.0 | 2.0 | 1602 | $2,700 | $1.69 | 43d | 1 | 0.06mi |
| 520 Calle Vibrante Unit 520 Palm Desert, CA | 3.0 | 6.0 | 1873 | $4,000 | $2.14 | 43d | 1 | 0.24mi |
| 510 Calle Vibrante Palm Desert, CA | 3.0 | 2.5 | 1624 | $2,695 | $1.66 | 17d | 1 | 0.26mi |
| 635 Calle Vibrante Palm Desert, CA | 3.0 | 2.5 | 1574 | $2,800 | $1.78 | 43d | 1 | 0.28mi |
| 607 Calle Vibrante Palm Desert, CA | 3.0 | 2.0 | 1873 | $2,895 | $1.55 | 43d | 1 | 0.30mi |
| 607 Calle Vibrante Palm Desert, CA | 3.0 | 2.5 | 1873 | $2,795 | $1.49 | 23d | 1 | 0.30mi |
| 432 Desert Falls Dr N Palm Desert, CA | 3.0 | 2.5 | 1814 | $4,800 | $2.65 | 43d | 1 | 0.42mi |
| 413 Desert Falls Dr N Palm Desert, CA | 2.0 | 2.0 | 1330 | $6,200 | $4.66 | 43d | 1 | 0.43mi |
| 474 Evergreen Ash Palm Desert, CA | 2.0 | 2.0 | 1330 | $2,850 | $2.14 | 24d | 1 | 0.51mi |
| 38061 Crocus Ln Palm Desert, CA | 2.0 | 2.5 | 1515 | $5,000 | $3.30 | 43d | 1 | 0.52mi |
| 491 Desert Falls Dr N Palm Desert, CA | 2.0 | 2.0 | 1360 | $6,500 | $4.78 | 43d | 1 | 0.57mi |
| 38780 Tandika Trl N Palm Desert, CA | 2.0 | 2.0 | 1815 | $3,900 | $2.15 | 43d | 1 | 0.71mi |
| 274 Vista Royale Cir E Palm Desert, CA | 3.0 | 2.5 | 1814 | $2,900 | $1.60 | 24d | 1 | 0.71mi |
| 319 Vista Royale Dr Palm Desert, CA | 3.0 | 2.5 | 1814 | $2,900 | $1.60 | 43d | 1 | 0.72mi |
| 551 Desert Falls Dr E Palm Desert, CA | 2.0 | 2.0 | 1330 | $5,500 | $4.14 | 43d | 1 | 0.73mi |
| 270 Vista Royale Cir E Palm Desert, CA | 3.0 | 2.5 | 1814 | $3,250 | $1.79 | 43d | 1 | 0.73mi |
| 270 Vista Royale Cir E Palm Desert, CA | 3.0 | 2.5 | 1814 | $3,250 | $1.79 | 5d | 1 | 0.73mi |
| 272 Desert Falls Dr E Palm Desert, CA | 2.0 | 2.0 | 1330 | $6,250 | $4.70 | 43d | 1 | 0.78mi |
| 38941 Kilimanjaro Dr Palm Desert, CA | 2.0 | 2.0 | 1731 | $7,000 | $4.04 | 43d | 1 | 0.80mi |
| 259 Vista Royale Cir W Palm Desert, CA | 2.0 | 2.0 | 1330 | $5,600 | $4.21 | 43d | 1 | 0.85mi |
| 248 Vista Royale Cir W Palm Desert, CA | 2.0 | 2.0 | 1330 | $4,999 | $3.76 | 43d | 1 | 0.86mi |
| 127 Villa Ct Palm Desert, CA | 2.0 | 2.0 | 1330 | $6,800 | $5.11 | 43d | 1 | 0.88mi |
| 139 Villa Ct Palm Desert, CA | 2.0 | 2.0 | 1330 | $6,200 | $4.66 | 43d | 1 | 0.89mi |
| 221 Vista Royale Cir E Palm Desert, CA | 2.0 | 2.0 | 1360 | $5,900 | $4.34 | 24d | 1 | 0.89mi |
| 237 Vista Royale Cir W Palm Desert, CA | 3.0 | 2.5 | 1814 | $6,200 | $3.42 | 43d | 1 | 0.91mi |
| 156 Falls Ct Palm Desert, CA | 3.0 | 2.5 | 1814 | $6,000 | $3.31 | 43d | 1 | 0.92mi |
| 221 Vista Royale Cir W Palm Desert, CA | 2.0 | 2.5 | 1360 | $5,900 | $4.34 | 24d | 1 | 0.93mi |
| 37600 College Dr Palm Desert, CA | 1.0–3.0 | 1.0–2.5 | 1195 | $2,458 | $2.06 | 1d | 21 | 0.95mi |
| 216 Desert Falls Dr E Palm Desert, CA | 2.0 | 2.0 | 1330 | $3,250 | $2.44 | 43d | 1 | 0.96mi |
| 651 Vista Lago Cir N Palm Desert, CA | 2.0 | 2.0 | 1330 | $5,700 | $4.29 | 43d | 1 | 0.97mi |
| 709 Vista Lago Cir N Palm Desert, CA | 2.0 | 2.0 | 1360 | $2,700 | $1.99 | 43d | 1 | 1.00mi |
| 207 Desert Falls Cir Palm Desert, CA | 2.0 | 2.0 | 1330 | $6,200 | $4.66 | 43d | 1 | 1.00mi |
| 199 Desert Falls Dr E Palm Desert, CA | 2.0 | 2.0 | 1330 | $6,200 | $4.66 | 43d | 1 | 1.02mi |
| 187 Desert Falls Cir Palm Desert, CA | 3.0 | 2.5 | 1814 | $5,999 | $3.31 | 43d | 1 | 1.06mi |
| 189 Desert Falls Cir Palm Desert, CA | 2.0 | 2.5 | 1814 | $6,500 | $3.58 | 43d | 1 | 1.06mi |
| 182 Desert Falls Cir Palm Desert, CA | 2.0 | 2.0 | 1330 | $6,200 | $4.66 | 43d | 1 | 1.08mi |
| 41515 Stanford Rd Palm Desert, CA | 3.0 | 3.0 | 1725 | $2,895 | $1.68 | 24d | 1 | 1.09mi |
| 38613 Wisteria Dr Palm Desert, CA | 2.0 | 2.0 | 1550 | $6,875 | $4.44 | 3d | 1 | 1.10mi |
| 164 Desert Falls Dr E Palm Desert, CA | 2.0 | 2.0 | 1330 | $3,000 | $2.26 | 43d | 1 | 1.12mi |
HOA detail condo
- Monthly dues
- $545 · $6,540/yr
- Likely covers
- waterlandscapingpoolgymsecurity
- Assessments
- None detected in remarks — confirm with the listing agent.
Listing history 7 events
-
2026-06-18days on market $369,900 Active 4 DOM
-
2026-06-17remarks 447-char remark
-
2026-06-17days on market $369,900 Active 3 DOM
-
2026-06-16days on market $369,900 Active 2 DOM
-
2026-06-15status $369,900 Active 1 DOM
-
2026-06-13remarks 418-char remark
-
2026-06-13$369,900 Coming Soon 1 DOM
ⓘ Source: listings_history table (triggers on properties + properties_extension) + one-shot
backfill from property_details.listing_events for pre-trigger history.
Tax reassessment forecast CA · Resets to sale price
- Current annual tax
- $4,744 · $395/mo
- Projected year-2 tax
- $4,744 · $395/mo
- Expected delta
- $0/yr ($0/mo · 0.0%)
ⓘ Screening estimate from a state-policy table — verify with the county assessor before closing.
Climate risk First Street
- Flood 1/10 Low FEMA zone X (unshaded) · 0% chance over 30 yrs
- Wildfire 4/10 Moderate
- Heat 9/10 Extreme 7 d/yr ≥114°F today · 19 d/yr by 30 yrs out
- Wind 1/10 Low
- Air quality 4/10 Moderate 5 unhealthy d/yr today · 7 by 30 yrs out
Nearby sold comps map
Loading sold comps map…
Walkable amenities ~0.75 mi
Loading nearby amenities…
Taxation est. · year 1
- Rental income
- $45,906
- − Mortgage interest
- −$20,720
- − Property taxes
- −$4,744
- − Insurance
- −$1,850
- − Repairs & maintenance
- −$3,673
- − Management
- −$3,673
- − HOA
- −$6,540
- − Depreciation
- −$10,761
- Taxable loss
- −$6,053
- Est. tax savings @ 24.0%
- +$1,453
- After-tax cash flow
- $1,308/yr
For passive investors: Depreciation is non-cash, so a rental often shows a tax loss while cash-flowing — sheltering income. Rental losses are passive: they offset passive income freely, and up to $25,000/yr can offset ordinary (W-2) income if you actively participate and your MAGI is under $100k (phasing out to $0 by $150k); unused losses carry forward. On sale, claimed depreciation is recaptured at up to 25%, and gains may owe capital-gains tax (a 1031 exchange can defer both). Figures are a year-1 estimate at your 24.0% rate — not tax advice; consult a CPA.
Schools (NCES district)
- District
- Palm Springs Unified
- NCES district ID
- 0629550
- Math proficiency
- 21% ▼ -7.00%
- Reading proficiency
- 42% ▬ 0.00%
- Median HH income
- $43,638
- Composite
- 26.76/100
- National rank
- #7131
- State rank
- #328 of 517 in CA
Livability — Palm Desert
- Score
- 51/100
- State rank
- #1050
- US rank
- #25164
Category grades
Schools grade is shown separately in the Schools card above.
Census & demographics
- Census place
- Palm Desert, CA
- County
- Riverside County · 2,287,001 people
- City population
- 58,615
- Metro
- Riverside-San Bernardino-Ontario, CA
- Population (ZIP)
- 28,092
- Household income
- $88,477
- Rent vs Own
- Severe rent burden
- 1181.0
Population outlook (Riverside County) Hauer SSP2
- Today (2025)
- 2,664,475 people
- By 2030
- 2,802,692 · +5.2%
- By 2040
- 3,050,904 · +14.5%
- By 2050
- 3,256,783 · +22.2%
- By 2075
- 3,655,058 · +37.2%
- By 2100
- 3,766,594 · +41.4%
Race, ethnicity, and origin ACS 2023
- Neighborhood character
- Predominantly White (75%)
- Race & ethnicity
- White 75% Hispanic / Latino 16% Two or more races 11% Asian 4% Black 3% Native American 1%
- Hispanic origin (detail)
- Mexican 12%
- Common ancestry
- Scotch-Irish 3% Slovak 3% Romanian 3%
- Foreign-born
- 16% · Canada, China
- Languages at home
- 85% English-only · Spanish 9% Other Indo-European 2% Tagalog/Filipino 1%
Political lean MEDSL · Riverside
- 2024 margin
- Toss-up / Even · D 48.0% · R 49.3% · Other 2.6%
- 2008→2024 swing
- -3.6pp toward R · 2008: 2.3pp · 2024: -1.3pp
- All cycles
- 2024: R+1.3 2020: D+8.0 2016: D+4.3 2012: R+0.4 2008: D+2.3
Not yet ingested
- Civics
- —
Market trends
- HPI YoY
- ▼ -166.92%
- Current HPI
- 233.4619
- Rent YoY
- ▼ -0.30%
- Metro
- Riverside-San Bernardino-Ontario, CA
- State GDP YoY
- ▲ 3.21%
- F500 in state
- 116
Industry mix (Fortune 500 HQ in CA)
| Industry | F500 HQs | Revenue |
|---|---|---|
| Technology | 27 | $1,492B |
|
||
| Financial Services | 3 | $174B |
|
||
| Retail | 3 | $44B |
|
||
| Insurance | 3 | $26B |
|
||
| Media / Entertainment | 2 | $115B |
|
||
| Pharmaceuticals / Biotech | 2 | $62B |
|
||
Price history
+68.9% since first listed12 events — show timeline
- 2026-06-12 Coming Soon $369,900 CRMLS
- 2022-06-27 Price Changed $2,400 RENT.
- 2019-08-02 Sold (Public Records) $238,500 Public Records
- 2019-08-02 Sold (MLS) $238,500 GPSMLS
- 2019-06-24 Pending — GPSMLS
- 2019-06-22 Listed $244,900 GPSMLS
- 2018-03-28 Sold (Public Records) $220,000 Public Records
- 2018-03-28 Sold (MLS) $220,000 GPSMLS
- 2018-03-18 Pending — GPSMLS
- 2018-03-01 Pending — GPSMLS
- 2018-02-26 Price Changed $216,500 GPSMLS
- 2018-01-24 Listed $219,000 GPSMLS
Property tax history
+3.2%/yrLatest (2025): $4,744 · -0.3% YoY. Source: county tax records.
Cash-flow waterfall
monthlySold comps — $/sqft
last 12 mo · ≤1 miLoading sold comps…