 🏗️ New Construction
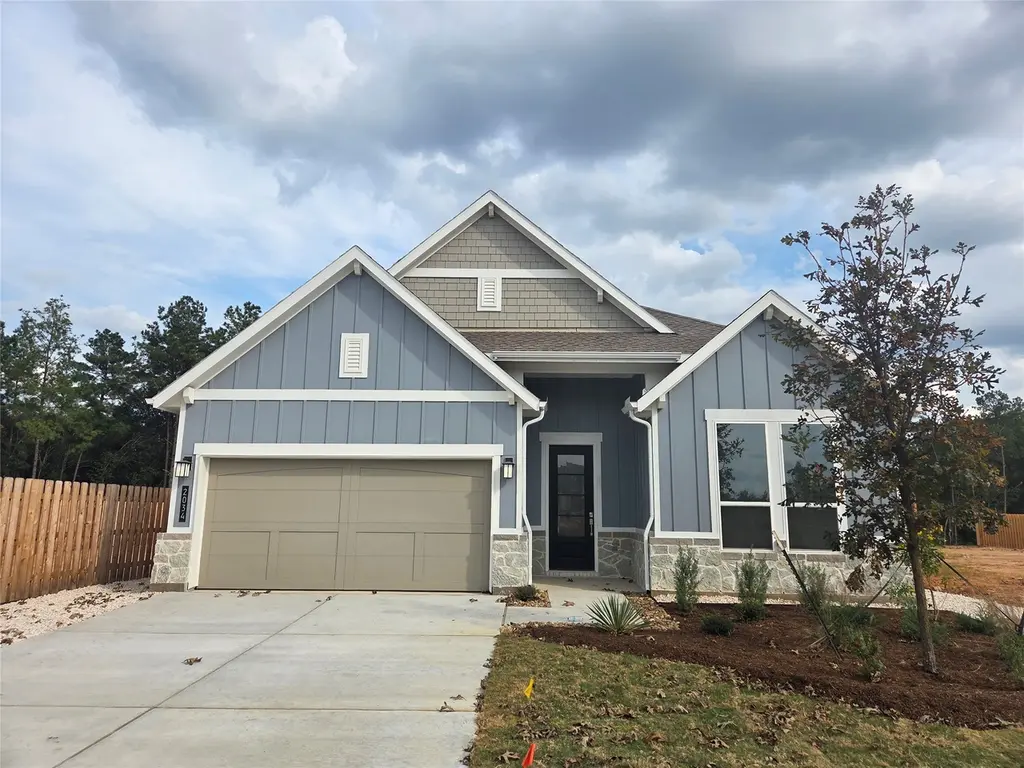
2108 Stillhouse Dr · Magnolia, TX
Flood risk No data
- FEMA flood zone
- —
- Chance of flooding over 30 yrs
- —
- Est. flood insurance / yr
- —
Fire risk No data
- Est. fire insurance / yr
- —
Heat risk No data
- Hot days now (above threshold)
- —
- Hot days in 30 yrs
- —
Wind risk No data
- Chance of severe wind over 30 yrs
- —
Air-quality risk No data
- Unhealthy air days now
- —
- Unhealthy air days in 30 yrs
- —
Risk factors via First Street. Map © Google.
Why this score? — see what drove the F grade
The composite is a weighted blend of 9 inputs, each scored 0–100. Each bar is that input's sub-score; the figure is the points it added to the 100-point composite (weight × sub-score).
- ARV discount +7.5/15.0
- Schools +3.9/10.0
- Livability +3.7/5.0
- Cash flow +3.6/30.0
- Rent growth +2.6/5.0
- Condition / age +2.5/5.0
- 1% rule +0.3/10.0
- DSCR +0.0/10.0
- Appreciation +0.0/10.0
$361,990
🖨 Deal sheet (PDF) 📄 Offer letter ✓ Due diligence
Listing remarks
The Lakewood Floor Plan - This single-story home shares an open layout between the kitchen, breakfast nook and family room for easy entertaining, along with access to a patio for year-round outdoor lounging. A luxe owner's suite is in the rear of the home and comes complete with an en-suite bathroom and walk-in closet. There are three secondary bedrooms at the front of the home, ideal for overnight guests or residents needing additional privacy, as well as a study to work from home. The completion date, prices and features may vary and are subject to change. Please verify with Lennar directly. Photos are for illustrative purposes only.
Key facts
- Study
- Walk-in closet
- Open layout
Tags
Property features AI
Finance
- HOA & community: Crest Management Company community; Annual association fee of $1,385
Exterior
- Parking: Attached garage with 2 spaces
- Utilities: Public water; Public sewer
- Home design: Residential property; Under construction (new construction); Slab foundation
- Construction: Brick construction; Composition roof; Built in 2026
- Exterior features: Back yard fence; Subdivision lot
Interior
- Kitchen: Dishwasher; Electric oven; Electric range; Gas oven; Gas range
- Bedrooms: Total rooms: 8
- Flooring: Carpet; Vinyl
- Bathrooms: 3 full bathrooms
- Heating & cooling: Central heating (electric and gas); Central air conditioning (electric and gas)
- Interior features: Breakfast bar; Double vanity; Open kitchen/family room layout; Kitchen/dining combo; Separate shower; Tub with shower
- Laundry & utility: Washer hookup; Electric dryer hookup; Gas dryer hookup
Neighborhood map
What this means for you Summary
Snapshot
- This is a 4-bed/3.0-bath land listed at $362k.
Deal economics
- At list price, monthly cash flow is $-1k ($-16k/yr) — negative.
- To cash-flow at today's rent, offer at most $292k (19.2% below list).
- To meet the 1% rule (rent ≥ 1% of price), the offer needs to be $233k (35.7% below list).
- Recommended offer: $233k (35.7% below list) — sets the bar for 1% rule.
- Cap rate 2.7% vs local median 3.4% in Magnolia — below-typical yield; the buyer is paying a premium for something (appreciation thesis, condition, location) that the cap rate doesn't capture.
Location & tenants
- Location reads 73/100 on livability (#222 in TX) — a middle-class / working-renter tenant base. Strengths: crime A+, cost of living A+, housing A+; Watch: amenities F, commute F.
- Magnolia ISD (rural): math 42% / reading 45% proficiency, ranked #247 of 826 in TX (top 30%) — families likely to look elsewhere, expect single-tenant / working-renter base with shorter leases.
- Zoned schools: Willie E Williams El (math 46% / reading 41%, grade F, #1,269 of 4,322 statewide, top 30%, 869 students, 70% FRL); Magnolia J H (math 35% / reading 37%, grade F, #805 of 1,662 statewide, top 50%, 1,103 students, 57% FRL); Magnolia H S (math 47% / reading 62%, grade C-, #379 of 1,632 statewide, top 26%, 2,248 students, 31% FRL).
- Market conditions: Rents flat; 2300 active listings in the ZIP; high-income renter base; 13,259 units permitted in Montgomery County in 2024 (1,402 in 5+ unit buildings).
Forward outlook
- Local home prices are declining (-3.0%/yr); year-one equity from $3k of loan paydown is wiped out by about $13k of value loss. Plan a longer hold.
- Montgomery County population projected at +65% by 2050 — long-run rental-demand tailwind backs the buy-and-hold thesis.
Negotiation context
- It's been on market 17 days — a 2% lower offer ($357k) is reasonable based on typical stale-listing flexibility.
- 2 sale attempts with the ask held roughly flat each time — persistent listings suggest the price (not the market) is what's stuck; bring a comps-based counter.
Questions for the listing agent
- What do current leases actually rent for vs. the listed asking? Can we see a recent rent roll and the last 12 months of T-12 income?
- What does the HOA fee cover, when was the last increase, and are there any pending special assessments or reserve-fund shortfalls?
- Is there a deadline driving the sale (1031 exchange, divorce, estate, relocation)? That informs how much negotiation room exists.
- Schools are D-rated, which usually means shorter tenancies and higher turnover. Who's the typical renter profile here, and what's been the actual vacancy rate?
- The area grade is low — what's the realistic commute time and amenity access for the typical tenant pool here? Any planned neighborhood developments (good or bad) we should know about?
- What's the average days-on-market for RENTAL listings here right now (not sales)? A rising rental-DOM trend means longer vacancies and softer asking-rent achievability than the comps imply.
- What's the recent tenant-quality profile in this submarket — average credit score on applications, eviction rate, late-payment / NSF rate, and stable-employment percentage? A property-management company in the area should have these aggregated.
- How much new for-sale + rental construction is in the pipeline within 1–3 miles? Heavy new supply typically softens prices + rents 12–24 months out; constrained supply supports both.
Investment metrics
- 1% rule
- 0.53% ✗
- Cap rate
- 2.73%
- Cash-on-cash
- -12.71%
- DSCR
- 0.43
- GRM
- 15.6
CMA / ARV
- ARV (median comp)
- $436,990
- List price
- $361,990
- Delta
- -20.60%
- Verdict
- UNDERPRICED
- Comps
- 20 within 1.0 mi
Projected returns pro-forma
-3.0% appreciation · 0.4% rent growth · sell at horizon
- IRR
- -42.9%
- Equity multiple
- -0.30×
- Total profit
- $-159,164
- Equity at exit
- $65,157
- IRR
- -93.5%
- Equity multiple
- -1.19×
- Total profit
- $-267,552
- Equity at exit
- $37,783
Cash invested: $122,357 (down + closing). Projections, not guarantees.
Landlord ↔ Tenant lean methodology
- Overall (STATE)
- 87 Strongly Landlord-Friendly
- State Texas
- 87 Strongly Landlord-Friendly · R+5
- County
- — inherits STATE
- City
- — inherits STATE
ZIP-level market 77316
- Home prices YoY
- -10.7%
- Rents YoY
- 0.4%
- Active inventory
- 2300
- Price-to-rent
- 13.0×
Monthly cashflow live
- Estimated rent
- $2,328 medium interval (Pro) →
- Mortgage (P&I)
- −$2,292
- Tax est. 1.5%
- −$546 /mo · $6,555/yr
- Insurance
- −$182
- HOA
- −$115
- Vacancy / Maint / Mgmt
- −$489
- Net cashflow
- $-1,296
Break-even live
Sensitivity live
| Price | -10% $-571 | -5% $-1,145 | +0% $-1,296 | +5% $-1,447 | +10% $-1,598 |
|---|---|---|---|---|---|
| Rent | -10% $-1,480 | -5% $-1,388 | +0% $-1,296 | +5% $-1,204 | +10% $-1,112 |
| Rate | -1.0pp $-1,076 | -0.5pp $-1,185 | base $-1,296 | +0.5pp $-1,409 | +1.0pp $-1,524 |
UW: 25.0% down · 7.5% · 30yr · 1.5% tax · 5.0% vac · 8.0% maint · 8.0% mgmt
Financing live
Cash to close
- Down payment
- $109,248
- Closing costs
- $13,110
- Reserves months
- —
- Total cash needed
- —
Loan-product check · same deal, 3 products live
Conventional
25% down · 7.5% · 30yr
- Down + closing
- —
- Monthly P&I
- —
- Monthly cashflow
- —
- DSCR
- —
- Eligible?
- —
Personal DTI + credit; lowest rate.
DSCR
20% down · 8.5% · 30yr
- Down + closing
- —
- Monthly P&I
- —
- Monthly cashflow
- —
- DSCR
- —
- Eligible?
- —
No personal income docs; deal must DSCR.
Hard money
10% down · 12.0% · 12mo
- Down + closing
- —
- Monthly P&I
- —
- Monthly cashflow
- —
- DSCR
- —
- Eligible?
- —
Short-term bridge; refi at stabilization.
HOA detail
- Monthly dues
- $115 · $1,380/yr
Listing history 25 events
-
2026-06-07status $361,990 Pending 17 DOM
-
2026-06-04days on market $361,990 Active 17 DOM
-
2026-06-03days on market $361,990 Active 16 DOM
-
2026-06-02days on market $361,990 Active 15 DOM
-
2026-06-01days on market $361,990 Active 14 DOM
-
2026-05-31days on market $361,990 Active 13 DOM
-
2026-05-19price $361,990 461-char remark
-
2026-05-18$361,990 Active 643-char remark
-
2026-05-18historical
-
2026-05-07price $346,990 461-char remark
-
2026-05-06price $346,990
-
2026-05-01price $339,990 461-char remark
-
2026-04-30price $339,990
-
2026-04-22price $344,990 461-char remark
-
2026-04-20price $344,990
-
2026-04-17price $349,990 461-char remark
-
2026-04-16price $349,990
-
2026-04-07status Active 461-char remark
-
2026-04-07price $343,590 461-char remark
-
2026-04-06price $343,240
-
2026-04-04historical 461-char remark
-
2026-03-30price $363,590
-
2026-03-30price $363,590 461-char remark
-
2026-03-04$369,990 Active
-
2026-02-28$369,990 Active 461-char remark
ⓘ Source: listings_history table (triggers on properties + properties_extension) + one-shot
backfill from property_details.listing_events for pre-trigger history.
Tax reassessment forecast TX · Resets to sale price
- Current annual tax
- $830 · $69/mo
- Projected year-2 tax
- $6,624 · $552/mo
- Expected delta
- +$5,794/yr (+$483/mo · 698.2%)
ⓘ Screening estimate from a state-policy table — verify with the county assessor before closing.
Nearby sold comps map
Loading sold comps map…
Walkable amenities ~0.75 mi
Loading nearby amenities…
Taxation est. · year 1
- Rental income
- $27,938
- − Mortgage interest
- −$24,478
- − Property taxes
- −$6,555
- − Insurance
- −$2,185
- − Repairs & maintenance
- −$2,235
- − Management
- −$2,235
- − HOA
- −$1,380
- − Depreciation
- −$12,712
- Taxable loss
- −$23,842
- Est. tax savings @ 24.0%
- +$5,722
- After-tax cash flow
- $-9,826/yr
For passive investors: Depreciation is non-cash, so a rental often shows a tax loss while cash-flowing — sheltering income. Rental losses are passive: they offset passive income freely, and up to $25,000/yr can offset ordinary (W-2) income if you actively participate and your MAGI is under $100k (phasing out to $0 by $150k); unused losses carry forward. On sale, claimed depreciation is recaptured at up to 25%, and gains may owe capital-gains tax (a 1031 exchange can defer both). Figures are a year-1 estimate at your 24.0% rate — not tax advice; consult a CPA.
Schools (NCES district)
- District
- Magnolia ISD
- NCES district ID
- 4828740
- Math proficiency
- 42% ▼ -7.00%
- Reading proficiency
- 45% ▼ -4.00%
- Median HH income
- $71,692
- Composite
- 39.46/100
- National rank
- #3958
- State rank
- #247 of 826 in TX
Livability — Magnolia
- Score
- 73/100
- State rank
- #222
- US rank
- #5442
Category grades
Schools grade is shown separately in the Schools card above.
Census & demographics
- County
- Montgomery County · 663,713 people
- City population
- 32,847
- Metro
- Houston-The Woodlands-Sugar Land, TX
- Population (ZIP)
- 34,694
- Household income
- $124,055
- Rent vs Own
- Severe rent burden
- 273.0
Population outlook (Montgomery County) Hauer SSP2
- Today (2025)
- 713,896 people
- By 2030
- 805,263 · +12.8%
- By 2040
- 992,708 · +39.1%
- By 2050
- 1,179,590 · +65.2%
- By 2075
- 1,628,084 · +128.1%
- By 2100
- 1,937,880 · +171.5%
Race, ethnicity, and origin ACS 2023
- Neighborhood character
- Predominantly White (80%)
- Race & ethnicity
- White 80% Hispanic / Latino 14% Two or more races 11% Black 1% Asian 1%
- Hispanic origin (detail)
- Mexican 9%
- Common ancestry
- Lithuanian 6% Slovak 3% Romanian 3%
- Foreign-born
- 6% · Canada
- Languages at home
- 90% English-only · Spanish 8%
Political lean MEDSL · Montgomery
- 2024 margin
- Solid R (+45.5) · D 26.8% · R 72.3%
- 2008→2024 swing
- +7.2pp toward D · 2008: -52.7pp · 2024: -45.5pp
- All cycles
- 2024: R+45.5 2020: R+43.8 2016: R+51.4 2012: R+60.7 2008: R+52.7
Not yet ingested
- Civics
- —
Market trends
- HPI YoY
- ▼ -31.44%
- Current HPI
- 262.6973
- Rent YoY
- ▲ 0.40%
- Metro
- Houston-The Woodlands-Sugar Land, TX
- State GDP YoY
- ▲ 3.95%
- F500 in state
- 110
Industry mix (Fortune 500 HQ in TX)
| Industry | F500 HQs | Revenue |
|---|---|---|
| Energy | 16 | $1,198B |
|
||
| Technology | 5 | $198B |
|
||
| Engineering / Construction | 4 | $72B |
|
||
| Energy Services | 3 | $60B |
|
||
| Utilities | 3 | $41B |
|
||
| Healthcare | 2 | $330B |
|
||
Price history
-2.2% since first listed10 events — show timeline
- 2026-06-05 Pending — HARMLS
- 2026-05-18 Listing Removed — HARMLS
- 2026-05-18 Listed $361,990 HARMLS
- 2026-05-06 Price Changed $346,990 HARMLS
- 2026-04-30 Price Changed $339,990 HARMLS
- 2026-04-20 Price Changed $344,990 HARMLS
- 2026-04-16 Price Changed $349,990 HARMLS
- 2026-04-06 Price Changed $343,240 HARMLS
- 2026-03-30 Price Changed $363,590 HARMLS
- 2026-03-04 Listed $369,990 HARMLS
Cash-flow waterfall
monthlySold comps — $/sqft
last 12 mo · ≤1 miLoading sold comps…