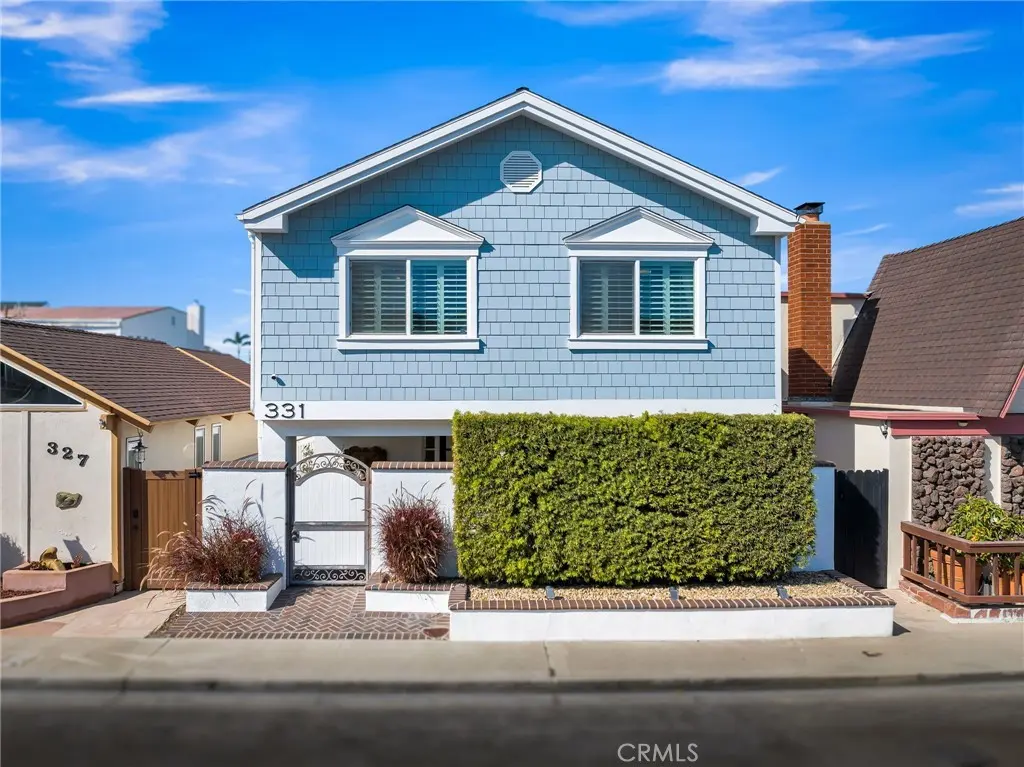
331 Walnut St · Newport Beach, CA
Flood risk 9/10 · Severe
- FEMA flood zone
- X
- Chance of flooding over 30 yrs
- 0.99%
- Est. flood insurance / yr
- $507 – $1,088
Fire risk 1/10 · Minimal
- Est. fire insurance / yr
- $659 – $1,223
Heat risk 5/10 · Moderate
- Hot days now (above 82°F)
- 7 days/yr
- Hot days in 30 yrs
- 20 days/yr
Wind risk 1/10 · Minimal
- Chance of severe wind over 30 yrs
- —
Air-quality risk 4/10 · Minor
- Unhealthy air days now
- 6 days/yr
- Unhealthy air days in 30 yrs
- 6 days/yr
Risk factors via First Street. Map © Google.
Why this score? — see what drove the D grade
The composite is a weighted blend of 9 inputs, each scored 0–100. Each bar is that input's sub-score; the figure is the points it added to the 100-point composite (weight × sub-score).
- ARV discount +15.0/15.0
- Appreciation +10.0/10.0
- Schools +4.8/10.0
- Livability +3.8/5.0
- Rent growth +3.1/5.0
- Condition / age +2.5/5.0
- Cash flow +1.8/30.0
- 1% rule +0.0/10.0
- DSCR +0.0/10.0
$2,950,000
🖨 Deal sheet (PDF) 📄 Offer letter ✓ Due diligence
Listing remarks
Newport Shores - Positioned in West Newport Beach, this five-bedroom, five-and-one-half-bath residence offers a rare opportunity to live the Southern California coastal lifestyle steps from the sand. Thoughtfully updated throughout, the home delivers generous living spaces, refined finishes, and a versatile floor plan designed for both everyday living and effortless entertaining. At its center, a remodeled kitchen features quartz countertops, an expansive island, custom cabinetry, and a professional six-burner gas range. The kitchen opens directly into the family room and dining area beneath soaring ceilings appointed with crown molding, wainscoting, and skylights that invite coastal light
Key facts
- Expansive island
- Quartz countertops
- Soaking tub
Tags
Property features AI
Finance
- Other: Community features: curbs, sidewalks, street lighting, biking, fishing, watersports access
- HOA & community: Part of an association with monthly fee ($55/month); Association amenities include pool, spa, tennis, pickleball, sport court, playground, barbecue/outdoor cooking, picnic areas, and a multipurpose/recreational room, plus onsite property management
Exterior
- Parking: Attached garage with direct access; Garage configured with a single door; Two garage/parking spaces
- Security: Smoke and carbon monoxide detectors
- Utilities: Public/District water; Public sewer (sewer connected); Electricity connected (standard); Natural gas connected; Cable available; Telephone in street
- Home design: House; Two stories; Entry at ground level; No accessory dwelling unit (ADU); No common walls (detached)
- Construction: Stucco exterior with drywall interior walls; Composition roof; Concrete slab foundation; Year built per assessor
- Exterior features: Lighting; Terrace, lanai, rooftop and deck patios; Patio present; In-ground fenced pool managed by association; Wood fencing; Zero lot line and level/flat lot; Level with street; Views and property located across the road from lake/ocean; Turnkey/updated condition
Interior
- Kitchen: Kitchen open to family room; Kitchen island; Quartz and stone counters; Pots & pan drawers; Self-closing cabinet doors and drawers; Breakfast counter/bar; Family kitchen layout
- Bedrooms: Primary suite; Main floor bedroom
- Flooring: Carpet; Stone flooring
- Bathrooms: Five full bathrooms; One half bathroom; Separate tub and walk-in shower in primary bath; Soaking tub; Remodeled bathrooms; Bathtub and shower features; Stone/granite counters
- Heating & cooling: Central cooling; Central furnace heating; Natural gas heating
- Interior features: High ceilings (9+ feet) with two-story and cathedral/vaulted ceiling elements; Beamed ceilings; Open floor plan; Recessed lighting; Crown moldings; Wainscoting and chair railings; Built-ins; Balcony; Two staircases; Granite and quartz counters; Stone counters; Remodeled/updated; Sliding glass door(s); Double pane windows; Exhaust fans; Upgraded finishes
- Laundry & utility: Laundry inside the home; Laundry located in garage
Neighborhood map
What this means for you Summary
Snapshot
- This is a 3-bed/4.5-bath single-family listed at $2.95M.
Deal economics
- At list price, monthly cash flow is $-11k ($-134k/yr) — negative.
- To cash-flow at today's rent, offer at most $973k (67.0% below list).
- To meet the 1% rule (rent ≥ 1% of price), the offer needs to be $911k (69.1% below list).
- Recommended offer: $911k (69.1% below list) — sets the bar for 1% rule.
- Cap rate 1.8% vs local median 0.6% in Newport Beach — top-decile yield for the area; either an underpriced asset or a hidden risk that comps aren't pricing in. Stress-test before assuming the spread holds.
Location & tenants
- Location reads 76/100 on livability (#101 in CA, #3,645 nationally) — a middle-class / working-renter tenant base. Strengths: amenities A+, employment A+, commute A; Watch: health & safety C-, cost of living F.
- Newport-Mesa Unified (urban): math 46% / reading 58% proficiency, ranked #106 of 517 in CA (top 20%) — acceptable for families but not a draw, mixed tenant base, ~2y average lease.
- Zoned schools: Newport Elementary (math 67%, 313 students, 26% FRL); Horace Ensign Intermediate (math 49%, 915 students, 48% FRL); Newport Harbor High (math 44% / reading 66%, grade C, #249 of 1,170 statewide, top 22%, 2,268 students, 44% FRL) — zoned schools at 39% FRL track the district average.
- Market conditions: Rents rising (+2.6%/yr); 121 active listings in the ZIP; 25 comparable units currently listed for rent nearby; rentals at typical pace (median 16d on market — plan ~3-4 weeks tenant-placement turnaround); high-income renter base; 6,974 units permitted in Orange County in 2024 (3,839 in 5+ unit buildings).
Forward outlook
- In year one you build about $315k of equity ($20k loan paydown + $295k appreciation (10.0% local appreciation)).
- Orange County population projected at +14% by 2050 — modest demand growth; plan on rents tracking national, not racing it.
- By year 2, paydown + projected appreciation supports a ~$507k cash-out refi (75% LTV) — recoverable capital for the next deal without selling this one.
Negotiation context
- It's been on market 16 days — a 2% lower offer ($2.91M) is reasonable based on typical stale-listing flexibility.
- 14 sale attempts since 22y ago with the ask held roughly flat each time — persistent listings suggest the price (not the market) is what's stuck; bring a comps-based counter.
- Current owner paid $1.26M; list at $2.95M implies a 133% gain — meaningful room to come down on a strong offer.
Risks & watch-outs
- Watch-outs: flood insurance adds $66/mo.
- Climate carrying-cost: severe flood risk; extreme-heat days projected 7→20/yr by 2055 (HVAC capex compounding) — expect insurance premiums to compound above CPI over the hold.
Questions for the listing agent
- What do current leases actually rent for vs. the listed asking? Can we see a recent rent roll and the last 12 months of T-12 income?
- Built in 1962 — when were the roof, HVAC, electrical panel, plumbing, and water heater last replaced?
- What's the actual annual flood-insurance premium (NFIP or private), and is the property in a SFHA with mandatory coverage?
- What does the HOA fee cover, when was the last increase, and are there any pending special assessments or reserve-fund shortfalls?
- Is there a deadline driving the sale (1031 exchange, divorce, estate, relocation)? That informs how much negotiation room exists.
- Schools are A-rated — typically a magnet for longer-tenancy family renters. What's the average tenant stay here, and is there a school-zone premium baked into asking?
- The area grade is low — what's the realistic commute time and amenity access for the typical tenant pool here? Any planned neighborhood developments (good or bad) we should know about?
- What's the average days-on-market for RENTAL listings here right now (not sales)? A rising rental-DOM trend means longer vacancies and softer asking-rent achievability than the comps imply.
- What's the recent tenant-quality profile in this submarket — average credit score on applications, eviction rate, late-payment / NSF rate, and stable-employment percentage? A property-management company in the area should have these aggregated.
- How much new for-sale + rental construction is in the pipeline within 1–3 miles? Heavy new supply typically softens prices + rents 12–24 months out; constrained supply supports both.
Investment metrics
- 1% rule
- 0.31% ✗
- Cap rate
- 1.77%
- Cash-on-cash
- -16.17%
- DSCR
- 0.28
- GRM
- 27.0
CMA / ARV
- ARV (median comp)
- $3,679,988
- List price
- $2,950,000
- Delta
- -18.48%
- Verdict
- UNDERPRICED
- Comps
- 20 within 1.0 mi
Show comp detail 12 sales within ~0.75 mi
| Address | Dist | Beds/Ba | Sqft | Sold | Price | $/sf | Match |
|---|---|---|---|---|---|---|---|
| 231 Canal | 0.14mi | 4/3.0 (+1) | 2,562 (+1%) | 6mo | $3,550,000 | $1,386 | 76 |
| 315 Lugonia St | 0.05mi | 4/4.0 (+1) | 2,755 (+8%) | 2mo | $3,100,000 | $1,125 | 76 |
| 354 62nd St | 0.10mi | 3/3.0 | 2,311 (-9%) | 1mo | $3,200,000 | $1,385 | 73 |
| 223 Canal St | 0.16mi | 4/3.0 (+1) | 2,562 (+1%) | 12mo | $3,425,000 | $1,337 | 70 |
| 207 Canal St | 0.20mi | 4/4.0 (+1) | 2,431 (-4%) | 10mo | $4,060,000 | $1,670 | 68 |
| 6711 Seashore Dr | 0.23mi | 4/3.5 (+1) | 2,400 (-6%) | 9mo | $4,025,000 | $1,677 | 63 |
| 6804 West Oceanfront | 0.26mi | 4/4.5 (+1) | 2,398 (-6%) | 15mo | $8,500,000 | $3,545 | 60 |
| 5405 Seashore Dr | 0.48mi | 4/4.0 (+1) | 2,456 (-4%) | 12mo | $10,500,000 | $4,275 | 55 |
| 1645 Pocomo Way | 0.60mi | 4/3.5 (+1) | 2,274 (-11%) | 14mo | $2,200,000 | $967 | 34 |
| 1068 Hampton Dr | 0.60mi | 4/3.5 (+1) | 2,274 (-11%) | 16mo | $1,966,000 | $865 | 32 |
| 1637 Bridgewater Way | 0.61mi | 3/3.5 | 2,274 (-11%) | 22mo | $1,900,000 | $836 | 32 |
| 1641 Bridgewater Way | 0.62mi | 4/3.5 (+1) | 2,274 (-11%) | 15mo | $1,925,000 | $847 | 31 |
Match score weights: distance 35% · size 25% · config 20% · recency 20%. Top-matched comps best support the ARV.
Projected returns pro-forma
10.0% appreciation · 2.56% rent growth · sell at horizon
- IRR
- 13.0%
- Equity multiple
- 2.08×
- Total profit
- $888,600
- Equity at exit
- $2,657,594
- IRR
- 13.2%
- Equity multiple
- 4.83×
- Total profit
- $3,167,265
- Equity at exit
- $5,731,201
Cash invested: $826,000 (down + closing). Projections, not guarantees.
Landlord ↔ Tenant lean methodology
- Overall (STATE)
- 18 Strongly Tenant-Friendly
- State California
- 18 Strongly Tenant-Friendly · D+13
- County
- — inherits STATE
- City
- — inherits STATE
ZIP-level market 92663
- Home prices YoY
- 3.6%
- Rents YoY
- 2.6%
- Active inventory
- 121
- Price-to-rent
- 27.0×
Monthly cashflow live
- Estimated rent
- $9,114 high interval (Pro) →
- Mortgage (P&I)
- −$15,470
- Tax from tax record
- −$1,573 /mo · $18,881/yr
- Insurance
- −$1,229
- Flood insurance flood zone
- −$66 /mo · $798/yr
- HOA
- −$55
- Vacancy / Maint / Mgmt
- −$1,914
- Net cashflow
- $-11,194
Break-even live
Sensitivity live
| Price | -10% $-9,524 | -5% $-10,359 | +0% $-11,194 | +5% $-12,029 | +10% $-12,864 |
|---|---|---|---|---|---|
| Rent | -10% $-11,914 | -5% $-11,554 | +0% $-11,194 | +5% $-10,834 | +10% $-10,474 |
| Rate | -1.0pp $-9,708 | -0.5pp $-10,444 | base $-11,194 | +0.5pp $-11,958 | +1.0pp $-12,736 |
UW: 25.0% down · 7.5% · 30yr · 1.5% tax · 5.0% vac · 8.0% maint · 8.0% mgmt
Financing live
Cash to close
- Down payment
- $737,500
- Closing costs
- $88,500
- Reserves months
- —
- Total cash needed
- —
Loan-product check · same deal, 3 products live
Conventional
25% down · 7.5% · 30yr
- Down + closing
- —
- Monthly P&I
- —
- Monthly cashflow
- —
- DSCR
- —
- Eligible?
- —
Personal DTI + credit; lowest rate.
DSCR
20% down · 8.5% · 30yr
- Down + closing
- —
- Monthly P&I
- —
- Monthly cashflow
- —
- DSCR
- —
- Eligible?
- —
No personal income docs; deal must DSCR.
Hard money
10% down · 12.0% · 12mo
- Down + closing
- —
- Monthly P&I
- —
- Monthly cashflow
- —
- DSCR
- —
- Eligible?
- —
Short-term bridge; refi at stabilization.
Rent comps 25 comps
| Address | Beds | Baths | Sqft | Rent | $/sqft | DOM | Units | Dist |
|---|---|---|---|---|---|---|---|---|
| 404 Prospect St Newport Beach, CA | 3.0 | 3.0 | 1960 | $10,000 | $5.10 | 0d | 1 | 0.05mi |
| 6111 Seashore Dr Newport Beach, CA | 4.0 | 5.0 | 3143 | $18,325 | $5.83 | 0d | 1 | 0.22mi |
| 7304 W Oceanfront Newport Beach, CA | 4.0 | 4.0 | 2562 | $25,000 | $9.76 | 0d | 1 | 0.41mi |
| 18 Odyssey Ct #116 Newport Beach, CA | 3.0 | 3.0 | 1778 | $7,800 | $4.39 | 0d | 1 | 0.54mi |
| 1068 Hampton Dr Costa Mesa, CA | 4.0 | 3.5 | 2274 | $7,800 | $3.43 | 0d | 1 | 0.61mi |
| 2 Escapade Ct Newport Beach, CA | 4.0 | 3.0 | 1778 | $6,400 | $3.60 | 45d | 1 | 0.84mi |
| 4405 Channel Pl Newport Beach, CA | 3.0 | 3.0 | 1836 | $15,000 | $8.17 | 0d | 1 | 0.85mi |
| 7 Balboa Cvs Newport Beach, CA | 4.0 | 4.0 | 2752 | $17,500 | $6.36 | 20d | 1 | 0.94mi |
| 52 Ebb Tide Cir Newport Beach, CA | 4.0 | 4.0 | 2229 | $8,000 | $3.59 | 15d | 1 | 1.07mi |
| 38 Ebb Tide Cir Newport Beach, CA | 4.0 | 3.5 | 1864 | $6,695 | $3.59 | 9d | 1 | 1.07mi |
| 52 Ebb Tide Cir Newport Beach, CA | 4.0 | 3.5 | 2229 | $8,000 | $3.59 | 18d | 1 | 1.07mi |
| 28 Ebb Tide Cir Newport Beach, CA | 4.0 | 3.5 | 2229 | $7,800 | $3.50 | 25d | 1 | 1.07mi |
| 13 Balboa Blvd Newport Beach, CA | 3.0 | 4.5 | 3481 | $15,000 | $4.31 | 0d | 1 | 1.07mi |
| 3715 Seashore Dr Newport Beach, CA | 3.0 | 3.5 | 2725 | $40,000 | $14.68 | 23d | 1 | 1.10mi |
| 408 38th St Newport Beach, CA | 4.0 | 2.5 | 2560 | $30,000 | $11.72 | 45d | 1 | 1.15mi |
| 606 36th St Newport Beach, CA | 4.0 | 4.0 | 2550 | $9,800 | $3.84 | 15d | 1 | 1.24mi |
| 512 35th St Newport Beach, CA | 4.0 | 3.5 | 2112 | $8,500 | $4.02 | 45d | 1 | 1.27mi |
| 3306 Marcus Ave Newport Beach, CA | 4.0 | 4.5 | 2711 | $25,000 | $9.22 | 45d | 1 | 1.31mi |
| 3306 Marcus Ave Newport Beach, CA | 4.0 | 4.5 | 2711 | $25,000 | $9.22 | 4d | 1 | 1.31mi |
| 1669 Grand Vw Costa Mesa, CA | 3.0 | 4.5 | 2142 | $5,795 | $2.71 | 45d | 1 | 1.36mi |
| 21892 Starfire Ln Huntington Beach, CA | 4.0 | 3.0 | 2265 | $5,950 | $2.63 | 4d | 1 | 1.37mi |
| 3121 W Coast Hwy Unit 7AB Newport Beach, CA | 3.0 | 2.0 | 2400 | $28,000 | $11.67 | 20d | 1 | 1.41mi |
| 664 Wedge Costa Mesa, CA | 3.0 | 3.5 | 2057 | $5,500 | $2.67 | 45d | 1 | 1.42mi |
| 1509 Orange Ave Unit A Costa Mesa, CA | 4.0 | 4.0 | 2500 | $8,000 | $3.20 | 16d | 1 | 1.43mi |
| 629 W 17th St Costa Mesa, CA | 3.0 | 4.0 | 2101 | $6,300 | $3.00 | 45d | 1 | 1.49mi |
HOA detail
- Monthly dues
- $55 · $660/yr
- Likely covers
- gas
Listing history 34 events
-
2026-06-21days on market $2,950,000 Active 16 DOM
-
2026-06-18days on market $2,950,000 Active 13 DOM
-
2026-06-17days on market $2,950,000 Active 12 DOM
-
2026-06-16days on market $2,950,000 Active 11 DOM
-
2026-06-15days on market $2,950,000 Active 10 DOM
-
2026-06-13days on market $2,950,000 Active 8 DOM
-
2026-06-13days on market $2,950,000 Active 7 DOM
-
2026-06-09days on market $2,950,000 Active 4 DOM
-
2026-06-08days on market $2,950,000 Active 3 DOM
-
2026-06-07remarks 699-char remark
-
2026-06-07pricedays on market $2,950,000 Active 2 DOM
-
2026-03-12status Active 2533-char remark
-
2025-11-07price $2,999,900 2533-char remark
-
2025-09-17status Active 2533-char remark
-
2024-12-28$3,399,900 Active 2533-char remark
-
2023-07-31status Active
-
2023-06-16status Active
-
2023-05-04price $2,995,000
-
2023-04-23status Active
-
2023-04-06historical Active Under Contract
-
2023-03-24$3,125,000 Active
-
2023-03-16historical
-
2010-08-24historical
-
2010-02-09$1,349,000 Active
-
2009-03-23historical
-
2008-09-09$1,425,000
-
2008-04-26historical
-
2008-01-10price $1,510,000
-
2007-10-24$1,610,000
-
2005-02-22soldstatus $1,265,000
-
2005-02-18soldstatus $1,265,000
-
2005-01-19$1,289,000
-
2004-12-25historical
-
2004-07-27$1,289,000
ⓘ Source: listings_history table (triggers on properties + properties_extension) + one-shot
backfill from property_details.listing_events for pre-trigger history.
Tax reassessment forecast CA · Resets to sale price
- Current annual tax
- $18,881 · $1,573/mo
- Projected year-2 tax
- $22,420 · $1,868/mo
- Expected delta
- +$3,539/yr (+$295/mo · 18.7%)
ⓘ Screening estimate from a state-policy table — verify with the county assessor before closing.
Climate risk First Street
- Flood 9/10 Extreme FEMA zone X · 99% chance over 30 yrs
- Wildfire 1/10 Low
- Heat 5/10 Major 7 d/yr ≥82°F today · 20 d/yr by 30 yrs out
- Wind 1/10 Low
- Air quality 4/10 Moderate 6 unhealthy d/yr today · 6 by 30 yrs out
Nearby sold comps map
Loading sold comps map…
Walkable amenities ~0.75 mi
Loading nearby amenities…
Taxation est. · year 1
- Rental income
- $109,372
- − Mortgage interest
- −$165,246
- − Property taxes
- −$18,881
- − Insurance
- −$15,548
- − Repairs & maintenance
- −$8,750
- − Management
- −$8,750
- − HOA
- −$660
- − Depreciation
- −$85,818
- Taxable loss
- −$194,280
- Est. tax savings @ 24.0%
- +$46,627
- After-tax cash flow
- $-87,699/yr
For passive investors: Depreciation is non-cash, so a rental often shows a tax loss while cash-flowing — sheltering income. Rental losses are passive: they offset passive income freely, and up to $25,000/yr can offset ordinary (W-2) income if you actively participate and your MAGI is under $100k (phasing out to $0 by $150k); unused losses carry forward. On sale, claimed depreciation is recaptured at up to 25%, and gains may owe capital-gains tax (a 1031 exchange can defer both). Figures are a year-1 estimate at your 24.0% rate — not tax advice; consult a CPA.
Schools (NCES district)
- District
- Newport-Mesa Unified
- NCES district ID
- 0627240
- Math proficiency
- 46% ▼ -6.00%
- Reading proficiency
- 58% ▼ -5.00%
- Median HH income
- $83,922
- Composite
- 47.64/100
- National rank
- #2248
- State rank
- #106 of 517 in CA
Livability — Newport Beach
- Score
- 76/100
- State rank
- #101
- US rank
- #3645
Category grades
Schools grade is shown separately in the Schools card above.
Census & demographics
- Census place
- Newport Beach, CA
- County
- Orange County · 3,096,323 people
- City population
- 83,845
- Metro
- Los Angeles-Long Beach-Anaheim, CA
- Population (ZIP)
- 21,368
- Household income
- $141,541
- Rent vs Own
- Severe rent burden
- 1158.0
Population outlook (Orange County) Hauer SSP2
- Today (2025)
- 3,477,456 people
- By 2030
- 3,613,117 · +3.9%
- By 2040
- 3,835,945 · +10.3%
- By 2050
- 3,968,736 · +14.1%
- By 2075
- 4,097,053 · +17.8%
- By 2100
- 3,903,633 · +12.3%
Race, ethnicity, and origin ACS 2023
- Neighborhood character
- Predominantly White (81%)
- Race & ethnicity
- White 81% Hispanic / Latino 13% Two or more races 8% Asian 3%
- Hispanic origin (detail)
- Mexican 9%
- Common ancestry
- Lithuanian 5% Italian 5% Romanian 4%
- Foreign-born
- 11% · Canada, Dominican Republic, Vietnam
- Languages at home
- 84% English-only · Spanish 7% Other Indo-European 3% Russian/Polish/Slavic 2%
Political lean MEDSL · Orange
- 2024 margin
- Toss-up / Even · D 49.7% · R 47.1% · Other 3.2%
- 2008→2024 swing
- +5.2pp toward D · 2008: -2.6pp · 2024: 2.6pp
- All cycles
- 2024: D+2.6 2020: D+9.0 2016: D+7.7 2012: R+8.3 2008: R+2.6
Not yet ingested
- Civics
- —
Market trends
- HPI YoY
- ▲ 19.24%
- Current HPI
- 552.1519
- Rent YoY
- ▲ 2.56%
- Metro
- Los Angeles-Long Beach-Anaheim, CA
- State GDP YoY
- ▲ 3.21%
- F500 in state
- 116
Industry mix (Fortune 500 HQ in CA)
| Industry | F500 HQs | Revenue |
|---|---|---|
| Technology | 27 | $1,492B |
|
||
| Financial Services | 3 | $174B |
|
||
| Retail | 3 | $44B |
|
||
| Insurance | 3 | $26B |
|
||
| Media / Entertainment | 2 | $115B |
|
||
| Pharmaceuticals / Biotech | 2 | $62B |
|
||
Price history
+128.9% since first listed25 events — show timeline
- 2026-06-05 Listed $2,950,000 CRMLS
- 2026-05-29 Relisted — CRMLS
- 2026-03-12 Relisted — CRMLS
- 2025-11-07 Price Changed $2,999,900 CRMLS
- 2025-09-17 Relisted — CRMLS
- 2024-12-28 Listed $3,399,900 CRMLS
- 2023-07-31 Relisted — CRMLS
- 2023-06-16 Relisted — CRMLS
- 2023-05-04 Price Changed $2,995,000 CRMLS
- 2023-04-23 Relisted — CRMLS
- 2023-04-06 Contingent — CRMLS
- 2023-03-24 Listed $3,125,000 CRMLS
- 2023-03-16 Coming Soon — CRMLS
- 2010-08-24 Listing Removed — CRMLS
- 2010-02-09 Listed $1,349,000 CRMLS
- 2009-03-23 Listing Removed — CRMLS
- 2008-09-09 Listed $1,425,000 CRMLS
- 2008-04-26 Listing Removed — CRMLS
- 2008-01-10 Price Changed $1,510,000 CRMLS
- 2007-10-24 Listed $1,610,000 CRMLS
- 2005-02-22 Sold (MLS) $1,265,000 CRMLS
- 2005-02-18 Sold (Public Records) $1,265,000 Public Records
- 2005-01-19 Listed $1,289,000 CRMLS
- 2004-12-25 Listing Removed — CRMLS
- 2004-07-27 Listed $1,289,000 CRMLS
Property tax history
+1.5%/yrLatest (2025): $18,881 · +1.6% YoY. Source: county tax records.
Cash-flow waterfall
monthlySold comps — $/sqft
last 12 mo · ≤1 miLoading sold comps…