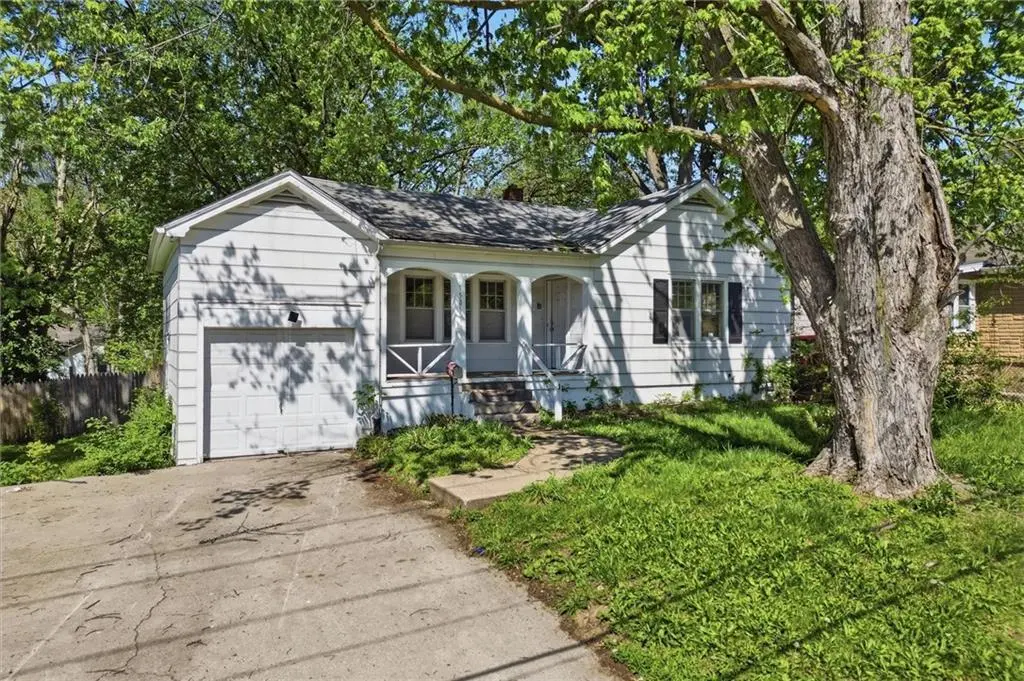
1506 S Hedges Ave · Independence, MO
Flood risk 1/10 · Minimal
- FEMA flood zone
- X (unshaded)
- Chance of flooding over 30 yrs
- 0.0%
- Est. flood insurance / yr
- $473 – $860
Fire risk 1/10 · Minimal
- Est. fire insurance / yr
- $1,054 – $1,958
Heat risk 4/10 · Minor
- Hot days now (above 106°F)
- 7 days/yr
- Hot days in 30 yrs
- 17 days/yr
Wind risk 2/10 · Minimal
- Chance of severe wind over 30 yrs
- —
Air-quality risk 3/10 · Minor
- Unhealthy air days now
- 2 days/yr
- Unhealthy air days in 30 yrs
- 3 days/yr
Risk factors via First Street. Map © Google.
Why this score? — see what drove the B+ grade
The composite is a weighted blend of 9 inputs, each scored 0–100. Each bar is that input's sub-score; the figure is the points it added to the 100-point composite (weight × sub-score).
- Cash flow +29.6/30.0
- ARV discount +15.0/15.0
- DSCR +10.0/10.0
- 1% rule +8.1/10.0
- Livability +4.1/5.0
- Rent growth +3.9/5.0
- Schools +2.7/10.0
- Condition / age +2.5/5.0
- Appreciation +0.0/10.0
$95,000
🖨 Deal sheet 📄 Offer letter ✓ Due diligence
Listing remarks MLS
Back on market, Cute ranch style home with so much potential on an extra large lot! Just a few minutes walk away from the Englewood Arts District, enjoy shopping and dining with close convenience. This home needs some TLC but seller has replaced some items such as a new water heater and HVAC is only 5 years old. New toilet installed this year as well as newer flooring in the dining and living room. This home is being sold as-is. Inspections are done and can be provided
Key facts
- Fixer-upper
- 0.32 acre lot
- Garage
Tags
Property features AI
Finance
- Other: Property listed as inside city limits
- HOA & community: No association fees
Exterior
- Parking: Attached garage with garage door opener (garage faces front) — 1 garage space
- Utilities: Public water; Public sewer
- Home design: Single-family residence; Ranch floor plan; Residential property listed as fixer; Living area approximately 1,112
- Construction: Asbestos construction materials; Composition roof; Has a concrete, unfinished basement; Estimated 76–100 years old
- Exterior features: Patio; Metal fencing; Located within city limits; Paved road access with public maintenance
Interior
- Kitchen: Kitchen with linoleum flooring and laminate counters; Dining area with laminate counters and ceiling fan
- Bedrooms: 3 bedrooms on the first floor
- Flooring: Carpet in bedrooms and some rooms; Laminate counters noted in living and dining areas; Linoleum in kitchen and laundry; Ceramic tile in bathroom
- Bathrooms: 1 full bathroom with ceramic tile and shower-over-tub
- Heating & cooling: Forced air heating; Electric cooling
- Interior features: Wood windows; Storm doors; Mud room; Eat-in kitchen / kitchen-dining combo
- Laundry & utility: Laundry room off the kitchen with linoleum flooring
Neighborhood map
What this means for you Summary
Snapshot
- This is a 3-bed/1.0-bath single-family listed at $95k.
Deal economics
- At list price, monthly cash flow is $342 ($4k/yr) — positive.
- The deal already cash-flows at list — no discount required.
- Meets the 1% rule at list price ($1k rent vs $95k).
- Cap rate 10.6% vs local median 5.0% in Independence — top-decile yield for the area; either an underpriced asset or a hidden risk that comps aren't pricing in. Stress-test before assuming the spread holds.
Location & tenants
- Location reads 82/100 on livability (#10 in MO, #1,296 nationally) — a professional / high-income tenant draw. Strengths: amenities A+, commute A+, cost of living A+; Watch: employment D+, crime F.
- Independence 30 (suburban): math 26% / reading 38% proficiency, ranked #252 of 324 in MO (top 78%) — families likely to look elsewhere, expect single-tenant / working-renter base with shorter leases.
- Zoned schools: Abraham Mallinson Elementary (math 20% / reading 34%, grade F, #850 of 1,115 statewide, top 78%, 272 students, 80% FRL); Van Horn High (math 13% / reading 27%, grade F, #472 of 521 statewide, top 91%, 1,047 students, 72% FRL) — zoned schools average 76% FRL vs 58% district-wide (18 pts higher); higher-poverty schools than district average — tighter screening recommended.
- Market conditions: Rents rising fast (+5.4%/yr); 127 active listings in the ZIP; 29 comparable units currently listed for rent nearby; rentals at typical pace (median 20d on market — plan ~3-4 weeks tenant-placement turnaround); 4,002 units permitted in Jackson County in 2024 (2,271 in 5+ unit buildings).
Forward outlook
- Local home prices are declining (-3.0%/yr); year-one equity from $657 of loan paydown is wiped out by about $3k of value loss. Plan a longer hold.
- Jackson County population projected at +4% by 2050 — modest demand growth; plan on rents tracking national, not racing it.
- At projected returns (-3.0% appreciation + 5.4% rent growth), your $27k cash investment doubles in ~7 years — after that, you're playing with house money.
Negotiation context
- Only 7 days on market — expect competitive offers; lowballing is unlikely to land.
- 6 sale attempts since 16y ago with the ask held roughly flat each time — persistent listings suggest the price (not the market) is what's stuck; bring a comps-based counter.
Risks & watch-outs
- Watch-outs: built in 1944 — expect roof / HVAC / electrical / plumbing capex.
Questions for the listing agent
- Built in 1944 — when were the roof, HVAC, electrical panel, plumbing, and water heater last replaced?
- Is there a deadline driving the sale (1031 exchange, divorce, estate, relocation)? That informs how much negotiation room exists.
- Crime grade is F in this area — have there been break-ins, vandalism, or insurance claims at this property in the last 3 years? What carrier currently insures it and at what premium?
- What's the average days-on-market for RENTAL listings here right now (not sales)? A rising rental-DOM trend means longer vacancies and softer asking-rent achievability than the comps imply.
- What's the recent tenant-quality profile in this submarket — average credit score on applications, eviction rate, late-payment / NSF rate, and stable-employment percentage? A property-management company in the area should have these aggregated.
- How much new for-sale + rental construction is in the pipeline within 1–3 miles? Heavy new supply typically softens prices + rents 12–24 months out; constrained supply supports both.
Investment metrics
- 1% rule
- 1.31% ✓
- Cap rate
- 10.61%
- Cash-on-cash
- 15.41%
- DSCR
- 1.69
- GRM
- 6.4
CMA / ARV
- ARV (on-the-fly)
- $162,352
- Comps found
- 12
Show comp detail 12 sales within ~0.75 mi
| Address | Dist | Beds/Ba | Sqft | Sold | Price | $/sf | Match |
|---|---|---|---|---|---|---|---|
| 1600 S Ralston Ave | 0.10mi | 3/1.0 | 1,025 (-8%) | 2mo | $150,000 | $146 | 80 |
| 10600 E 19th Ter | 0.37mi | 3/1.0 | 1,120 (+1%) | 2mo | $119,900 | $107 | 80 |
| 1515 S Home Ave | 0.41mi | 3/1.5 | 1,104 (-1%) | 0mo | $150,000 | $136 | 77 |
| 10143 E Golf Ave | 0.51mi | 3/1.0 | 1,135 (+2%) | 0mo | $119,900 | $106 | 73 |
| 10531 E 9th St S | 0.50mi | 3/2.0 | 1,175 (+6%) | 2mo | $180,000 | $153 | 61 |
| 1806 S Evanston Ave | 0.68mi | 3/2.0 | 1,100 (-1%) | 3mo | $175,000 | $159 | 60 |
| 823 S Huttig Ave | 0.63mi | 3/2.0 | 1,052 (-5%) | 2mo | $76,000 | $72 | 56 |
| 2005 S Hedges Ave | 0.53mi | 2/1.0 (-1) | 1,220 (+10%) | 2mo | $159,000 | $130 | 53 |
| 1510 S Vermont Ave | 0.52mi | 3/2.0 | 1,237 (+11%) | 1mo | $215,000 | $174 | 52 |
| 1511 S Evanston St | 0.64mi | 3/1.0 | 1,258 (+13%) | 3mo | $180,000 | $143 | 45 |
| 11214 E 10th St S | 0.66mi | 3/2.0 | 1,247 (+12%) | 2mo | $210,000 | $168 | 43 |
| 809 S Carlisle Ave | 0.58mi | 2/1.0 (-1) | 950 (-15%) | 2mo | $180,000 | $189 | 42 |
Match score weights: distance 35% · size 25% · config 20% · recency 20%. Top-matched comps best support the ARV.
Projected returns pro-forma
-3.0% appreciation · 5.43% rent growth · sell at horizon
- IRR
- 8.8%
- Equity multiple
- 1.36×
- Total profit
- $9,480
- Equity at exit
- $14,165
- IRR
- 20.0%
- Equity multiple
- 2.87×
- Total profit
- $49,698
- Equity at exit
- $8,214
Cash invested: $26,600 (down + closing). Projections, not guarantees.
Landlord ↔ Tenant lean methodology
- Overall (STATE)
- 81 Strongly Landlord-Friendly
- State Missouri
- 81 Strongly Landlord-Friendly · R+10
- County
- — inherits STATE
- City
- — inherits STATE
ZIP-level market 64052
- Home prices YoY
- -34.6%
- Rents YoY
- 5.4%
- Active inventory
- 127
- Price-to-rent
- 6.4×
Monthly cashflow live
- Estimated rent
- $1,240 high interval (Pro) →
- Mortgage (P&I)
- −$498
- Tax from tax record
- −$100 /mo · $1,200/yr
- Insurance
- −$40
- HOA
- −$0
- Vacancy / Maint / Mgmt
- −$260
- Net cashflow
- $342
Break-even live
UW: 25.0% down · 7.5% · 30yr · 1.5% tax · 5.0% vac · 8.0% maint · 8.0% mgmt
Financing live
Cash to close
- Down payment
- $23,750
- Closing costs
- $2,850
- Reserves months
- —
- Total cash needed
- —
Loan-product check · same deal, 3 products live
Conventional
25% down · 7.5% · 30yr
- Down + closing
- —
- Monthly P&I
- —
- Monthly cashflow
- —
- DSCR
- —
- Eligible?
- —
Personal DTI + credit; lowest rate.
DSCR
20% down · 8.5% · 30yr
- Down + closing
- —
- Monthly P&I
- —
- Monthly cashflow
- —
- DSCR
- —
- Eligible?
- —
No personal income docs; deal must DSCR.
Hard money
10% down · 12.0% · 12mo
- Down + closing
- —
- Monthly P&I
- —
- Monthly cashflow
- —
- DSCR
- —
- Eligible?
- —
Short-term bridge; refi at stabilization.
Rent comps 29 comps
| Address | Beds | Baths | Sqft | Rent | $/sqft | DOM | Units | Dist |
|---|---|---|---|---|---|---|---|---|
| 1425 S Northern Blvd Independence, MO | 3.0 | 1.5 | 1275 | $1,200 | $0.94 | 7d | 1 | 0.11mi |
| 1712 S Ash Ave Unit 1714-3 Independence, MO | 2.0 | 1.0 | 700 | $895 | $1.28 | 23d | 1 | 0.31mi |
| 1712 S Ash Ave Independence, MO | 2.0 | 1.0 | 800 | $945 | $1.18 | 43d | 1 | 0.31mi |
| 10714 E 19th St S Independence, MO | 2.0 | 1.0 | 1010 | $895 | $0.89 | 3d | 1 | 0.35mi |
| 1109 S Appleton Ave Independence, MO | 3.0 | 2.0 | 1200 | $1,195 | $1.00 | 16d | 1 | 0.38mi |
| 10522 E 10th St S Independence, MO | 2.0 | 1.0 | 1020 | $1,099 | $1.08 | 23d | 1 | 0.43mi |
| 10561 E Lake Dr Independence, MO | 2.0 | 1.0 | 800 | $1,000 | $1.25 | 43d | 1 | 0.44mi |
| 10817 E 19th Ter S Independence, MO | 3.0 | 1.0 | 1428 | $1,801 | $1.26 | 16d | 1 | 0.47mi |
| 10323 E 20th St S Independence, MO | 3.0 | 1.0 | 936 | $1,400 | $1.50 | 43d | 1 | 0.54mi |
| 1810 S Vermont Ave Independence, MO | 2.0 | 1.0 | 950 | $948 | $1.00 | 43d | 1 | 0.60mi |
| 10104 E Golf Ave Independence, MO | 3.0 | 2.0 | 1205 | $1,395 | $1.16 | 14d | 1 | 0.67mi |
| 2256 S Sterling Ave Independence, MO | 3.0 | 1.5 | 1284 | $1,399 | $1.09 | 16d | 1 | 0.74mi |
| 11616 E 16th St S Independence, MO | 2.0 | 1.0 | 1016 | $1,125 | $1.11 | 43d | 1 | 0.76mi |
| 9528 E Winner Rd Independence, MO | 1.0–3.0 | 1.0 | 730 | $1,099 | $1.51 | 43d | 1 | 0.83mi |
| 11709 E Winner Rd Independence, MO | 3.0 | 1.5 | 1300 | $1,195 | $0.92 | 16d | 1 | 0.84mi |
| 2222 S Overton Ave Independence, MO | 2.0 | 1.0 | 800 | $1,025 | $1.28 | 21d | 1 | 0.88mi |
| 1138 S Glenwood Ave Independence, MO | 2.0 | 1.0 | 1180 | $1,095 | $0.93 | 19d | 1 | 0.88mi |
| 1704 S Brookside Ave Independence, MO | 4.0 | 1.0 | 834 | $1,450 | $1.74 | 14d | 1 | 0.91mi |
| 11601 E US Highway 24 Apt DA Independence, MO | 2.0 | 1.0 | 900 | $1,400 | $1.56 | 43d | 1 | 1.05mi |
| 10604 E 26th St S Independence, MO | 3.0 | 1.0 | 1068 | $1,610 | $1.51 | 7d | 1 | 1.08mi |
| 523 S Crysler Ave Unit A Independence, MO | 2.0 | 1.0 | 900 | $650 | $0.72 | 23d | 1 | 1.12mi |
| 600 S Glenwood Ave Unit F Independence, MO | 2.0 | 1.0 | 750 | $995 | $1.33 | 19d | 1 | 1.14mi |
| 2503 S Crescent Ave Independence, MO | 2.0 | 2.0 | 864 | $1,295 | $1.50 | 16d | 1 | 1.15mi |
| 554 S Arlington Ave Independence, MO | 4.0 | 1.0 | 1161 | $1,395 | $1.20 | 14d | 1 | 1.15mi |
| 576 S Oxford Ave Independence, MO | 3.0 | 2.0 | 1098 | $1,400 | $1.28 | 43d | 1 | 1.23mi |
| 9613 E 25th Ter S Independence, MO | 3.0 | 1.0 | 1214 | $1,545 | $1.27 | 23d | 1 | 1.24mi |
| 182 Novak St Sugar Creek, MO | 3.0 | 2.0 | 1350 | $1,800 | $1.33 | 17d | 1 | 1.30mi |
| 724 S Grand Ave Independence, MO | 2.0 | 2.0 | 1000 | $1,149 | $1.15 | 43d | 1 | 1.32mi |
| 11500 E Anderson St Independence, MO | 3.0 | 2.0 | 1200 | $1,599 | $1.33 | 17d | 1 | 1.33mi |
Listing history 7 events
-
2026-06-09status $95,000 Pending 7 DOM
-
2026-06-08days on market $95,000 Active 7 DOM
-
2026-06-07days on market $95,000 Active 6 DOM
-
2026-06-05days on market $95,000 Active 3 DOM
-
2026-06-03days on market $95,000 Active 2 DOM
-
2026-06-02remarks 209-char remark
-
2026-06-02$95,000 Active 1 DOM
ⓘ Source: listings_history table (triggers on properties + properties_extension) + one-shot
backfill from property_details.listing_events for pre-trigger history.
Tax reassessment forecast MO · Resets to sale price
- Current annual tax
- $1,200 · $100/mo
- Projected year-2 tax
- $1,200 · $100/mo
- Expected delta
- $0/yr ($0/mo · 0.0%)
ⓘ Screening estimate from a state-policy table — verify with the county assessor before closing.
Climate risk First Street
- Flood 1/10 Low FEMA zone X (unshaded) · 0% chance over 30 yrs
- Wildfire 1/10 Low
- Heat 4/10 Moderate 7 d/yr ≥106°F today · 17 d/yr by 30 yrs out
- Wind 2/10 Low
- Air quality 3/10 Moderate 2 unhealthy d/yr today · 3 by 30 yrs out
Nearby sold comps map
Loading sold comps map…
Walkable amenities ~0.75 mi
Loading nearby amenities…
Taxation est. · year 1
- Rental income
- $14,878
- − Mortgage interest
- −$5,321
- − Property taxes
- −$1,200
- − Insurance
- −$475
- − Repairs & maintenance
- −$1,190
- − Management
- −$1,190
- − Depreciation
- −$2,764
- Taxable income
- $2,737
- Est. tax owed @ 24.0%
- −$657
- After-tax cash flow
- $3,443/yr
For passive investors: Depreciation is non-cash, so a rental often shows a tax loss while cash-flowing — sheltering income. Rental losses are passive: they offset passive income freely, and up to $25,000/yr can offset ordinary (W-2) income if you actively participate and your MAGI is under $100k (phasing out to $0 by $150k); unused losses carry forward. On sale, claimed depreciation is recaptured at up to 25%, and gains may owe capital-gains tax (a 1031 exchange can defer both). Figures are a year-1 estimate at your 24.0% rate — not tax advice; consult a CPA.
Schools (NCES district)
- District
- Independence 30
- NCES district ID
- 2915480
- Math proficiency
- 26% ▼ -8.00%
- Reading proficiency
- 38% ▼ -5.00%
- Median HH income
- $41,843
- Composite
- 27.04/100
- National rank
- #7054
- State rank
- #252 of 324 in MO
Livability — Independence
- Score
- 82/100
- State rank
- #10
- US rank
- #1296
Category grades
Schools grade is shown separately in the Schools card above.
Census & demographics
- Census place
- Independence, MO
- County
- Jackson County · 687,798 people
- City population
- 117,675
- Metro
- Kansas City, MO-KS
- Population (ZIP)
- 22,138
- Household income
- $59,007
- Rent vs Own
- Severe rent burden
- 965.0
Population outlook (Jackson County) Hauer SSP2
- Today (2025)
- 719,589 people
- By 2030
- 731,456 · +1.6%
- By 2040
- 746,689 · +3.8%
- By 2050
- 749,289 · +4.1%
- By 2075
- 736,227 · +2.3%
- By 2100
- 668,210 · -7.1%
Race, ethnicity, and origin ACS 2023
- Neighborhood character
- Diverse neighborhood (Simpson 0.56)
- Race & ethnicity
- White 62% Hispanic / Latino 23% Two or more races 15% Black 7% Asian 2%
- Hispanic origin (detail)
- Mexican 15%
- Common ancestry
- Italian 12% Slovak 2% Lithuanian 2%
- Foreign-born
- 11% · Canada, China
- Languages at home
- 85% English-only · Spanish 13% Other Asian/Pacific 1%
Political lean MEDSL · Jackson
- 2024 margin
- D (+19.3) · D 58.9% · R 39.5% · Other 1.6%
- 2008→2024 swing
- -6.1pp toward R · 2008: 25.4pp · 2024: 19.3pp
- All cycles
- 2024: D+19.3 2020: D+22.0 2016: D+16.6 2012: D+19.0 2008: D+25.4
Not yet ingested
- Civics
- —
Market trends
- HPI YoY
- ▼ -160.06%
- Current HPI
- 302.1124
- Rent YoY
- ▲ 5.43%
- Metro
- Kansas City, MO-KS
- State GDP YoY
- ▲ 1.84%
- F500 in state
- 20
Industry mix (Fortune 500 HQ in MO)
| Industry | F500 HQs | Revenue |
|---|---|---|
| Healthcare | 1 | $163B |
|
||
| Insurance | 1 | $21B |
|
||
| Industrial Technology | 1 | $17B |
|
||
| Retail | 1 | $16B |
|
||
| Industrial Distribution | 1 | $10B |
|
||
| Utilities | 1 | $9B |
|
||
Price history
+58.3% since first listed18 events — show timeline
- 2026-06-01 Listed $95,000 Heartland MLS as Distributed by MLS Grid
- 2020-12-07 Sold (Public Records) — Public Records
- 2020-11-23 Sold (MLS) — Heartland MLS as Distributed by MLS Grid
- 2020-10-27 Pending — Heartland MLS as Distributed by MLS Grid
- 2020-10-21 Relisted — Heartland MLS as Distributed by MLS Grid
- 2020-10-21 Price Changed $79,900 Heartland MLS as Distributed by MLS Grid
- 2020-10-15 Pending — Heartland MLS as Distributed by MLS Grid
- 2020-10-11 Price Changed $83,000 Heartland MLS as Distributed by MLS Grid
- 2020-09-30 Relisted — Heartland MLS as Distributed by MLS Grid
- 2020-09-21 Pending — Heartland MLS as Distributed by MLS Grid
- 2020-09-20 Listed $88,000 Heartland MLS as Distributed by MLS Grid
- 2012-06-14 Sold (Public Records) — Public Records
- 2012-06-14 Sold (Public Records) — Public Records
- 2012-06-06 Sold (MLS) — Heartland MLS as Distributed by MLS Grid
- 2012-04-16 Listed $57,000 Heartland MLS as Distributed by MLS Grid
- 2011-11-05 Listing Removed — Heartland MLS as Distributed by MLS Grid
- 2010-11-05 Listed $60,000 Heartland MLS as Distributed by MLS Grid
- 1985-06-01 Sold (Public Records) — Public Records
Property tax history
+4.1%/yrLatest (2025): $1,200 · +18.0% YoY. Source: county tax records.
Cash-flow waterfall
monthlySold comps — $/sqft
last 12 mo · ≤1 miLoading sold comps…