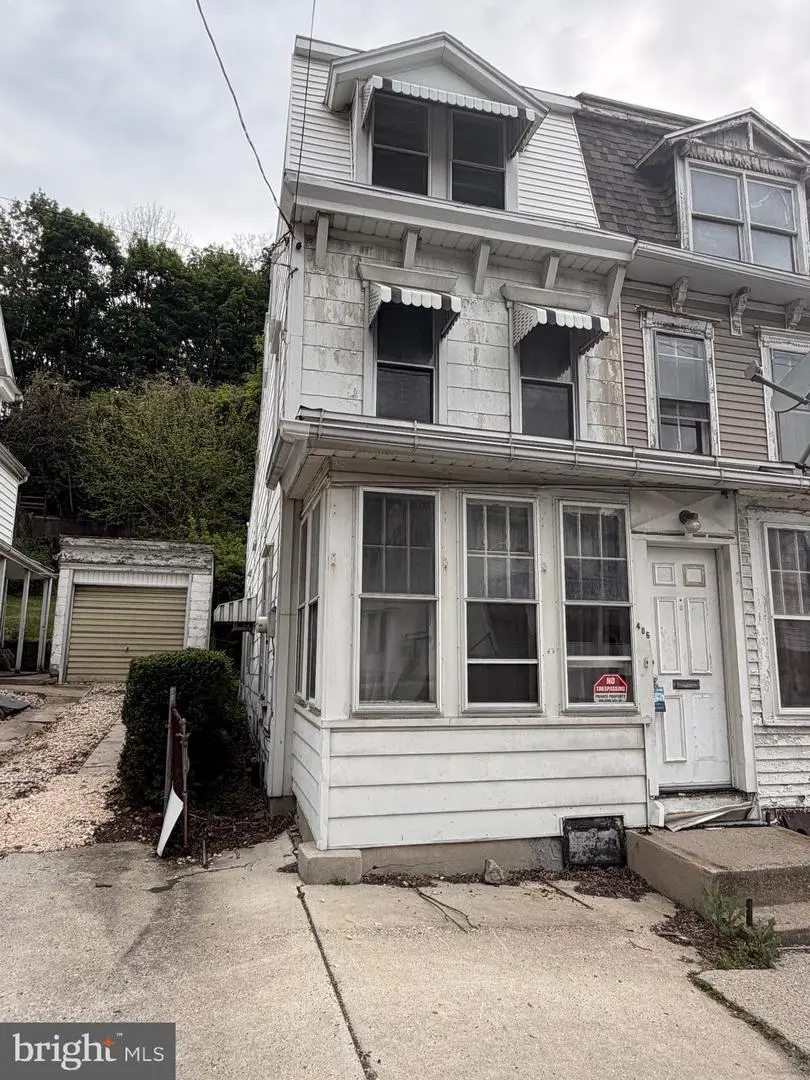
406 Laurel St · Minersville, PA
Flood risk 10/10 · Severe
- FEMA flood zone
- X (unshaded)
- Chance of flooding over 30 yrs
- 0.99%
- Est. flood insurance / yr
- $473 – $860
Fire risk 1/10 · Minimal
- Est. fire insurance / yr
- $511 – $949
Heat risk 4/10 · Minor
- Hot days now (above 95°F)
- 7 days/yr
- Hot days in 30 yrs
- 15 days/yr
Wind risk 4/10 · Minor
- Chance of severe wind over 30 yrs
- 8.0%
Air-quality risk 2/10 · Minimal
- Unhealthy air days now
- 1 days/yr
- Unhealthy air days in 30 yrs
- 3 days/yr
Risk factors via First Street. Map © Google.
Why this score? — see what drove the A- grade
The composite is a weighted blend of 9 inputs, each scored 0–100. Each bar is that input's sub-score; the figure is the points it added to the 100-point composite (weight × sub-score).
- Cash flow +30.0/30.0
- ARV discount +15.0/15.0
- 1% rule +10.0/10.0
- DSCR +10.0/10.0
- Appreciation +7.3/10.0
- Livability +3.5/5.0
- Schools +3.0/10.0
- Rent growth +2.5/5.0
- Condition / age +2.5/5.0
$44,999
🖨 Deal sheet (PDF) 📄 Offer letter ✓ Due diligence
Listing remarks
Investor special. Bring your ideas and add this Minersville 1/2 double to your portfolio. 2 Bedroom and 1 bath. As-is, Cash only sale. Call to set up your private showing!
Key facts
- Built 1909
- Listed 27 days
Property features AI
Exterior
- Parking: On-street parking
- Utilities: Public water; Public sewer
- Home design: Semi-detached property; Fee simple ownership; Estimated year built
- Construction: Aluminum siding; Permanent foundation; Above-grade and below-grade structures
- Exterior features: 15 x 118 lot dimensions; Not in a federal flood zone
Interior
- Bedrooms: Two bedrooms on the first upper level
- Bathrooms: One full bathroom
- Interior features: Estimated living area; Finished above-grade space; Basement (permanent foundation, other type)
Neighborhood map
What this means for you Summary
Snapshot
- This is a 2-bed/1.0-bath townhouse listed at $45k.
Deal economics
- At list price, monthly cash flow is $507 ($6k/yr) — positive.
- The deal already cash-flows at list — no discount required.
- Meets the 1% rule at list price ($1k rent vs $45k).
- Recommended offer: $44k (1.5% below list) — sets the bar for market timing.
- Cap rate 21.3% vs local median 8.0% in Minersville — top-decile yield for the area; either an underpriced asset or a hidden risk that comps aren't pricing in. Stress-test before assuming the spread holds.
Location & tenants
- Location reads 70/100 on livability (#742 in PA) — a middle-class / working-renter tenant base. Strengths: cost of living A+, health & safety A+, crime A; Watch: schools C-, commute F, employment F.
- Minersville Area SD (town): math 21% / reading 50% proficiency, ranked #420 of 539 in PA (top 78%) — families likely to look elsewhere, expect single-tenant / working-renter base with shorter leases.
- Market conditions: 38 active listings in the ZIP; 1 comparable units currently listed for rent nearby; 169 units permitted in Schuylkill County in 2024 (0 in 5+ unit buildings).
Forward outlook
- In year one you build about $2k of equity ($311 loan paydown + $2k appreciation (4.7% local appreciation)).
- Schuylkill County population projected at -16% by 2050 — secular population decline; favor cash flow + early exit over multi-decade hold.
- At projected returns (4.7% appreciation + 3.0% rent growth), your $13k cash investment doubles in ~2 years — after that, you're playing with house money.
Negotiation context
- It's been on market 27 days — a 2% lower offer ($44k) is reasonable based on typical stale-listing flexibility.
Risks & watch-outs
- Watch-outs: flood insurance adds $56/mo; built in 1909 — expect roof / HVAC / electrical / plumbing capex.
- Climate carrying-cost: severe flood risk — expect insurance premiums to compound above CPI over the hold.
Questions for the listing agent
- Built in 1909 — when were the roof, HVAC, electrical panel, plumbing, and water heater last replaced?
- What's the actual annual flood-insurance premium (NFIP or private), and is the property in a SFHA with mandatory coverage?
- Is there a deadline driving the sale (1031 exchange, divorce, estate, relocation)? That informs how much negotiation room exists.
- What's the average days-on-market for RENTAL listings here right now (not sales)? A rising rental-DOM trend means longer vacancies and softer asking-rent achievability than the comps imply.
- What's the recent tenant-quality profile in this submarket — average credit score on applications, eviction rate, late-payment / NSF rate, and stable-employment percentage? A property-management company in the area should have these aggregated.
- How much new for-sale + rental construction is in the pipeline within 1–3 miles? Heavy new supply typically softens prices + rents 12–24 months out; constrained supply supports both.
Investment metrics
- 1% rule
- 2.56% ✓
- Cap rate
- 21.28%
- Cash-on-cash
- 53.54%
- DSCR
- 3.38
- GRM
- 3.3
CMA / ARV
- ARV (on-the-fly)
- $74,214
- Comps found
- 12
Show comp detail 12 sales within ~0.75 mi
| Address | Dist | Beds/Ba | Sqft | Sold | Price | $/sf | Match |
|---|---|---|---|---|---|---|---|
| 115 S 3rd St | 0.17mi | 3/1.0 (+1) | 1,350 (+4%) | 1mo | $32,500 | $24 | 80 |
| 309 Laurel St | 0.07mi | 3/1.0 (+1) | 1,308 (+0%) | 13mo | $139,900 | $107 | 80 |
| 325 New Castle St | 0.44mi | 3/1.0 (+1) | 1,320 (+1%) | 2mo | $68,000 | $52 | 71 |
| 428 North St | 0.36mi | 3/1.5 (+1) | 1,307 (+0%) | 6mo | $46,500 | $36 | 71 |
| 528 Lytle St | 0.20mi | 3/1.0 (+1) | 1,176 (-10%) | 4mo | $120,000 | $102 | 67 |
| 206 Oak St | 0.17mi | 3/1.0 (+1) | 1,200 (-8%) | 10mo | $82,500 | $69 | 66 |
| 513 Pottsville | 0.26mi | 2/1.0 | 1,150 (-12%) | 11mo | $45,000 | $39 | 59 |
| 444 Lewis St | 0.33mi | 3/1.0 (+1) | 1,158 (-11%) | 4mo | $45,000 | $39 | 57 |
| 141 Carbon St | 0.39mi | 3/1.0 (+1) | 1,163 (-11%) | 5mo | $42,000 | $36 | 55 |
| 200 Oak St | 0.18mi | 3/2.0 (+1) | 1,148 (-12%) | 15mo | $65,000 | $57 | 51 |
| 137 Carbon St | 0.39mi | 3/1.0 (+1) | 1,482 (+14%) | 8mo | $85,000 | $57 | 47 |
| 711 N 2nd St | 0.58mi | 3/1.0 (+1) | 1,470 (+13%) | 5mo | $113,800 | $77 | 42 |
Match score weights: distance 35% · size 25% · config 20% · recency 20%. Top-matched comps best support the ARV.
Projected returns pro-forma
4.65% appreciation · 3.0% rent growth · sell at horizon
- IRR
- 55.6%
- Equity multiple
- 4.32×
- Total profit
- $41,819
- Equity at exit
- $24,553
- IRR
- 53.7%
- Equity multiple
- 8.87×
- Total profit
- $99,110
- Equity at exit
- $41,613
Cash invested: $12,600 (down + closing). Projections, not guarantees.
Landlord ↔ Tenant lean methodology
- Overall (STATE)
- 62 Landlord-Friendly
- State Pennsylvania
- 62 Landlord-Friendly · EVEN
- County
- — inherits STATE
- City
- — inherits STATE
ZIP-level market 17954
- Home prices YoY
- 2.3%
- Active inventory
- 38
- Price-to-rent
- 3.3×
Monthly cashflow live
- Estimated rent
- $1,150 medium interval (Pro) →
- Mortgage (P&I)
- −$236
- Tax from tax record
- −$92 /mo · $1,100/yr
- Insurance
- −$19
- Flood insurance flood zone
- −$56 /mo · $666/yr
- HOA
- −$0
- Vacancy / Maint / Mgmt
- −$242
- Net cashflow
- $507
Break-even live
Sensitivity live
| Price | -10% $532 | -5% $519 | +0% $507 | +5% $494 | +10% $481 |
|---|---|---|---|---|---|
| Rent | -10% $416 | -5% $461 | +0% $507 | +5% $552 | +10% $597 |
| Rate | -1.0pp $529 | -0.5pp $518 | base $507 | +0.5pp $495 | +1.0pp $483 |
UW: 25.0% down · 7.5% · 30yr · 1.5% tax · 5.0% vac · 8.0% maint · 8.0% mgmt
Financing live
Cash to close
- Down payment
- $11,250
- Closing costs
- $1,350
- Reserves months
- —
- Total cash needed
- —
Loan-product check · same deal, 3 products live
Conventional
25% down · 7.5% · 30yr
- Down + closing
- —
- Monthly P&I
- —
- Monthly cashflow
- —
- DSCR
- —
- Eligible?
- —
Personal DTI + credit; lowest rate.
DSCR
20% down · 8.5% · 30yr
- Down + closing
- —
- Monthly P&I
- —
- Monthly cashflow
- —
- DSCR
- —
- Eligible?
- —
No personal income docs; deal must DSCR.
Hard money
10% down · 12.0% · 12mo
- Down + closing
- —
- Monthly P&I
- —
- Monthly cashflow
- —
- DSCR
- —
- Eligible?
- —
Short-term bridge; refi at stabilization.
Rent comps 1 comps
| Address | Beds | Baths | Sqft | Rent | $/sqft | DOM | Units | Dist |
|---|---|---|---|---|---|---|---|---|
| 504 Laurel St Minersville, PA | 3.0 | 2.0 | 1059 | $1,150 | $1.09 | 44d | 1 | 0.10mi |
Listing history 14 events
-
2026-06-16status $44,999 Pending 27 DOM
-
2026-06-15days on market $44,999 Active 27 DOM
-
2026-06-14days on market $44,999 Active 25 DOM
-
2026-06-12days on market $44,999 Active 24 DOM
-
2026-06-09days on market $44,999 Active 21 DOM
-
2026-06-08days on market $44,999 Active 20 DOM
-
2026-06-07days on market $44,999 Active 19 DOM
-
2026-06-07days on market $44,999 Active 18 DOM
-
2026-06-04days on market $44,999 Active 15 DOM
-
2026-06-02days on market $44,999 Active 14 DOM
-
2026-06-01days on market $44,999 Active 13 DOM
-
2026-05-31days on market $44,999 Active 12 DOM
-
2026-05-31days on market $44,999 Active 11 DOM
-
2026-05-19$44,999 Active
ⓘ Source: listings_history table (triggers on properties + properties_extension) + one-shot
backfill from property_details.listing_events for pre-trigger history.
Tax reassessment forecast PA · Partial reset (capped growth)
- Current annual tax
- $1,100 · $92/mo
- Projected year-2 tax
- $1,100 · $92/mo
- Expected delta
- $0/yr ($0/mo · 0.0%)
ⓘ Screening estimate from a state-policy table — verify with the county assessor before closing.
Climate risk First Street
- Flood 10/10 Extreme FEMA zone X (unshaded) · 99% chance over 30 yrs
- Wildfire 1/10 Low
- Heat 4/10 Moderate 7 d/yr ≥95°F today · 15 d/yr by 30 yrs out
- Wind 4/10 Moderate 8% chance of damaging wind over 30 yrs
- Air quality 2/10 Low 1 unhealthy d/yr today · 3 by 30 yrs out
Nearby sold comps map
Loading sold comps map…
Walkable amenities ~0.75 mi
Loading nearby amenities…
Taxation est. · year 1
- Rental income
- $13,800
- − Mortgage interest
- −$2,521
- − Property taxes
- −$1,100
- − Insurance
- −$891
- − Repairs & maintenance
- −$1,104
- − Management
- −$1,104
- − Depreciation
- −$1,309
- Taxable income
- $5,771
- Est. tax owed @ 24.0%
- −$1,385
- After-tax cash flow
- $4,694/yr
For passive investors: Depreciation is non-cash, so a rental often shows a tax loss while cash-flowing — sheltering income. Rental losses are passive: they offset passive income freely, and up to $25,000/yr can offset ordinary (W-2) income if you actively participate and your MAGI is under $100k (phasing out to $0 by $150k); unused losses carry forward. On sale, claimed depreciation is recaptured at up to 25%, and gains may owe capital-gains tax (a 1031 exchange can defer both). Figures are a year-1 estimate at your 24.0% rate — not tax advice; consult a CPA.
Schools (NCES district)
- District
- Minersville Area SD
- NCES district ID
- 4215510
- Math proficiency
- 21% ▼ -12.00%
- Reading proficiency
- 50% ▼ -8.00%
- Median HH income
- $40,865
- Composite
- 29.77/100
- National rank
- #6433
- State rank
- #420 of 539 in PA
Livability — Minersville
- Score
- 70/100
- State rank
- #742
- US rank
- #7439
Category grades
Schools grade is shown separately in the Schools card above.
Census & demographics
- Census place
- Minersville, PA
- City population
- 27,121
- Population (ZIP)
- 4,564
Population outlook (Schuylkill County) Hauer SSP2
- Today (2025)
- 137,447 people
- By 2030
- 133,121 · -3.1%
- By 2040
- 124,172 · -9.7%
- By 2050
- 115,611 · -15.9%
- By 2075
- 100,796 · -26.7%
- By 2100
- 86,667 · -36.9%
Race, ethnicity, and origin ACS 2023
- Neighborhood character
- Predominantly White (81%)
- Race & ethnicity
- White 81% Two or more races 15% Hispanic / Latino 12%
- Hispanic origin (detail)
- Puerto Rican 11%
- Common ancestry
- Polish 5% Romanian 5% Subsaharan African 4%
- Foreign-born
- 3% · Canada, China
- Languages at home
- 97% English-only · Spanish 2%
Political lean MEDSL · Schuylkill
- 2024 margin
- Solid R (+42.1) · D 28.5% · R 70.6%
- 2008→2024 swing
- -33.4pp toward R · 2008: -8.7pp · 2024: -42.1pp
- All cycles
- 2024: R+42.1 2020: R+39.9 2016: R+43.4 2012: R+13.4 2008: R+8.7
Not yet ingested
- Civics
- —
Market trends
- HPI YoY
- ▲ 4.65%
- Current HPI
- 209.7647
- Rent YoY
- —
- Metro
- —
- State GDP YoY
- ▲ 1.68%
- F500 in state
- 34
Industry mix (Fortune 500 HQ in PA)
| Industry | F500 HQs | Revenue |
|---|---|---|
| Healthcare | 2 | $309B |
|
||
| Insurance | 2 | $27B |
|
||
| Telecommunications / Media | 1 | $124B |
|
||
| Industrial Distribution | 1 | $22B |
|
||
| Financial Services | 1 | $20B |
|
||
| Chemicals / Materials | 1 | $18B |
|
||
Price history
1 event — show timeline
- 2026-05-19 Listed $44,999 BRIGHT MLS
Property tax history
+2.7%/yrLatest (2025): $1,100 · +5.6% YoY. Source: county tax records.
Cash-flow waterfall
monthlySold comps — $/sqft
last 12 mo · ≤1 miLoading sold comps…