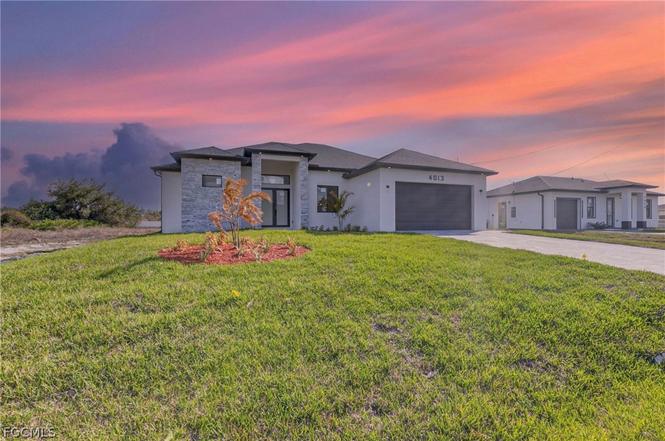
4013 12th St SW · Lehigh Acres, FL
Flood risk 3/10 · Minor
- FEMA flood zone
- X (unshaded)
- Chance of flooding over 30 yrs
- 0.2%
- Est. flood insurance / yr
- $507 – $1,088
Fire risk 2/10 · Minimal
- Est. fire insurance / yr
- $947 – $1,759
Heat risk 10/10 · Severe
- Hot days now (above 107°F)
- 7 days/yr
- Hot days in 30 yrs
- 32 days/yr
Wind risk 10/10 · Severe
- Chance of severe wind over 30 yrs
- 99.0%
Air-quality risk 2/10 · Minimal
- Unhealthy air days now
- 1 days/yr
- Unhealthy air days in 30 yrs
- 1 days/yr
Risk factors via First Street. Map © Google.
Why this score? — see what drove the F grade
The composite is a weighted blend of 9 inputs, each scored 0–100. Each bar is that input's sub-score; the figure is the points it added to the 100-point composite (weight × sub-score).
- Appreciation +10.0/10.0
- ARV discount +7.5/15.0
- Cash flow +4.4/30.0
- Schools +4.1/10.0
- Livability +3.0/5.0
- Condition / age +2.5/5.0
- Rent growth +2.1/5.0
- 1% rule +0.4/10.0
- DSCR +0.0/10.0
$369,900
🖨 Deal sheet 📄 Offer letter ✓ Due diligence
Listing remarks MLS
Centrally located with many amenities nearby, in the beautiful developing city of Lehigh Acres
Key facts
- Open concept kitchen
- New construction
- Covered lanai
Tags
Property features AI
Finance
- Financial info: Pets allowed
- HOA & community: Non-gated community; No association fee listed
Exterior
- Parking: Attached 2-car garage; Covered parking (2 spaces)
- Security: Smoke detector(s); Security/high impact doors
- Utilities: Well water; Septic tank; Cable available
- Home design: New construction; Faces west; RS-1 zoning
- Construction: New construction; Block, concrete and stucco construction; Shingle roof
- Exterior features: Security/high impact doors; Sprinkler/irrigation system (automatic); Rectangular lot; East exposure; Outdoor grill; Outdoor kitchen
Interior
- Kitchen: Cooktop; Dishwasher; Freezer; Disposal; Microwave; Range; Refrigerator; Pantry; Eat-in kitchen; Breakfast bar; Outdoor kitchen; Outdoor grill
- Bedrooms: Den (flex room)
- Flooring: Tile
- Bathrooms: 2 full bathrooms
- Heating & cooling: Central heating (electric); Central air conditioning (electric); Ceiling fan(s)
- Interior features: Impact glass windows; Breakfast bar; Built-in features; Dual sinks; Eat-in kitchen; Family/dining room; Living/dining room; Multiple shower heads; Pantry; Walk-in closet(s); Split bedrooms; Unfurnished
- Laundry & utility: Washer hookup inside; Dryer hookup inside
Neighborhood map
What this means for you Summary
Snapshot
- This is a 3-bed/2.0-bath land listed at $370k.
Deal economics
- At list price, monthly cash flow is $-968 ($-12k/yr) — negative.
- To cash-flow at today's rent, offer at most $230k (37.8% below list).
- To meet the 1% rule (rent ≥ 1% of price), the offer needs to be $201k (45.6% below list).
- Recommended offer: $201k (45.6% below list) — sets the bar for 1% rule.
- Cap rate 3.2% vs local median 4.7% in Lehigh Acres — below-typical yield; the buyer is paying a premium for something (appreciation thesis, condition, location) that the cap rate doesn't capture.
Location & tenants
- Location reads 59/100 on livability (#826 in FL) — a working-class tenant base; expect higher turnover. Strengths: cost of living A+, housing A+; Watch: crime C-, employment D+, schools D-.
- Lee (suburban): math 47% / reading 50% proficiency, ranked #42 of 73 in FL (top 58%) — families likely to look elsewhere, expect single-tenant / working-renter base with shorter leases.
- Market conditions: Rents soft (-1.5%/yr); 786 active listings in the ZIP; 40 comparable units currently listed for rent nearby; rentals at typical pace (median 24d on market — plan ~3-4 weeks tenant-placement turnaround); 15,411 units permitted in Lee County in 2024 (4,686 in 5+ unit buildings).
- This rent runs 33% of the median local income ($73k/yr) — at the standard rent-burdened threshold; future hikes will face affordability resistance.
Forward outlook
- In year one you build about $40k of equity ($3k loan paydown + $37k appreciation (10.0% local appreciation)).
- Lee County population projected at +44% by 2050 — long-run rental-demand tailwind backs the buy-and-hold thesis.
- By year 2, paydown + projected appreciation supports a ~$64k cash-out refi (75% LTV) — recoverable capital for the next deal without selling this one.
Negotiation context
- It's been on market 67 days — a 6% lower offer ($348k) is reasonable based on typical stale-listing flexibility.
- 3 sale attempts since 5y ago with the ask held roughly flat each time — persistent listings suggest the price (not the market) is what's stuck; bring a comps-based counter.
- Current owner paid $23k; list at $370k implies a 1508% gain — meaningful room to come down on a strong offer.
Risks & watch-outs
- Climate carrying-cost: severe wind risk, 99% chance of damaging wind over 30y; extreme-heat days projected 7→32/yr by 2055 (HVAC capex compounding) — expect insurance premiums to compound above CPI over the hold.
Questions for the listing agent
- What do current leases actually rent for vs. the listed asking? Can we see a recent rent roll and the last 12 months of T-12 income?
- It's been on market 67 days. Have you received any prior offers? Is the seller open to a 46% concession, seller financing, or rate buy-down credit?
- Why hasn't it sold? Are there any deal-killer items the seller is aware of (foundation, flood, title, zoning, code violations)?
- Is there a deadline driving the sale (1031 exchange, divorce, estate, relocation)? That informs how much negotiation room exists.
- Schools are D-rated, which usually means shorter tenancies and higher turnover. Who's the typical renter profile here, and what's been the actual vacancy rate?
- The area grade is low — what's the realistic commute time and amenity access for the typical tenant pool here? Any planned neighborhood developments (good or bad) we should know about?
- What's the average days-on-market for RENTAL listings here right now (not sales)? A rising rental-DOM trend means longer vacancies and softer asking-rent achievability than the comps imply.
- What's the recent tenant-quality profile in this submarket — average credit score on applications, eviction rate, late-payment / NSF rate, and stable-employment percentage? A property-management company in the area should have these aggregated.
- How much new for-sale + rental construction is in the pipeline within 1–3 miles? Heavy new supply typically softens prices + rents 12–24 months out; constrained supply supports both.
Investment metrics
- 1% rule
- 0.54% ✗
- Cap rate
- 3.15%
- Cash-on-cash
- -11.21%
- DSCR
- 0.50
- GRM
- 15.3
CMA / ARV
No comps found within radius.
Projected returns pro-forma
10.0% appreciation · 0.0% rent growth · sell at horizon
- IRR
- 15.8%
- Equity multiple
- 2.29×
- Total profit
- $133,973
- Equity at exit
- $333,235
- IRR
- 14.9%
- Equity multiple
- 5.18×
- Total profit
- $432,494
- Equity at exit
- $718,634
Cash invested: $103,572 (down + closing). Projections, not guarantees.
Landlord ↔ Tenant lean methodology
- Overall (STATE)
- 87 Strongly Landlord-Friendly
- State Florida
- 87 Strongly Landlord-Friendly · R+3
- County
- — inherits STATE
- City
- — inherits STATE
ZIP-level market 33976
- Home prices YoY
- 6.8%
- Rents YoY
- -1.5%
- Active inventory
- 786
- Price-to-rent
- 15.3×
Monthly cashflow live
- Estimated rent
- $2,011 high interval (Pro) →
- Mortgage (P&I)
- −$1,940
- Tax est. 1.5%
- −$462 /mo · $5,548/yr
- Insurance
- −$154
- HOA
- −$0
- Vacancy / Maint / Mgmt
- −$422
- Net cashflow
- $-968
Break-even live
UW: 25.0% down · 7.5% · 30yr · 1.5% tax · 5.0% vac · 8.0% maint · 8.0% mgmt
Financing live
Cash to close
- Down payment
- $92,475
- Closing costs
- $11,097
- Reserves months
- —
- Total cash needed
- —
Loan-product check · same deal, 3 products live
Conventional
25% down · 7.5% · 30yr
- Down + closing
- —
- Monthly P&I
- —
- Monthly cashflow
- —
- DSCR
- —
- Eligible?
- —
Personal DTI + credit; lowest rate.
DSCR
20% down · 8.5% · 30yr
- Down + closing
- —
- Monthly P&I
- —
- Monthly cashflow
- —
- DSCR
- —
- Eligible?
- —
No personal income docs; deal must DSCR.
Hard money
10% down · 12.0% · 12mo
- Down + closing
- —
- Monthly P&I
- —
- Monthly cashflow
- —
- DSCR
- —
- Eligible?
- —
Short-term bridge; refi at stabilization.
Rent comps 40 comps
| Address | Beds | Baths | Sqft | Rent | $/sqft | DOM | Units | Dist |
|---|---|---|---|---|---|---|---|---|
| 4005 12th St SW Lehigh Acres, FL | 3.0 | 2.0 | 1122 | $1,610 | $1.43 | 19d | 1 | 0.05mi |
| 3820 7th St SW Lehigh Acres, FL | 4.0 | 2.0 | 1841 | $2,500 | $1.36 | 11d | 1 | 0.37mi |
| 3818 7th St SW Lehigh Acres, FL | 3.0 | 2.0 | 1422 | $1,695 | $1.19 | 23d | 1 | 0.38mi |
| 4218 8th St SW Lehigh Acres, FL | 3.0 | 2.0 | 1408 | $1,800 | $1.28 | 23d | 1 | 0.45mi |
| 3702 14th St SW Lehigh Acres, FL | 4.0 | 2.0 | 1472 | $1,995 | $1.36 | 23d | 1 | 0.55mi |
| 3705 9th St SW Lehigh Acres, FL | 3.0 | 2.0 | 1272 | $1,695 | $1.33 | 14d | 1 | 0.55mi |
| 4221 18th St SW Lehigh Acres, FL | 3.0 | 2.5 | 1600 | $2,600 | $1.62 | 13d | 1 | 0.58mi |
| 3714 17th St SW Lehigh Acres, FL | 4.0 | 2.0 | 1833 | $1,890 | $1.03 | 23d | 1 | 0.58mi |
| 3820 3rd St SW Lehigh Acres, FL | 4.0 | 2.0 | 2133 | $1,745 | $0.82 | 23d | 1 | 0.60mi |
| 610 Floyd Ave S Lehigh Acres, FL | 3.0 | 2.0 | 1400 | $2,100 | $1.50 | 23d | 1 | 0.63mi |
| 3704 6th St SW Lehigh Acres, FL | 3.0 | 2.0 | 1100 | $1,575 | $1.43 | 19d | 1 | 0.65mi |
| 1502 Gretchen Ave S Lehigh Acres, FL | 3.0 | 2.0 | 1270 | $2,000 | $1.57 | 3d | 1 | 0.68mi |
| 4001 22nd St SW Lehigh Acres, FL | 3.0 | 2.0 | 1055 | $1,950 | $1.85 | 2d | 1 | 0.70mi |
| 1117 Gordon Ave S Lehigh Acres, FL | 3.0 | 2.0 | 1170 | $1,750 | $1.50 | 21d | 1 | 0.73mi |
| 3615 6th St SW Lehigh Acres, FL | 3.0 | 2.0 | 1378 | $1,825 | $1.32 | 23d | 1 | 0.73mi |
| 4307 2nd St SW Lehigh Acres, FL | 4.0 | 2.0 | 1843 | $2,191 | $1.19 | 2d | 1 | 0.74mi |
| 1544 Gretchen Ave S Lehigh Acres, FL | 2.0 | 2.0 | 1221 | $1,800 | $1.47 | 23d | 1 | 0.78mi |
| 704 Gilbert Ave S Lehigh Acres, FL | 3.0 | 2.0 | 1203 | $1,475 | $1.23 | 19d | 1 | 0.78mi |
| 4503 15th St SW Lehigh Acres, FL | 3.0 | 2.0 | 1200 | $1,800 | $1.50 | 23d | 1 | 0.79mi |
| 4203 23rd St SW Lehigh Acres, FL | 4.0 | 2.0 | 1833 | $1,850 | $1.01 | 19d | 1 | 0.79mi |
| 1504 Gary Ln Lehigh Acres, FL | 3.0 | 2.0 | 1198 | $1,660 | $1.39 | 23d | 1 | 0.80mi |
| 1506 Gary Ln Lehigh Acres, FL | 3.0 | 2.0 | 1198 | $1,660 | $1.39 | 23d | 1 | 0.80mi |
| 716 Gordon Ave S Lehigh Acres, FL | 3.0 | 2.0 | 1175 | $1,595 | $1.36 | 3d | 1 | 0.80mi |
| 3303 8th St SW Lehigh Acres, FL | 3.0 | 2.0 | 1400 | $2,250 | $1.61 | 3d | 1 | 0.84mi |
| 1113 Harry Ave S Lehigh Acres, FL | 2.0 | 2.0 | 1180 | $1,646 | $1.39 | 3d | 1 | 0.84mi |
| 745 Harry Ave S Lehigh Acres, FL | 3.0 | 2.0 | 1200 | $1,699 | $1.42 | 10d | 1 | 0.85mi |
| 57 Xelda Ave S Lehigh Acres, FL | 3.0 | 3.0 | 1057 | $2,200 | $2.08 | 23d | 1 | 0.85mi |
| 1511 Terry Ave S Lehigh Acres, FL | 3.0 | 2.0 | 1579 | $1,996 | $1.26 | 23d | 1 | 0.85mi |
| 729 Harry Ave S Lehigh Acres, FL | 3.0 | 2.0 | 1125 | $1,500 | $1.33 | 23d | 1 | 0.87mi |
| 3600 19th St SW Lehigh Acres, FL | 3.0 | 2.0 | 1114 | $1,746 | $1.57 | 3d | 1 | 0.87mi |
| 1578 Gretchen Ave S Lehigh Acres, FL | 3.0 | 2.0 | 1728 | $2,000 | $1.16 | 23d | 1 | 0.87mi |
| 4003 3rd St W Lehigh Acres, FL | 3.0 | 2.0 | 1311 | $1,985 | $1.51 | 23d | 1 | 0.89mi |
| 3919 3rd St W Lehigh Acres, FL | 4.0 | 2.0 | 1728 | $2,131 | $1.23 | 3d | 1 | 0.90mi |
| 1509 Haviland Ave S Lehigh Acres, FL | 3.0 | 2.0 | 1200 | $1,550 | $1.29 | 23d | 1 | 0.91mi |
| 1511 Haviland Ave S Lehigh Acres, FL | 3.0 | 2.0 | 1200 | $1,550 | $1.29 | 23d | 1 | 0.91mi |
| 4507 20th St SW Lehigh Acres, FL | 2.0 | 2.0 | 1135 | $1,400 | $1.23 | 23d | 1 | 0.93mi |
| 3408 10th St SW Lehigh Acres, FL | 4.0 | 2.0 | 1920 | $1,750 | $0.91 | 13d | 1 | 0.93mi |
| 3408 10th St SW Lehigh Acres, FL | 4.0 | 2.0 | 1385 | $1,850 | $1.34 | 21d | 1 | 0.93mi |
| 310 Gordon Ave S Lehigh Acres, FL | 2.0 | 2.0 | 1166 | $1,599 | $1.37 | 23d | 1 | 0.93mi |
| 310 Gordon Ave S Lehigh Acres, FL | 2.0 | 2.0 | 1166 | $1,599 | $1.37 | 3d | 1 | 0.93mi |
Listing history 12 events
-
2026-05-01status Pending
-
2026-04-13price $369,900
-
2026-03-31price $374,000
-
2026-02-23$379,000 Active
-
2023-09-25soldstatus $23,000 Closed 94-char remark
Show marketing remark (94 chars)
Centrally located with many amenities nearby, in the beautiful developing city of Lehigh Acres
-
2023-09-22soldstatus $23,000
-
2022-10-19$30,000 Active 94-char remark
Show marketing remark (94 chars)
Centrally located with many amenities nearby, in the beautiful developing city of Lehigh Acres
-
2021-08-27soldstatus $17,000
-
2021-08-25soldstatus $17,000 Closed 123-char remark
Show marketing remark (123 chars)
Great residential lot in Lehigh Acres! Build your next home . This lot is close to shops and a new high school being built.
-
2021-08-02status Pending 123-char remark
Show marketing remark (123 chars)
Great residential lot in Lehigh Acres! Build your next home . This lot is close to shops and a new high school being built.
-
2021-06-14$16,750 Active 123-char remark
Show marketing remark (123 chars)
Great residential lot in Lehigh Acres! Build your next home . This lot is close to shops and a new high school being built.
-
2004-12-16soldstatus $23,000
ⓘ Source: listings_history table (triggers on properties + properties_extension) + one-shot
backfill from property_details.listing_events for pre-trigger history.
Climate risk First Street
- Flood 3/10 Moderate FEMA zone X (unshaded) · 20% chance over 30 yrs
- Wildfire 2/10 Low
- Heat 10/10 Extreme 7 d/yr ≥107°F today · 32 d/yr by 30 yrs out
- Wind 10/10 Extreme 99% chance of damaging wind over 30 yrs
- Air quality 2/10 Low 1 unhealthy d/yr today · 1 by 30 yrs out
Nearby sold comps map
Loading sold comps map…
Walkable amenities ~0.75 mi
Loading nearby amenities…
Taxation est. · year 1
- Rental income
- $24,134
- − Mortgage interest
- −$20,720
- − Property taxes
- −$5,548
- − Insurance
- −$1,850
- − Repairs & maintenance
- −$1,931
- − Management
- −$1,931
- − Depreciation
- −$10,761
- Taxable loss
- −$18,607
- Est. tax savings @ 24.0%
- +$4,466
- After-tax cash flow
- $-7,144/yr
For passive investors: Depreciation is non-cash, so a rental often shows a tax loss while cash-flowing — sheltering income. Rental losses are passive: they offset passive income freely, and up to $25,000/yr can offset ordinary (W-2) income if you actively participate and your MAGI is under $100k (phasing out to $0 by $150k); unused losses carry forward. On sale, claimed depreciation is recaptured at up to 25%, and gains may owe capital-gains tax (a 1031 exchange can defer both). Figures are a year-1 estimate at your 24.0% rate — not tax advice; consult a CPA.
Schools (NCES district)
- District
- Lee
- NCES district ID
- 1201080
- Math proficiency
- 47% ▼ -11.00%
- Reading proficiency
- 50% ▼ -4.00%
- Median HH income
- $49,518
- Composite
- 41.49/100
- National rank
- #3458
- State rank
- #42 of 73 in FL
Livability — Lehigh Acres
- Score
- 59/100
- State rank
- #826
- US rank
- #20055
Category grades
Schools grade is shown separately in the Schools card above.
Census & demographics
- Census place
- Lehigh Acres, FL
- County
- Lee County · 788,662 people
- City population
- 130,638
- Metro
- Cape Coral-Fort Myers, FL
- Population (ZIP)
- 20,277
- Household income
- $72,679
- Rent vs Own
- Severe rent burden
- 574.0
Population outlook (Lee County) Hauer SSP2
- Today (2025)
- 871,946 people
- By 2030
- 955,468 · +9.6%
- By 2040
- 1,113,587 · +27.7%
- By 2050
- 1,256,891 · +44.1%
- By 2075
- 1,560,270 · +78.9%
- By 2100
- 1,726,848 · +98.0%
Race, ethnicity, and origin ACS 2023
- Neighborhood character
- Diverse neighborhood (Simpson 0.65)
- Race & ethnicity
- Hispanic / Latino 50% Two or more races 30% White 24% Black 20% Asian 3%
- Hispanic origin (detail)
- Mexican 8% Puerto Rican 8% Cuban 18% Dominican 4%
- Common ancestry
- Hispanic 8% Slovak 1% Lithuanian 1%
- Foreign-born
- 35% · Canada, Jamaica, Vietnam
- Languages at home
- 46% English-only · Spanish 43% French/Haitian/Cajun 8% Vietnamese 1%
Political lean MEDSL · Lee
- 2024 margin
- Strong R (+28.4) · D 35.5% · R 63.9%
- 2008→2024 swing
- -18.0pp toward R · 2008: -10.4pp · 2024: -28.4pp
- All cycles
- 2024: R+28.4 2020: R+19.2 2016: R+20.4 2012: R+16.6 2008: R+10.4
Not yet ingested
- Civics
- —
Market trends
- HPI YoY
- ▲ 21.77%
- Current HPI
- 340.4255
- Rent YoY
- ▼ -1.54%
- Metro
- Cape Coral-Fort Myers, FL
- State GDP YoY
- ▲ 3.28%
- F500 in state
- 36
Industry mix (Fortune 500 HQ in FL)
| Industry | F500 HQs | Revenue |
|---|---|---|
| Industrial Technology | 2 | $29B |
|
||
| Insurance | 2 | $17B |
|
||
| Retail | 1 | $60B |
|
||
| Technology Distribution | 1 | $58B |
|
||
| Homebuilding | 1 | $35B |
|
||
| Technology Manufacturing | 1 | $35B |
|
||
Price history
+1508.3% since first listed12 events — show timeline
- 2026-05-01 Pending — FORTMLS
- 2026-04-13 Price Changed $369,900 FORTMLS
- 2026-03-31 Price Changed $374,000 FORTMLS
- 2026-02-23 Listed $379,000 FORTMLS
- 2023-09-25 Sold (MLS) $23,000 FORTMLS
- 2023-09-22 Sold (Public Records) $23,000 Public Records
- 2022-10-19 Listed $30,000 FORTMLS
- 2021-08-27 Sold (Public Records) $17,000 Public Records
- 2021-08-25 Sold (MLS) $17,000 FORTMLS
- 2021-08-02 Pending — FORTMLS
- 2021-06-14 Listed $16,750 FORTMLS
- 2004-12-16 Sold (Public Records) $23,000 Public Records
Property tax history
+19.3%/yrLatest (2025): $504 · +10.2% YoY. Source: county tax records.
Cash-flow waterfall
monthlySold comps — $/sqft
last 12 mo · ≤1 miLoading sold comps…