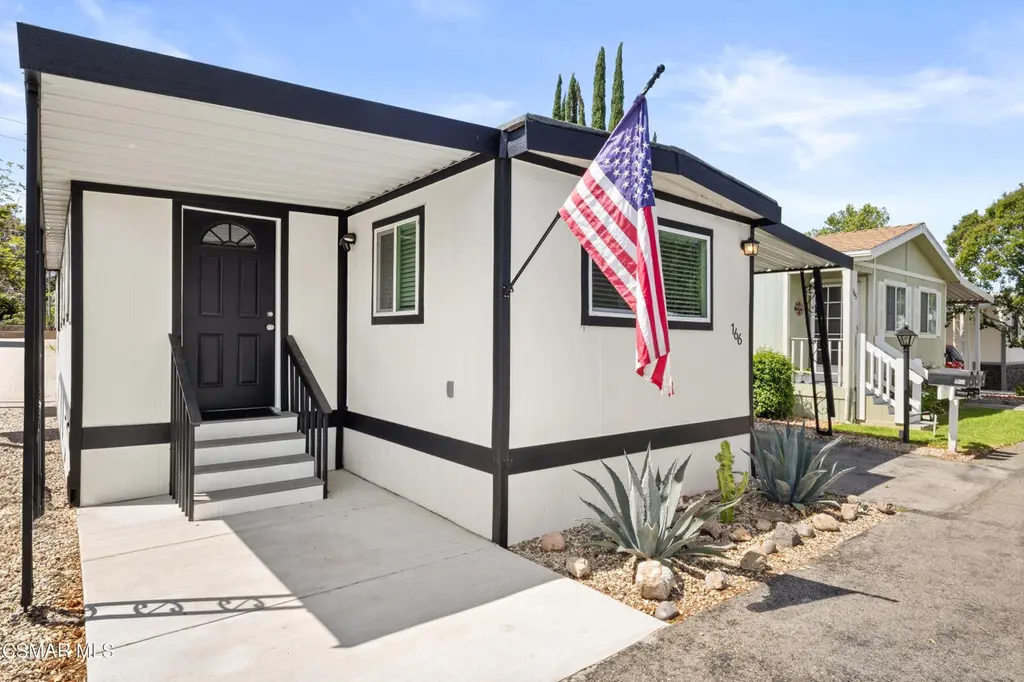
1550 Rory Ln #166 · Simi Valley, CA
Flood risk 5/10 · Moderate
- FEMA flood zone
- X
- Chance of flooding over 30 yrs
- 0.47%
- Est. flood insurance / yr
- $507 – $1,088
Fire risk 7/10 · Major
- Est. fire insurance / yr
- $659 – $1,223
Heat risk 5/10 · Moderate
- Hot days now (above 101°F)
- 8 days/yr
- Hot days in 30 yrs
- 22 days/yr
Wind risk 1/10 · Minimal
- Chance of severe wind over 30 yrs
- —
Air-quality risk 3/10 · Minor
- Unhealthy air days now
- 4 days/yr
- Unhealthy air days in 30 yrs
- 4 days/yr
Risk factors via First Street. Map © Google.
Why this score? — see what drove the B grade
The composite is a weighted blend of 9 inputs, each scored 0–100. Each bar is that input's sub-score; the figure is the points it added to the 100-point composite (weight × sub-score).
- Cash flow +30.0/30.0
- 1% rule +10.0/10.0
- DSCR +10.0/10.0
- ARV discount +9.7/15.0
- Schools +4.0/10.0
- Rent growth +3.8/5.0
- Livability +3.2/5.0
- Condition / age +2.5/5.0
- Appreciation +0.0/10.0
$180,000
🖨 Deal sheet 📄 Offer letter ✓ Due diligence
Listing remarks MLS
Charming Mobile Home with Unique Yard and Exceptional Amenities in a Family-Friendly Community! Welcome to this well-maintained 2-bedroom, 2-bathroom mobile home, featuring a versatile addition (approximately 26.5' x 7.5') that can be used as a third bedroom, utility room, office, or flexible living space. New roof installed in early 2024, A/C and heating throughout. Refrigerator, washer, dryer included. Exterior Features: Enhanced security with exterior lighting and security camera. Community & Lifestyle: Located in a safe, peaceful, and family-oriented mobile home park, this property offers a welcoming environment ideal for all ages. The community features include: Swimming pool, Jacuzzi, Dry sauna, Clubhouse and recreation room, RV parking available through the park. This home offers the perfect blend of comfort, security, and outdoor charm--all within a warm, community-focused setting. A must-see opportunity!
Key facts
- 2,516 sq ft lot
- Community pool
- Built 1973
Neighborhood map
What this means for you Summary
Snapshot
- This is a 3-bed/2.0-bath manufactured listed at $180k.
Deal economics
- At list price, monthly cash flow is $1k ($18k/yr) — positive.
- The deal already cash-flows at list — no discount required.
- Meets the 1% rule at list price ($3k rent vs $180k).
- Recommended offer: $169k (6.0% below list) — sets the bar for market timing.
- Cap rate 16.0% vs local median 3.0% in Simi Valley — top-decile yield for the area; either an underpriced asset or a hidden risk that comps aren't pricing in. Stress-test before assuming the spread holds.
Location & tenants
- Location reads 63/100 on livability (#456 in CA) — a middle-class / working-renter tenant base. Strengths: crime A+, employment A+, housing B; Watch: amenities F, commute D-, cost of living F.
- Simi Valley Unified (suburban): math 36% / reading 49% proficiency, ranked #170 of 517 in CA (top 33%) — families likely to look elsewhere, expect single-tenant / working-renter base with shorter leases.
- Market conditions: Rents rising fast (+5.2%/yr); 150 active listings in the ZIP; 13 comparable units currently listed for rent nearby; rentals at typical pace (median 16d on market — plan ~3-4 weeks tenant-placement turnaround); 46% of comp listings sitting > 30 days — soft ceiling on asking rent; high-income renter base; 1,759 units permitted in Ventura County in 2024 (1,196 in 5+ unit buildings).
- This rent runs 33% of the median local income ($125k/yr) — at the standard rent-burdened threshold; future hikes will face affordability resistance.
Forward outlook
- Local home prices are declining (-3.0%/yr); year-one equity from $1k of loan paydown is wiped out by about $5k of value loss. Plan a longer hold.
- Ventura County population projected at +4% by 2050 — modest demand growth; plan on rents tracking national, not racing it.
- At projected returns (-3.0% appreciation + 5.2% rent growth), your $50k cash investment doubles in ~4 years — after that, you're playing with house money.
Negotiation context
- It's been on market 72 days — a 6% lower offer ($169k) is reasonable based on typical stale-listing flexibility.
Risks & watch-outs
- Climate carrying-cost: moderate flood risk; major wildfire risk; extreme-heat days projected 8→22/yr by 2055 (HVAC capex compounding) — expect insurance premiums to compound above CPI over the hold.
Questions for the listing agent
- It's been on market 72 days. Have you received any prior offers? Is the seller open to a 6% concession, seller financing, or rate buy-down credit?
- Built in 1973 — when were the roof, HVAC, electrical panel, plumbing, and water heater last replaced?
- Why hasn't it sold? Are there any deal-killer items the seller is aware of (foundation, flood, title, zoning, code violations)?
- Is there a deadline driving the sale (1031 exchange, divorce, estate, relocation)? That informs how much negotiation room exists.
- What's the average days-on-market for RENTAL listings here right now (not sales)? A rising rental-DOM trend means longer vacancies and softer asking-rent achievability than the comps imply.
- What's the recent tenant-quality profile in this submarket — average credit score on applications, eviction rate, late-payment / NSF rate, and stable-employment percentage? A property-management company in the area should have these aggregated.
- How much new for-sale + rental construction is in the pipeline within 1–3 miles? Heavy new supply typically softens prices + rents 12–24 months out; constrained supply supports both.
Investment metrics
- 1% rule
- 1.90% ✓
- Cap rate
- 16.03%
- Cash-on-cash
- 34.77%
- DSCR
- 2.55
- GRM
- 4.4
CMA / ARV
- ARV (median comp)
- $189,300
- List price
- $180,000
- Delta
- -4.91%
- Verdict
- FAIR
- Comps
- 6 within 1.0 mi
Show comp detail 5 sales within ~0.75 mi
| Address | Dist | Beds/Ba | Sqft | Sold | Price | $/sf | Match |
|---|---|---|---|---|---|---|---|
| 5932 E Los Angeles Ave #27 | 0.10mi | 3/2.0 | 1,120 (+1%) | 23mo | $190,000 | $170 | 74 |
| 1550 Rory Ln #103 | 0.17mi | 2/2.0 (-1) | 1,040 (-6%) | 5mo | $210,600 | $203 | 73 |
| 1550 Rory #80 | 0.20mi | 3/2.0 | 952 (-14%) | 1mo | $128,000 | $134 | 66 |
| 6480 Katherine #75 | 0.67mi | 2/2.0 (-1) | 1,152 (+4%) | 3mo | $168,000 | $146 | 55 |
| 6079 Cedar St | 0.56mi | 3/2.0 | 1,248 (+13%) | 5mo | $525,000 | $421 | 48 |
Match score weights: distance 35% · size 25% · config 20% · recency 20%. Top-matched comps best support the ARV.
Projected returns pro-forma
-3.0% appreciation · 5.22% rent growth · sell at horizon
- IRR
- 32.8%
- Equity multiple
- 2.42×
- Total profit
- $71,723
- Equity at exit
- $26,839
- IRR
- 41.0%
- Equity multiple
- 5.29×
- Total profit
- $216,011
- Equity at exit
- $15,563
Cash invested: $50,400 (down + closing). Projections, not guarantees.
Landlord ↔ Tenant lean methodology
- Overall (STATE)
- 18 Strongly Tenant-Friendly
- State California
- 18 Strongly Tenant-Friendly · D+13
- County
- — inherits STATE
- City
- — inherits STATE
ZIP-level market 93063
- Rents YoY
- 5.2%
- Active inventory
- 150
- Price-to-rent
- 4.4×
Monthly cashflow live
- Estimated rent
- $3,423 high interval (Pro) →
- Mortgage (P&I)
- −$944
- Tax est. 1.5%
- −$225 /mo · $2,700/yr
- Insurance
- −$75
- HOA
- −$0
- Vacancy / Maint / Mgmt
- −$719
- Net cashflow
- $1,461
Break-even live
UW: 25.0% down · 7.5% · 30yr · 1.5% tax · 5.0% vac · 8.0% maint · 8.0% mgmt
Financing live
Cash to close
- Down payment
- $45,000
- Closing costs
- $5,400
- Reserves months
- —
- Total cash needed
- —
Loan-product check · same deal, 3 products live
Conventional
25% down · 7.5% · 30yr
- Down + closing
- —
- Monthly P&I
- —
- Monthly cashflow
- —
- DSCR
- —
- Eligible?
- —
Personal DTI + credit; lowest rate.
DSCR
20% down · 8.5% · 30yr
- Down + closing
- —
- Monthly P&I
- —
- Monthly cashflow
- —
- DSCR
- —
- Eligible?
- —
No personal income docs; deal must DSCR.
Hard money
10% down · 12.0% · 12mo
- Down + closing
- —
- Monthly P&I
- —
- Monthly cashflow
- —
- DSCR
- —
- Eligible?
- —
Short-term bridge; refi at stabilization.
Rent comps 13 comps
| Address | Beds | Baths | Sqft | Rent | $/sqft | DOM | Units | Dist |
|---|---|---|---|---|---|---|---|---|
| 1930 Yosemite Ave Simi Valley, CA | 1.0–3.0 | 1.0–2.0 | 850 | $2,915 | $3.43 | 1d | 1 | 0.13mi |
| 1700 Yosemite Ave Simi Valley, CA | 1.0–3.0 | 1.0–2.0 | 850 | $2,915 | $3.43 | 1d | 3 | 0.14mi |
| 1830 Rory Ln Simi Valley, CA | 2.0 | 2.5 | 1437 | $3,288 | $2.29 | 43d | 1 | 0.26mi |
| 2002 Calle La Sombra #1 Simi Valley, CA | 2.0 | 1.0 | 803 | $2,625 | $3.27 | 43d | 1 | 0.28mi |
| 2010 Calle La Sombra Simi Valley, CA | 2.0 | 1.0 | 834 | $2,400 | $2.88 | 43d | 1 | 0.29mi |
| 2013 Avenida Refugio #3 Simi Valley, CA | 2.0 | 1.0 | 834 | $2,550 | $3.06 | 43d | 1 | 0.31mi |
| 5676 Bloomfield St Simi Valley, CA | 4.0 | 2.0 | 1380 | $8,500 | $6.16 | 43d | 1 | 0.33mi |
| 2044 Avenida Vista Delmonte #2 Simi Valley, CA | 2.0 | 1.0 | 834 | $2,300 | $2.76 | 16d | 1 | 0.34mi |
| 5505 Cochran St Simi Valley, CA | 1.0–3.0 | 1.0–2.0 | 838 | $3,469 | $4.14 | 2d | 19 | 0.94mi |
| 2360 Archwood Ln #39 Simi Valley, CA | 2.0 | 1.0 | 872 | $2,675 | $3.07 | 3d | 1 | 0.98mi |
| 5377 Cochran St Simi Valley, CA | 1.0–3.0 | 1.0–2.0 | 881 | $3,395 | $3.85 | 43d | 1 | 1.04mi |
| 5065 Hidden Park Ct Simi Valley, CA | 1.0–3.0 | 1.0–2.0 | 1004 | $3,276 | $3.26 | 2d | 16 | 1.04mi |
| 5333 Cochran St Simi Valley, CA | 1.0–2.0 | 1.0–2.0 | 730 | $2,750 | $3.77 | 1d | 2 | 1.07mi |
Listing history 16 events
-
2026-06-18days on market $180,000 Active 72 DOM
-
2026-06-17days on market $180,000 Active 71 DOM
-
2026-06-16days on market $180,000 Active 70 DOM
-
2026-06-15days on market $180,000 Active 69 DOM
-
2026-06-13days on market $180,000 Active 67 DOM
-
2026-06-13days on market $180,000 Active 66 DOM
-
2026-06-10days on market $180,000 Active 64 DOM
-
2026-06-09days on market $180,000 Active 63 DOM
-
2026-06-08days on market $180,000 Active 62 DOM
-
2026-06-07days on market $180,000 Active 61 DOM
-
2026-06-05days on market $180,000 Active 58 DOM
-
2026-06-03days on market $180,000 Active 57 DOM
-
2026-06-02days on market $180,000 Active 56 DOM
-
2026-06-01days on market $180,000 Active 55 DOM
-
2026-05-31days on market $180,000 Active 54 DOM
-
2026-03-29$220,000 Active 931-char remark
Show marketing remark (931 chars)
Charming Mobile Home with Unique Yard and Exceptional Amenities in a Family-Friendly Community! Welcome to this well-maintained 2-bedroom, 2-bathroom mobile home, featuring a versatile addition (approximately 26.5' x 7.5') that can be used as a third bedroom, utility room, office, or flexible living space. New roof installed in early 2024, A/C and heating throughout. Refrigerator, washer, dryer included. Exterior Features: Enhanced security with exterior lighting and security camera. Community & Lifestyle: Located in a safe, peaceful, and family-oriented mobile home park, this property offers a welcoming environment ideal for all ages. The community features include: Swimming pool, Jacuzzi, Dry sauna, Clubhouse and recreation room, RV parking available through the park. This home offers the perfect blend of comfort, security, and outdoor charm--all within a warm, community-focused setting. A must-see opportunity!
ⓘ Source: listings_history table (triggers on properties + properties_extension) + one-shot
backfill from property_details.listing_events for pre-trigger history.
Climate risk First Street
- Flood 5/10 Major FEMA zone X · 47% chance over 30 yrs
- Wildfire 7/10 Severe
- Heat 5/10 Major 8 d/yr ≥101°F today · 22 d/yr by 30 yrs out
- Wind 1/10 Low
- Air quality 3/10 Moderate 4 unhealthy d/yr today · 4 by 30 yrs out
Nearby sold comps map
Loading sold comps map…
Walkable amenities ~0.75 mi
Loading nearby amenities…
Taxation est. · year 1
- Rental income
- $41,081
- − Mortgage interest
- −$10,083
- − Property taxes
- −$2,700
- − Insurance
- −$900
- − Repairs & maintenance
- −$3,286
- − Management
- −$3,286
- − Depreciation
- −$5,236
- Taxable income
- $15,589
- Est. tax owed @ 24.0%
- −$3,741
- After-tax cash flow
- $13,785/yr
For passive investors: Depreciation is non-cash, so a rental often shows a tax loss while cash-flowing — sheltering income. Rental losses are passive: they offset passive income freely, and up to $25,000/yr can offset ordinary (W-2) income if you actively participate and your MAGI is under $100k (phasing out to $0 by $150k); unused losses carry forward. On sale, claimed depreciation is recaptured at up to 25%, and gains may owe capital-gains tax (a 1031 exchange can defer both). Figures are a year-1 estimate at your 24.0% rate — not tax advice; consult a CPA.
Schools (NCES district)
- District
- Simi Valley Unified
- NCES district ID
- 0636840
- Math proficiency
- 36% ▼ -7.00%
- Reading proficiency
- 49% ▼ -5.00%
- Median HH income
- $88,818
- Composite
- 40.23/100
- National rank
- #3773
- State rank
- #170 of 517 in CA
Livability — Simi Valley
- Score
- 63/100
- State rank
- #456
- US rank
- #15494
Category grades
Schools grade is shown separately in the Schools card above.
Census & demographics
- Census place
- Simi Valley, CA
- County
- Ventura County · 829,955 people
- City population
- 128,600
- Metro
- Oxnard-Thousand Oaks-Ventura, CA
- Population (ZIP)
- 55,066
- Household income
- $125,098
- Rent vs Own
- Severe rent burden
- 1322.0
Population outlook (Ventura County) Hauer SSP2
- Today (2025)
- 895,754 people
- By 2030
- 912,134 · +1.8%
- By 2040
- 931,454 · +4.0%
- By 2050
- 934,609 · +4.3%
- By 2075
- 924,899 · +3.3%
- By 2100
- 864,712 · -3.5%
Race, ethnicity, and origin ACS 2023
- Neighborhood character
- Diverse neighborhood (Simpson 0.62)
- Race & ethnicity
- White 55% Hispanic / Latino 25% Two or more races 15% Asian 11% Black 2%
- Hispanic origin (detail)
- Mexican 17% Cuban 1%
- Common ancestry
- Italian 5% Lithuanian 2% Slovak 2%
- Foreign-born
- 18% · Canada, China, Vietnam
- Languages at home
- 75% English-only · Spanish 14% Other Indo-European 4% Tagalog/Filipino 2%
Political lean MEDSL · Ventura
- 2024 margin
- D (+15.1) · D 56.1% · R 41.0% · Other 2.9%
- 2008→2024 swing
- +2.8pp toward D · 2008: 12.3pp · 2024: 15.1pp
- All cycles
- 2024: D+15.1 2020: D+21.1 2016: D+16.8 2012: D+5.3 2008: D+12.3
Not yet ingested
- Civics
- —
Market trends
- HPI YoY
- ▼ -910.70%
- Current HPI
- 297.7444
- Rent YoY
- ▲ 5.22%
- Metro
- Oxnard-Thousand Oaks-Ventura, CA
- State GDP YoY
- ▲ 3.21%
- F500 in state
- 116
Industry mix (Fortune 500 HQ in CA)
| Industry | F500 HQs | Revenue |
|---|---|---|
| Technology | 27 | $1,492B |
|
||
| Financial Services | 3 | $174B |
|
||
| Retail | 3 | $44B |
|
||
| Insurance | 3 | $26B |
|
||
| Media / Entertainment | 2 | $115B |
|
||
| Pharmaceuticals / Biotech | 2 | $62B |
|
||
Price history
1 event — show timeline
- 2026-03-29 Listed $220,000 CSMAR
Property tax history
+17.2%/yrLatest (2025): $127 · +1389.2% YoY. Source: county tax records.
Cash-flow waterfall
monthlySold comps — $/sqft
last 12 mo · ≤1 miLoading sold comps…