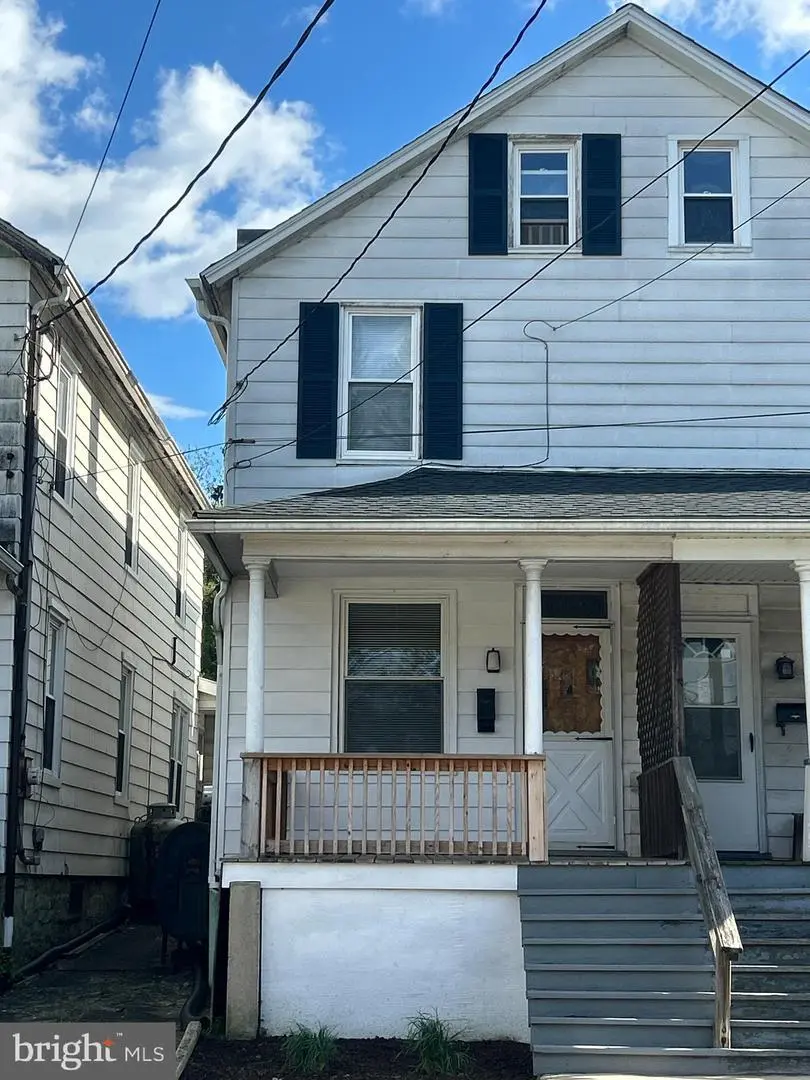
506 E Center St · Upper Paxton, PA
Flood risk 1/10 · Minimal
- FEMA flood zone
- X (unshaded)
- Chance of flooding over 30 yrs
- 0.0%
- Est. flood insurance / yr
- $473 – $860
Fire risk 3/10 · Minor
- Est. fire insurance / yr
- $511 – $949
Heat risk 5/10 · Moderate
- Hot days now (above 99°F)
- 7 days/yr
- Hot days in 30 yrs
- 15 days/yr
Wind risk 2/10 · Minimal
- Chance of severe wind over 30 yrs
- 3.0%
Air-quality risk 1/10 · Minimal
- Unhealthy air days now
- 0 days/yr
- Unhealthy air days in 30 yrs
- 0 days/yr
Risk factors via First Street. Map © Google.
Why this score? — see what drove the D grade
The composite is a weighted blend of 9 inputs, each scored 0–100. Each bar is that input's sub-score; the figure is the points it added to the 100-point composite (weight × sub-score).
- Cash flow +12.6/30.0
- ARV discount +6.9/15.0
- Appreciation +5.6/10.0
- DSCR +3.7/10.0
- Schools +3.7/10.0
- 1% rule +2.8/10.0
- Rent growth +2.5/5.0
- Livability +2.5/5.0
- Condition / age +2.5/5.0
$129,900
🖨 Deal sheet (PDF) 📄 Offer letter ✓ Due diligence
Listing remarks MLS
Newly remodeled 2 bedroom 1 bath home in Miilersburg features new flooring in the eat in kitchen and new wall to wall carpet in the Dining and Main room. The new countertops in the kitchen and the bath along with new plumbing and lighting fixtures give this home a stylish and fresh look. Off street parking in the rear of the home make parking easy and convenient. Washer and Dryer convey to new owner. The covered front porch is a great place to enjoy the evenings. The full basement houses the oil heating system that has been recently serviced, electric water heater and 100 amp electric panel.
Key facts
- Covered front porch
- Off street parking
- New flooring
Tags
Neighborhood map
What this means for you Summary
Snapshot
- This is a 2-bed/1.0-bath single-family listed at $130k.
Deal economics
- At list price, monthly cash flow is $-17 ($-208/yr) — negative.
- To cash-flow at today's rent, offer at most $127k (2.4% below list).
- To meet the 1% rule (rent ≥ 1% of price), the offer needs to be $102k (21.7% below list).
- Recommended offer: $102k (21.7% below list) — sets the bar for 1% rule.
Location & tenants
- Location reads: area grade D — affects rentability + tenant quality, not the cash-flow math above.
- Millersburg Area SD (town): math 36% / reading 51% proficiency, ranked #288 of 539 in PA (top 53%) — families likely to look elsewhere, expect single-tenant / working-renter base with shorter leases.
- Zoned schools: Lenkerville El Sch (math 52% / reading 57%, grade C, #504 of 1,518 statewide, top 37%, 313 students, 49% FRL); Millersburg Area Ms (math 17% / reading 47%, grade F, #362 of 512 statewide, top 71%, 157 students, 39% FRL); Millersburg Area Shs (math 64%, 229 students, 42% FRL).
- Market conditions: 32 active listings in the ZIP; 2 comparable units currently listed for rent nearby; 540 units permitted in Dauphin County in 2024 (194 in 5+ unit buildings).
Forward outlook
- In year one you build about $2k of equity ($898 loan paydown + $2k appreciation (1.2% local appreciation)).
- At projected returns (1.2% appreciation + 3.0% rent growth), your $36k cash investment doubles in ~10 years — after that, you're playing with house money.
Negotiation context
- It's been on market 96 days — a 9% lower offer ($118k) is reasonable based on typical stale-listing flexibility.
- 2 sale attempts since 16y ago; this cycle's ask has dropped $8k (6%) from the opening price — seller is motivated, your offer sets the floor, not the list.
Risks & watch-outs
- Watch-outs: built in 1920 — expect roof / HVAC / electrical / plumbing capex.
- Climate carrying-cost: extreme-heat days projected 7→15/yr by 2055 (HVAC capex compounding) — expect insurance premiums to compound above CPI over the hold.
Questions for the listing agent
- What do current leases actually rent for vs. the listed asking? Can we see a recent rent roll and the last 12 months of T-12 income?
- It's been on market 96 days. Have you received any prior offers? Is the seller open to a 22% concession, seller financing, or rate buy-down credit?
- Built in 1920 — when were the roof, HVAC, electrical panel, plumbing, and water heater last replaced?
- Why hasn't it sold? Are there any deal-killer items the seller is aware of (foundation, flood, title, zoning, code violations)?
- Is there a deadline driving the sale (1031 exchange, divorce, estate, relocation)? That informs how much negotiation room exists.
- The area grade is low — what's the realistic commute time and amenity access for the typical tenant pool here? Any planned neighborhood developments (good or bad) we should know about?
- What's the average days-on-market for RENTAL listings here right now (not sales)? A rising rental-DOM trend means longer vacancies and softer asking-rent achievability than the comps imply.
- What's the recent tenant-quality profile in this submarket — average credit score on applications, eviction rate, late-payment / NSF rate, and stable-employment percentage? A property-management company in the area should have these aggregated.
- How much new for-sale + rental construction is in the pipeline within 1–3 miles? Heavy new supply typically softens prices + rents 12–24 months out; constrained supply supports both.
Investment metrics
- 1% rule
- 0.78% ✗
- Cap rate
- 6.13%
- Cash-on-cash
- -0.57%
- DSCR
- 0.97
- GRM
- 10.6
CMA / ARV
- ARV (median comp)
- $128,233
- List price
- $129,900
- Delta
- 1.30%
- Verdict
- FAIR
- Comps
- 20 within 1.0 mi
Show comp detail 3 sales within ~0.75 mi
| Address | Dist | Beds/Ba | Sqft | Sold | Price | $/sf | Match |
|---|---|---|---|---|---|---|---|
| 224 North St | 0.56mi | 2/1.0 | 972 (-3%) | 14mo | $130,000 | $134 | 57 |
| 907 Meadow Ln | 0.70mi | 2/2.0 | 1,088 (+8%) | 2mo | $170,000 | $156 | 48 |
| 849 Union St | 0.68mi | 3/1.0 (+1) | 912 (-9%) | 12mo | $165,000 | $181 | 38 |
Match score weights: distance 35% · size 25% · config 20% · recency 20%. Top-matched comps best support the ARV.
Projected returns pro-forma
1.2% appreciation · 3.0% rent growth · sell at horizon
- IRR
- 1.4%
- Equity multiple
- 1.07×
- Total profit
- $2,598
- Equity at exit
- $45,732
- IRR
- 5.9%
- Equity multiple
- 1.73×
- Total profit
- $26,725
- Equity at exit
- $61,859
Cash invested: $36,372 (down + closing). Projections, not guarantees.
Landlord ↔ Tenant lean methodology
- Overall (STATE)
- 62 Landlord-Friendly
- State Pennsylvania
- 62 Landlord-Friendly · EVEN
- County
- — inherits STATE
- City
- — inherits STATE
ZIP-level market 17061
- Home prices YoY
- 0.4%
- Active inventory
- 32
- Price-to-rent
- 10.6×
Monthly cashflow live
- Estimated rent
- $1,017 medium interval (Pro) →
- Mortgage (P&I)
- −$681
- Tax from tax record
- −$85 /mo · $1,023/yr
- Insurance
- −$54
- HOA
- −$0
- Vacancy / Maint / Mgmt
- −$214
- Net cashflow
- $-17
Break-even live
Sensitivity live
| Price | -10% $56 | -5% $19 | +0% $-17 | +5% $-54 | +10% $-91 |
|---|---|---|---|---|---|
| Rent | -10% $-98 | -5% $-57 | +0% $-17 | +5% $23 | +10% $63 |
| Rate | -1.0pp $48 | -0.5pp $16 | base $-17 | +0.5pp $-51 | +1.0pp $-85 |
UW: 25.0% down · 7.5% · 30yr · 1.5% tax · 5.0% vac · 8.0% maint · 8.0% mgmt
Financing live
Cash to close
- Down payment
- $32,475
- Closing costs
- $3,897
- Reserves months
- —
- Total cash needed
- —
Loan-product check · same deal, 3 products live
Conventional
25% down · 7.5% · 30yr
- Down + closing
- —
- Monthly P&I
- —
- Monthly cashflow
- —
- DSCR
- —
- Eligible?
- —
Personal DTI + credit; lowest rate.
DSCR
20% down · 8.5% · 30yr
- Down + closing
- —
- Monthly P&I
- —
- Monthly cashflow
- —
- DSCR
- —
- Eligible?
- —
No personal income docs; deal must DSCR.
Hard money
10% down · 12.0% · 12mo
- Down + closing
- —
- Monthly P&I
- —
- Monthly cashflow
- —
- DSCR
- —
- Eligible?
- —
Short-term bridge; refi at stabilization.
Rent comps 2 comps
| Address | Beds | Baths | Sqft | Rent | $/sqft | DOM | Units | Dist |
|---|---|---|---|---|---|---|---|---|
| 161 Hillside Hts Millersburg, PA | 2.0 | 1.0 | 1000 | $959 | $0.96 | 25d | 1 | 0.13mi |
| 123 Natures Trl Millersburg, PA | 2.0 | 3.0 | 1440 | $1,625 | $1.13 | 25d | 1 | 0.93mi |
Listing history 22 events
-
2026-06-21days on market $129,900 Active 96 DOM
-
2026-06-21days on market $129,900 Active 95 DOM
-
2026-06-18days on market $129,900 Active 93 DOM
-
2026-06-17days on market $129,900 Active 92 DOM
-
2026-06-16days on market $129,900 Active 91 DOM
-
2026-06-15days on market $129,900 Active 90 DOM
-
2026-06-13days on market $129,900 Active 88 DOM
-
2026-06-12days on market $129,900 Active 87 DOM
-
2026-06-09days on market $129,900 Active 84 DOM
-
2026-06-08days on market $129,900 Active 83 DOM
-
2026-06-08days on market $129,900 Active 82 DOM
-
2026-06-07days on market $129,900 Active 81 DOM
-
2026-06-04days on market $129,900 Active 78 DOM
-
2026-06-02days on market $129,900 Active 77 DOM
-
2026-06-01days on market $129,900 Active 76 DOM
-
2026-05-31days on market $129,900 Active 75 DOM
-
2026-04-17price $129,900 598-char remark
Show marketing remark (598 chars)
Newly remodeled 2 bedroom 1 bath home in Miilersburg features new flooring in the eat in kitchen and new wall to wall carpet in the Dining and Main room. The new countertops in the kitchen and the bath along with new plumbing and lighting fixtures give this home a stylish and fresh look. Off street parking in the rear of the home make parking easy and convenient. Washer and Dryer convey to new owner. The covered front porch is a great place to enjoy the evenings. The full basement houses the oil heating system that has been recently serviced, electric water heater and 100 amp electric panel.
-
2026-03-17$137,500 Active 598-char remark
Show marketing remark (598 chars)
Newly remodeled 2 bedroom 1 bath home in Miilersburg features new flooring in the eat in kitchen and new wall to wall carpet in the Dining and Main room. The new countertops in the kitchen and the bath along with new plumbing and lighting fixtures give this home a stylish and fresh look. Off street parking in the rear of the home make parking easy and convenient. Washer and Dryer convey to new owner. The covered front porch is a great place to enjoy the evenings. The full basement houses the oil heating system that has been recently serviced, electric water heater and 100 amp electric panel.
-
2025-06-27soldstatus $825,000
-
2010-05-14soldstatus $35,000 123-char remark
Show marketing remark (123 chars)
Why Rent this 2 bedroom 1/2 duplex has replacement windows; newer roof; 2008 furnace; low taxes. Gas wall heater in kitchen
-
2010-03-10historical 123-char remark
Show marketing remark (123 chars)
Why Rent this 2 bedroom 1/2 duplex has replacement windows; newer roof; 2008 furnace; low taxes. Gas wall heater in kitchen
-
2010-01-14$46,500 123-char remark
Show marketing remark (123 chars)
Why Rent this 2 bedroom 1/2 duplex has replacement windows; newer roof; 2008 furnace; low taxes. Gas wall heater in kitchen
ⓘ Source: listings_history table (triggers on properties + properties_extension) + one-shot
backfill from property_details.listing_events for pre-trigger history.
Tax reassessment forecast PA · Partial reset (capped growth)
- Current annual tax
- $1,023 · $85/mo
- Projected year-2 tax
- $1,538 · $128/mo
- Expected delta
- +$515/yr (+$43/mo · 50.3%)
ⓘ Screening estimate from a state-policy table — verify with the county assessor before closing.
Climate risk First Street
- Flood 1/10 Low FEMA zone X (unshaded) · 0% chance over 30 yrs
- Wildfire 3/10 Moderate
- Heat 5/10 Major 7 d/yr ≥99°F today · 15 d/yr by 30 yrs out
- Wind 2/10 Low 3% chance of damaging wind over 30 yrs
- Air quality 1/10 Low 0 unhealthy d/yr today · 0 by 30 yrs out
Nearby sold comps map
Loading sold comps map…
Walkable amenities ~0.75 mi
Loading nearby amenities…
Taxation est. · year 1
- Rental income
- $12,202
- − Mortgage interest
- −$7,276
- − Property taxes
- −$1,023
- − Insurance
- −$650
- − Repairs & maintenance
- −$976
- − Management
- −$976
- − Depreciation
- −$3,779
- Taxable loss
- −$2,478
- Est. tax savings @ 24.0%
- +$595
- After-tax cash flow
- $387/yr
For passive investors: Depreciation is non-cash, so a rental often shows a tax loss while cash-flowing — sheltering income. Rental losses are passive: they offset passive income freely, and up to $25,000/yr can offset ordinary (W-2) income if you actively participate and your MAGI is under $100k (phasing out to $0 by $150k); unused losses carry forward. On sale, claimed depreciation is recaptured at up to 25%, and gains may owe capital-gains tax (a 1031 exchange can defer both). Figures are a year-1 estimate at your 24.0% rate — not tax advice; consult a CPA.
Schools (NCES district)
- District
- Millersburg Area SD
- NCES district ID
- 4215360
- Math proficiency
- 36% ▼ -16.00%
- Reading proficiency
- 51% ▼ -14.00%
- Median HH income
- $50,625
- Composite
- 37.4/100
- National rank
- #4426
- State rank
- #288 of 539 in PA
Livability — Upper Paxton
No livability data for this city. (Only ~50 U.S. cities are tracked.)
Census & demographics
- Census place
- Lenkerville, PA
- Population (ZIP)
- 6,825
Population outlook (Dauphin County) Hauer SSP2
- Today (2025)
- 281,628 people
- By 2030
- 283,549 · +0.7%
- By 2040
- 285,385 · +1.3%
- By 2050
- 286,188 · +1.6%
- By 2075
- 291,053 · +3.3%
- By 2100
- 282,374 · +0.3%
Race, ethnicity, and origin ACS 2023
- Neighborhood character
- Predominantly White (89%)
- Race & ethnicity
- White 89% Two or more races 6% Hispanic / Latino 2% Asian 1% Black 1%
- Common ancestry
- Romanian 3% Polish 2% Slovak 1%
- Foreign-born
- 1% · China
- Languages at home
- 94% English-only · German/W. Germanic 4% Other Indo-European 1% Chinese 1%
Political lean MEDSL · Dauphin
- 2024 margin
- Lean D (+5.9) · D 52.4% · R 46.5% · Other 1.1%
- 2008→2024 swing
- -3.1pp toward R · 2008: 9.1pp · 2024: 5.9pp
- All cycles
- 2024: D+5.9 2020: D+8.5 2016: D+2.8 2012: D+6.0 2008: D+9.1
Not yet ingested
- Civics
- —
Market trends
- HPI YoY
- ▲ 1.20%
- Current HPI
- 271.943
- Rent YoY
- —
- Metro
- —
- State GDP YoY
- ▲ 1.68%
- F500 in state
- 34
Industry mix (Fortune 500 HQ in PA)
| Industry | F500 HQs | Revenue |
|---|---|---|
| Healthcare | 2 | $309B |
|
||
| Insurance | 2 | $27B |
|
||
| Telecommunications / Media | 1 | $124B |
|
||
| Industrial Distribution | 1 | $22B |
|
||
| Financial Services | 1 | $20B |
|
||
| Chemicals / Materials | 1 | $18B |
|
||
Price history
+179.4% since first listed6 events — show timeline
- 2026-04-17 Price Changed $129,900 BRIGHT MLS
- 2026-03-17 Listed $137,500 BRIGHT MLS
- 2025-06-27 Sold (Public Records) $825,000 Public Records
- 2010-05-14 Sold (MLS) $35,000 BRIGHT MLS
- 2010-03-10 Listing Removed — BRIGHT MLS
- 2010-01-14 Listed $46,500 BRIGHT MLS
Property tax history
+3.3%/yrLatest (2026): $1,023 · +7.7% YoY. Source: county tax records.
Cash-flow waterfall
monthlySold comps — $/sqft
last 12 mo · ≤1 miLoading sold comps…