 38-Plex
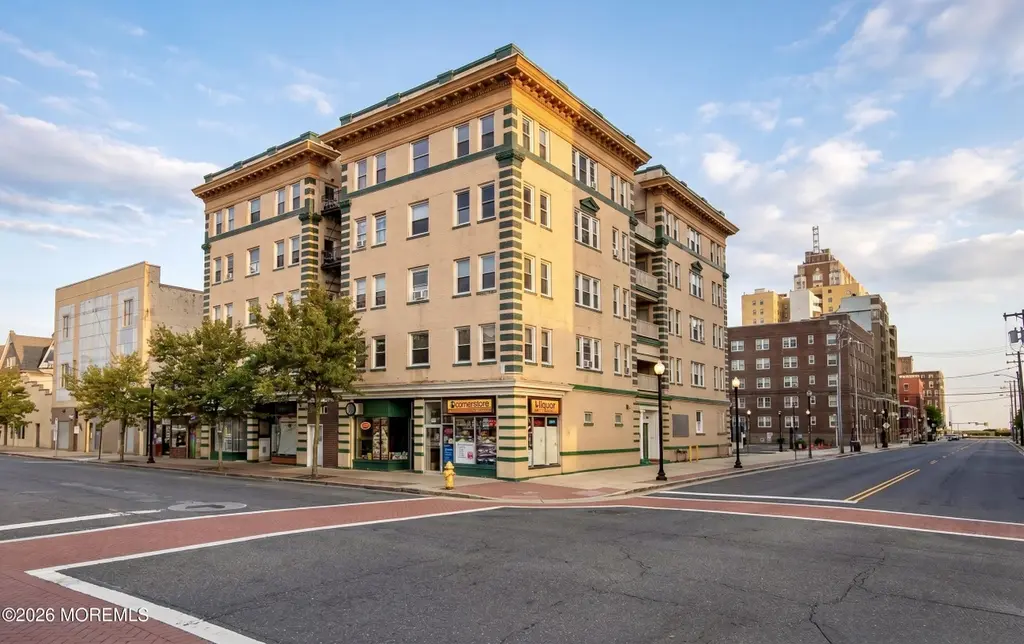
2722 Atlantic Ave · Atlantic City, NJ
Flood risk No data
- FEMA flood zone
- —
- Chance of flooding over 30 yrs
- —
- Est. flood insurance / yr
- —
Fire risk No data
- Est. fire insurance / yr
- —
Heat risk No data
- Hot days now (above threshold)
- —
- Hot days in 30 yrs
- —
Wind risk No data
- Chance of severe wind over 30 yrs
- —
Air-quality risk No data
- Unhealthy air days now
- —
- Unhealthy air days in 30 yrs
- —
Risk factors via First Street. Map © Google.
Why this score? — see what drove the B grade
The composite is a weighted blend of 9 inputs, each scored 0–100. Each bar is that input's sub-score; the figure is the points it added to the 100-point composite (weight × sub-score).
- Cash flow +30.0/30.0
- 1% rule +10.0/10.0
- DSCR +10.0/10.0
- ARV discount +7.5/15.0
- Appreciation +5.0/10.0
- Livability +2.8/5.0
- Rent growth +2.5/5.0
- Condition / age +2.5/5.0
- Schools +1.4/10.0
$3,800,000
🖨 Deal sheet 📄 Offer letter ✓ Due diligence
Multi-family units
County records classify this as Multi-Family (5+ Unit). Listing-text estimate: 38 units. confirmed
5+ unit building — per-unit beds/baths from public records are typically unavailable; the breakdown below (if shown) is an estimate from the listing text.
Listing remarks
Prime investment opportunity in the heart of Atlantic City! Located at the corner of Atlantic and South Iowa Avenues , this 38-unit mixed-use elevator building sits immediately adjacent to the Tropicana Atlantic City, capturing incredible foot traffic. The 37,673 SF property features 32 residential units and 6 ground-floor retail storefronts. It currently generates a strong 8.60% cap rate on as-is NOI, with a clear path to a 9.55% pro forma cap rate. There is excellent value-add potential through the immediate lease-up of three vacant residential units, rent-control leniency on tenant turnover, and a gas-to-electric heat conversion opportunity. Asking price is $4,100,000.
Key facts
- 0.25 acre lot
- Built 1930
- Listed 43 days
Property features AI
Finance
- Other: Parcel number 02-00174-0000-00001; Tax block 174, lot 1 (tax year 2025)
Exterior
- Parking: No garage spaces
- Utilities: Public sewer
- Home design: Individually owned
- Exterior features: Located in Atlantic City area
Interior
- Bathrooms: No bathrooms
- Heating & cooling: Cooling present (type: Other)
- Interior features: No fireplaces; Partially finished basement with shared storage
Neighborhood map
What this means for you Summary
Snapshot
- This is a 38 × 1-bed/1-bath units multifamily listed at $3.80M.
Deal economics
- At list price, monthly cash flow is $26k ($315k/yr) — positive. Per door: $691/mo.
- The deal already cash-flows at list — no discount required.
- Meets the 1% rule at list price ($67k rent vs $3.80M).
- Recommended offer: $3.69M (3.0% below list) — sets the bar for market timing.
- Cap rate 14.6% vs local median 3.7% in Atlantic City — top-decile yield for the area; either an underpriced asset or a hidden risk that comps aren't pricing in. Stress-test before assuming the spread holds.
Location & tenants
- Location reads 55/100 on livability (#525 in NJ) — a working-class tenant base; expect higher turnover. Strengths: health & safety A; Watch: commute D, schools F, crime F.
- Atlantic City School District (urban): math 9% / reading 26% proficiency, ranked #454 of 472 in NJ (top 96%) — low school quality limits family demand, transient renter base, plan for 1-2y turnover; 85% free/reduced lunch — lower-income household profile, screen leases tightly.
- Market conditions: 2 active listings in the ZIP; 672 units permitted in Atlantic County in 2024 (258 in 5+ unit buildings).
Forward outlook
- In year one you build about $140k of equity ($26k loan paydown + $114k appreciation (3.0% local appreciation)).
- Atlantic County population projected at -12% by 2050 — secular population decline; favor cash flow + early exit over multi-decade hold.
- At projected returns (3.0% appreciation + 3.0% rent growth), your $1.06M cash investment doubles in ~3 years — after that, you're playing with house money.
- By year 2, paydown + projected appreciation supports a ~$228k cash-out refi (75% LTV) — recoverable capital for the next deal without selling this one.
Negotiation context
- It's been on market 44 days — a 3% lower offer ($3.69M) is reasonable based on typical stale-listing flexibility.
- Current owner paid $2.62M; 45% above their basis — modest negotiation headroom, anchor on the comps not their cost.
Risks & watch-outs
- Watch-outs: built in 1930 — expect roof / HVAC / electrical / plumbing capex.
Questions for the listing agent
- It's been on market 44 days. Have you received any prior offers? Is the seller open to a 3% concession, seller financing, or rate buy-down credit?
- Can we see the unit-by-unit rent roll, current vacancy, and any below-market leases? What's the average tenancy length?
- What capital expenditures (roof, boiler, parking lot, exteriors) have been made in the last 5 years, and what's planned in the next 2?
- Built in 1930 — when were the roof, HVAC, electrical panel, plumbing, and water heater last replaced?
- Is there a deadline driving the sale (1031 exchange, divorce, estate, relocation)? That informs how much negotiation room exists.
- Schools are F-rated, which usually means shorter tenancies and higher turnover. Who's the typical renter profile here, and what's been the actual vacancy rate?
- Crime grade is F in this area — have there been break-ins, vandalism, or insurance claims at this property in the last 3 years? What carrier currently insures it and at what premium?
- What's the average days-on-market for RENTAL listings here right now (not sales)? A rising rental-DOM trend means longer vacancies and softer asking-rent achievability than the comps imply.
- What's the recent tenant-quality profile in this submarket — average credit score on applications, eviction rate, late-payment / NSF rate, and stable-employment percentage? A property-management company in the area should have these aggregated.
- How much new apartment / multifamily construction is in the pipeline within 1–3 miles? Heavy new supply (>2% of stock underway) typically softens rents 12–24 months out; light construction supports rent growth.
Investment metrics
- 1% rule
- 1.75% ✓
- Cap rate
- 14.59%
- Cash-on-cash
- 29.63%
- DSCR
- 2.32
- GRM
- 4.8
CMA / ARV
No comps found within radius.
Projected returns pro-forma
3.0% appreciation · 3.0% rent growth · sell at horizon
- IRR
- 35.5%
- Equity multiple
- 3.00×
- Total profit
- $2,132,042
- Equity at exit
- $1,708,645
- IRR
- 35.6%
- Equity multiple
- 5.93×
- Total profit
- $5,246,892
- Equity at exit
- $2,633,225
Cash invested: $1,064,000 (down + closing). Projections, not guarantees.
Landlord ↔ Tenant lean methodology
- Overall (STATE)
- 21 Tenant-Leaning
- State New Jersey
- 21 Tenant-Leaning · D+6
- County
- — inherits STATE
- City
- — inherits STATE
ZIP-level market 08405
- Active inventory
- 2
- Price-to-rent
- 180.8×
Monthly cashflow live
- Estimated rent
- $66,557 high interval (Pro) →
- Mortgage (P&I)
- −$19,928
- Tax from tax record
- −$4,798 /mo · $57,572/yr
- Insurance
- −$1,583
- HOA
- −$0
- Vacancy / Maint / Mgmt
- −$13,977
- Net cashflow
- $26,271
Break-even live
38-unit breakdown (identical units grouped — click to expand)
| Units | Beds | Baths | Est. rent |
|---|---|---|---|
| 38× units | 1 | 1 | $66,538 |
| #1 | 1 | 1 | $1,751 |
| #2 | 1 | 1 | $1,751 |
| #3 | 1 | 1 | $1,751 |
| #4 | 1 | 1 | $1,751 |
| #5 | 1 | 1 | $1,751 |
| #6 | 1 | 1 | $1,751 |
| #7 | 1 | 1 | $1,751 |
| #8 | 1 | 1 | $1,751 |
| #9 | 1 | 1 | $1,751 |
| #10 | 1 | 1 | $1,751 |
| #11 | 1 | 1 | $1,751 |
| #12 | 1 | 1 | $1,751 |
| #13 | 1 | 1 | $1,751 |
| #14 | 1 | 1 | $1,751 |
| #15 | 1 | 1 | $1,751 |
| #16 | 1 | 1 | $1,751 |
| #17 | 1 | 1 | $1,751 |
| #18 | 1 | 1 | $1,751 |
| #19 | 1 | 1 | $1,751 |
| #20 | 1 | 1 | $1,751 |
| #21 | 1 | 1 | $1,751 |
| #22 | 1 | 1 | $1,751 |
| #23 | 1 | 1 | $1,751 |
| #24 | 1 | 1 | $1,751 |
| #25 | 1 | 1 | $1,751 |
| #26 | 1 | 1 | $1,751 |
| #27 | 1 | 1 | $1,751 |
| #28 | 1 | 1 | $1,751 |
| #29 | 1 | 1 | $1,751 |
| #30 | 1 | 1 | $1,751 |
| #31 | 1 | 1 | $1,751 |
| #32 | 1 | 1 | $1,751 |
| #33 | 1 | 1 | $1,751 |
| #34 | 1 | 1 | $1,751 |
| #35 | 1 | 1 | $1,751 |
| #36 | 1 | 1 | $1,751 |
| #37 | 1 | 1 | $1,751 |
| #38 | 1 | 1 | $1,751 |
| Total (38 units) | $66,557 | ||
UW: 25.0% down · 7.5% · 30yr · 1.5% tax · 5.0% vac · 8.0% maint · 8.0% mgmt
Financing live
Cash to close
- Down payment
- $950,000
- Closing costs
- $114,000
- Reserves months
- —
- Total cash needed
- —
Loan-product check · same deal, 3 products live
Conventional
25% down · 7.5% · 30yr
- Down + closing
- —
- Monthly P&I
- —
- Monthly cashflow
- —
- DSCR
- —
- Eligible?
- —
Personal DTI + credit; lowest rate.
DSCR
20% down · 8.5% · 30yr
- Down + closing
- —
- Monthly P&I
- —
- Monthly cashflow
- —
- DSCR
- —
- Eligible?
- —
No personal income docs; deal must DSCR.
Hard money
10% down · 12.0% · 12mo
- Down + closing
- —
- Monthly P&I
- —
- Monthly cashflow
- —
- DSCR
- —
- Eligible?
- —
Short-term bridge; refi at stabilization.
Listing history 21 events
-
2026-06-19days on market $3,800,000 Active 44 DOM
-
2026-06-18days on market $3,800,000 Active 43 DOM
-
2026-06-17days on market $3,800,000 Active 42 DOM
-
2026-06-16days on market $3,800,000 Active 41 DOM
-
2026-06-15days on market $3,800,000 Active 40 DOM
-
2026-06-14days on market $3,800,000 Active 38 DOM
-
2026-06-13days on market $3,800,000 Active 37 DOM
-
2026-06-10days on market $3,800,000 Active 35 DOM
-
2026-06-09days on market $3,800,000 Active 34 DOM
-
2026-06-08days on market $3,800,000 Active 33 DOM
-
2026-06-07days on market $3,800,000 Active 32 DOM
-
2026-06-02days on market $3,800,000 Active 27 DOM
-
2026-06-01days on market $3,800,000 Active 26 DOM
-
2026-05-31days on market $3,800,000 Active 25 DOM
-
2026-05-30days on market $3,800,000 Active 24 DOM
-
2026-05-17price $3,800,000 680-char remark
-
2026-05-06$4,100,000 Active 680-char remark
-
2026-05-05historical $4,100,000 680-char remark
-
2022-02-16price $799
-
2016-12-27soldstatus $2,625,000
-
1995-08-17soldstatus $650,000
ⓘ Source: listings_history table (triggers on properties + properties_extension) + one-shot
backfill from property_details.listing_events for pre-trigger history.
Tax reassessment forecast NJ · Partial reset (capped growth)
- Current annual tax
- $57,572 · $4,798/mo
- Projected year-2 tax
- $76,096 · $6,341/mo
- Expected delta
- +$18,524/yr (+$1,544/mo · 32.2%)
ⓘ Screening estimate from a state-policy table — verify with the county assessor before closing.
Nearby sold comps map
Loading sold comps map…
Walkable amenities ~0.75 mi
Loading nearby amenities…
Taxation est. · year 1
- Rental income
- $798,684
- − Mortgage interest
- −$212,859
- − Property taxes
- −$57,572
- − Insurance
- −$19,000
- − Repairs & maintenance
- −$63,895
- − Management
- −$63,895
- − Depreciation
- −$110,545
- Taxable income
- $270,918
- Est. tax owed @ 24.0%
- −$65,020
- After-tax cash flow
- $250,237/yr
For passive investors: Depreciation is non-cash, so a rental often shows a tax loss while cash-flowing — sheltering income. Rental losses are passive: they offset passive income freely, and up to $25,000/yr can offset ordinary (W-2) income if you actively participate and your MAGI is under $100k (phasing out to $0 by $150k); unused losses carry forward. On sale, claimed depreciation is recaptured at up to 25%, and gains may owe capital-gains tax (a 1031 exchange can defer both). Figures are a year-1 estimate at your 24.0% rate — not tax advice; consult a CPA.
Schools (NCES district)
- District
- Atlantic City School District
- NCES district ID
- 3400960
- Math proficiency
- 9% ▼ -12.00%
- Reading proficiency
- 26% ▼ -6.00%
- Median HH income
- $27,842
- Composite
- 13.66/100
- National rank
- #9504
- State rank
- #454 of 472 in NJ
Livability — Atlantic City
- Score
- 55/100
- State rank
- #525
- US rank
- #23095
Category grades
Schools grade is shown separately in the Schools card above.
Census & demographics
- Census place
- Atlantic City, NJ
Population outlook (Atlantic County) Hauer SSP2
- Today (2025)
- 268,948 people
- By 2030
- 264,497 · -1.7%
- By 2040
- 252,261 · -6.2%
- By 2050
- 237,846 · -11.6%
- By 2075
- 210,650 · -21.7%
- By 2100
- 180,234 · -33.0%
Not yet ingested
- Political lean
- —
- Race & ethnicity
- —
- Common origin
- —
- Civics
- —
Market trends
- HPI YoY
- —
- Current HPI
- —
- Rent YoY
- —
- Metro
- —
- State GDP YoY
- ▲ 2.05%
- F500 in state
- 34
Industry mix (Fortune 500 HQ in NJ)
| Industry | F500 HQs | Revenue |
|---|---|---|
| Consumer Goods | 3 | $31B |
|
||
| Pharmaceuticals | 2 | $153B |
|
||
| Technology | 2 | $21B |
|
||
| Insurance | 2 | $20B |
|
||
| Healthcare | 2 | $19B |
|
||
| Financial Services | 1 | $70B |
|
||
Price history
+484.6% since first listed6 events — show timeline
- 2026-05-17 Price Changed $3,800,000 MOMLS
- 2026-05-06 Listed $4,100,000 MOMLS
- 2026-05-05 Coming Soon $4,100,000 MOMLS
- 2022-02-16 Price Changed $799 RENT.
- 2016-12-27 Sold (Public Records) $2,625,000 Public Records
- 1995-08-17 Sold (Public Records) $650,000 Public Records
Property tax history
-3.7%/yrLatest (2025): $57,572 · -2.1% YoY. Source: county tax records.
Cash-flow waterfall
monthlySold comps — $/sqft
last 12 mo · ≤1 miLoading sold comps…