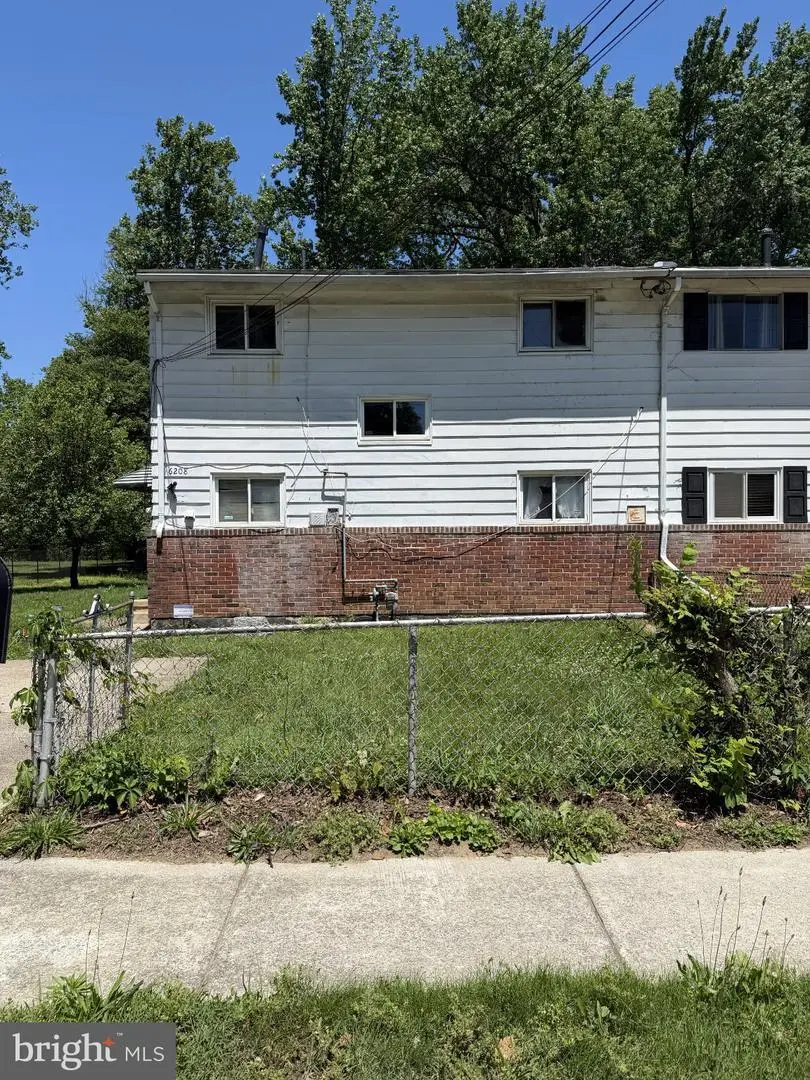
6208 Seat Pleasant Dr · Seat Pleasant, MD
Flood risk 4/10 · Minor
- FEMA flood zone
- X (unshaded)
- Chance of flooding over 30 yrs
- 0.22%
- Est. flood insurance / yr
- $507 – $1,088
Fire risk 1/10 · Minimal
- Est. fire insurance / yr
- $755 – $1,403
Heat risk 8/10 · Major
- Hot days now (above 103°F)
- 7 days/yr
- Hot days in 30 yrs
- 15 days/yr
Wind risk 4/10 · Minor
- Chance of severe wind over 30 yrs
- 23.0%
Air-quality risk 4/10 · Minor
- Unhealthy air days now
- 4 days/yr
- Unhealthy air days in 30 yrs
- 5 days/yr
Risk factors via First Street. Map © Google.
Why this score? — see what drove the C grade
The composite is a weighted blend of 9 inputs, each scored 0–100. Each bar is that input's sub-score; the figure is the points it added to the 100-point composite (weight × sub-score).
- Cash flow +18.8/30.0
- ARV discount +15.0/15.0
- DSCR +5.9/10.0
- 1% rule +5.6/10.0
- Rent growth +4.0/5.0
- Livability +3.2/5.0
- Condition / age +2.5/5.0
- Schools +1.7/10.0
- Appreciation +0.0/10.0
$269,000
🖨 Deal sheet (PDF) 📄 Offer letter ✓ Due diligence
Listing remarks
Fantastic Opportunity for Investors or Future Owner‑Occupants Unlock the potential of this 4‑bedroom end‑unit home, perfectly positioned for renovation, customization, or long‑term investment. With a roof less than 4 years old, off‑street parking, and a large corner lot ideal for outdoor entertaining, this property offers a strong foundation for your vision. Enjoy quick and convenient access to the Capitol Beltway, major commuter routes, and downtown DC, making this an excellent choice for those seeking value, location, and opportunity in one package. Whether you’re an investor looking for your next project or an owner‑occupant ready to create your dream home, this property delivers o
Key facts
- Built 1960
- Listed 8 days
Property features AI
Finance
- Other: Fee simple ownership; Property condition listed as below average
Exterior
- Parking: Off-street parking
- Utilities: Public water; Public sewer; Electric cooling fuel; Natural gas heating fuel
- Home design: Semi-detached (duplex-style) home; Estimated year built
- Construction: Frame construction; Block foundation
- Exterior features: No tidal water on the lot; Above-grade and below-grade structures noted
Interior
- Kitchen: Stove; Microwave; Refrigerator; Dishwasher; Disposal
- Bedrooms: Four bedrooms on the upper level
- Flooring: Wood floors
- Bathrooms: One full bathroom (upper level); One half bathroom (main level)
- Heating & cooling: Central heating (forced air) using natural gas; Central air conditioning; Ceiling fans; Electric hot water
- Interior features: Dining area; Window treatments; Wood floors; Partially finished basement; Living room, foyer, recreation room, and half bath among main rooms
- Laundry & utility: Washer; Dryer; Exhaust fan
Neighborhood map
What this means for you Summary
Snapshot
- This is a 4-bed/1.5-bath townhouse listed at $269k.
Deal economics
- At list price, monthly cash flow is $271 ($3k/yr) — positive.
- The deal already cash-flows at list — no discount required.
- Meets the 1% rule at list price ($3k rent vs $269k).
- Cap rate 7.5% vs local median 5.3% in Seat Pleasant — top-decile yield for the area; either an underpriced asset or a hidden risk that comps aren't pricing in. Stress-test before assuming the spread holds.
Location & tenants
- Location reads 63/100 on livability (#301 in MD) — a middle-class / working-renter tenant base. Strengths: commute A+, housing A+, health & safety B+; Watch: schools F, crime F, amenities F.
- Prince George'S County Public Schools (suburban): math 8% / reading 24% proficiency, ranked #21 of 24 in MD (top 88%) — low school quality limits family demand, transient renter base, plan for 1-2y turnover.
- Market conditions: Rents rising fast (+5.9%/yr); 215 active listings in the ZIP; 39 comparable units currently listed for rent nearby; rentals at typical pace (median 25d on market — plan ~3-4 weeks tenant-placement turnaround); solid renter incomes; 1,481 units permitted in Prince George's County in 2024 (0 in 5+ unit buildings).
- This rent runs 45% of the median local income ($76k/yr) — at the standard rent-burdened threshold; future hikes will face affordability resistance.
Forward outlook
- Local home prices are declining (-3.0%/yr); year-one equity from $2k of loan paydown is wiped out by about $8k of value loss. Plan a longer hold.
- Prince George's County population projected at +18% by 2050 — long-run rental-demand tailwind backs the buy-and-hold thesis.
Negotiation context
- Only 9 days on market — expect competitive offers; lowballing is unlikely to land.
- 3 sale attempts since 21y ago; this cycle's ask is 145% above the opening price — seller raised mid-cycle; expect resistance to lowballs.
- Current owner paid $210k; 28% above their basis — modest negotiation headroom, anchor on the comps not their cost.
Risks & watch-outs
- Climate carrying-cost: extreme-heat days projected 7→15/yr by 2055 (HVAC capex compounding) — expect insurance premiums to compound above CPI over the hold.
Questions for the listing agent
- Built in 1960 — when were the roof, HVAC, electrical panel, plumbing, and water heater last replaced?
- Is there a deadline driving the sale (1031 exchange, divorce, estate, relocation)? That informs how much negotiation room exists.
- Schools are F-rated, which usually means shorter tenancies and higher turnover. Who's the typical renter profile here, and what's been the actual vacancy rate?
- Crime grade is F in this area — have there been break-ins, vandalism, or insurance claims at this property in the last 3 years? What carrier currently insures it and at what premium?
- What's the average days-on-market for RENTAL listings here right now (not sales)? A rising rental-DOM trend means longer vacancies and softer asking-rent achievability than the comps imply.
- What's the recent tenant-quality profile in this submarket — average credit score on applications, eviction rate, late-payment / NSF rate, and stable-employment percentage? A property-management company in the area should have these aggregated.
- How much new for-sale + rental construction is in the pipeline within 1–3 miles? Heavy new supply typically softens prices + rents 12–24 months out; constrained supply supports both.
Investment metrics
- 1% rule
- 1.06% ✓
- Cap rate
- 7.50%
- Cash-on-cash
- 4.31%
- DSCR
- 1.19
- GRM
- 7.9
CMA / ARV
- ARV (on-the-fly)
- $403,312
- Comps found
- 12
Show comp detail 12 sales within ~0.75 mi
| Address | Dist | Beds/Ba | Sqft | Sold | Price | $/sf | Match |
|---|---|---|---|---|---|---|---|
| 609 Cedarleaf Ave | 0.12mi | 3/1.5 (-1) | 1,320 (-9%) | 2mo | $350,000 | $265 | 72 |
| 1022 Carrington Ave | 0.40mi | 4/2.5 | 1,400 (-4%) | 2mo | $340,000 | $243 | 69 |
| 7204 G St | 0.13mi | 3/2.0 (-1) | 1,320 (-9%) | 8mo | $365,000 | $277 | 64 |
| 705 71st Ave | 0.18mi | 3/1.5 (-1) | 1,255 (-14%) | 1mo | $339,000 | $270 | 63 |
| 828 Booker Pl | 0.33mi | 3/1.5 (-1) | 1,566 (+8%) | 10mo | $297,000 | $190 | 58 |
| 6313 Morocco St | 0.43mi | 4/2.0 | 1,632 (+12%) | 11mo | $340,000 | $208 | 49 |
| 107 Thomasson Ct | 0.69mi | 3/3.0 (-1) | 1,416 (-3%) | 8mo | $430,000 | $304 | 46 |
| 6958 Aquamarine Ct | 0.60mi | 4/3.0 | 1,320 (-9%) | 10mo | $396,000 | $300 | 42 |
| 6820 Jade Ct | 0.54mi | 4/3.5 | 1,300 (-11%) | 10mo | $395,000 | $304 | 41 |
| 913 Flores St | 0.43mi | 3/2.5 (-1) | 1,248 (-14%) | 12mo | $345,000 | $276 | 37 |
| 961 Central Hills Ln | 0.56mi | 3/3.5 (-1) | 1,240 (-15%) | 10mo | $390,000 | $315 | 27 |
| 830 Alabaster Ct | 0.70mi | 3/3.5 (-1) | 1,280 (-12%) | 9mo | $389,000 | $304 | 27 |
Match score weights: distance 35% · size 25% · config 20% · recency 20%. Top-matched comps best support the ARV.
Projected returns pro-forma
-3.0% appreciation · 5.9% rent growth · sell at horizon
- IRR
- -6.1%
- Equity multiple
- 0.77×
- Total profit
- $-17,679
- Equity at exit
- $40,109
- IRR
- 6.9%
- Equity multiple
- 1.59×
- Total profit
- $44,531
- Equity at exit
- $23,258
Cash invested: $75,320 (down + closing). Projections, not guarantees.
Landlord ↔ Tenant lean methodology
- Overall (STATE)
- 27 Tenant-Leaning
- State Maryland
- 27 Tenant-Leaning · D+14
- County
- — inherits STATE
- City
- — inherits STATE
ZIP-level market 20743
- Rents YoY
- 5.9%
- Active inventory
- 215
- Price-to-rent
- 7.9×
Monthly cashflow live
- Estimated rent
- $2,849 high interval (Pro) →
- Mortgage (P&I)
- −$1,411
- Tax from tax record
- −$457 /mo · $5,484/yr
- Insurance
- −$112
- HOA
- −$0
- Vacancy / Maint / Mgmt
- −$598
- Net cashflow
- $271
Break-even live
Sensitivity live
| Price | -10% $423 | -5% $347 | +0% $271 | +5% $195 | +10% $118 |
|---|---|---|---|---|---|
| Rent | -10% $46 | -5% $158 | +0% $271 | +5% $383 | +10% $496 |
| Rate | -1.0pp $406 | -0.5pp $339 | base $271 | +0.5pp $201 | +1.0pp $130 |
UW: 25.0% down · 7.5% · 30yr · 1.5% tax · 5.0% vac · 8.0% maint · 8.0% mgmt
Financing live
Cash to close
- Down payment
- $67,250
- Closing costs
- $8,070
- Reserves months
- —
- Total cash needed
- —
Loan-product check · same deal, 3 products live
Conventional
25% down · 7.5% · 30yr
- Down + closing
- —
- Monthly P&I
- —
- Monthly cashflow
- —
- DSCR
- —
- Eligible?
- —
Personal DTI + credit; lowest rate.
DSCR
20% down · 8.5% · 30yr
- Down + closing
- —
- Monthly P&I
- —
- Monthly cashflow
- —
- DSCR
- —
- Eligible?
- —
No personal income docs; deal must DSCR.
Hard money
10% down · 12.0% · 12mo
- Down + closing
- —
- Monthly P&I
- —
- Monthly cashflow
- —
- DSCR
- —
- Eligible?
- —
Short-term bridge; refi at stabilization.
Rent comps 39 comps
| Address | Beds | Baths | Sqft | Rent | $/sqft | DOM | Units | Dist |
|---|---|---|---|---|---|---|---|---|
| 522 70th St Capitol Heights, MD | 4.0 | 1.5 | 1840 | $3,000 | $1.63 | 4d | 1 | 0.30mi |
| 522 70th St Capitol Heights, MD | 4.0 | 1.5 | 1820 | $3,000 | $1.65 | 44d | 1 | 0.30mi |
| 903 Glen Willow Dr Capitol Heights, MD | 2.0–3.0 | 1.0 | 885 | $2,115 | $2.39 | 0d | 3 | 0.38mi |
| 505 69th St Capitol Heights, MD | 3.0 | 2.0 | 1000 | $2,500 | $2.50 | 19d | 1 | 0.41mi |
| 1105 Carrington Ave Capitol Heights, MD | 3.0 | 1.5 | 1152 | $2,395 | $2.08 | 3d | 1 | 0.44mi |
| 1105 Carrington Ave Capitol Heights, MD | 3.0 | 1.5 | 1152 | $2,400 | $2.08 | 44d | 1 | 0.44mi |
| 6801 James Farmer Way Capitol Heights, MD | 3.0 | 1.5 | 1512 | $2,150 | $1.42 | 19d | 1 | 0.51mi |
| 6313 Field St Capitol Heights, MD | 3.0 | 2.0 | 1700 | $2,250 | $1.32 | 19d | 1 | 0.55mi |
| 6706 Central Hills Ter Hyattsville, MD | 3.0 | 2.5 | 1212 | $2,500 | $2.06 | 44d | 1 | 0.59mi |
| 6221 Addison Rd Capitol Heights, MD | 3.0 | 1.5 | 1554 | $3,000 | $1.93 | 19d | 1 | 0.60mi |
| 818 Balsamtree Pl Capitol Heights, MD | 4.0 | 1.5 | 1102 | $2,275 | $2.06 | 6d | 1 | 0.63mi |
| 6812 Pepper St Capitol Heights, MD | 4.0 | 2.0 | 1095 | $2,750 | $2.51 | 44d | 1 | 0.68mi |
| 6340 Southern Ave NE Washington, DC | 4.0 | 2.0 | 1248 | $4,200 | $3.37 | 25d | 1 | 0.69mi |
| 323 62nd St NE Washington, DC | 1.0–3.0 | 1.0–2.0 | 908 | $2,435 | $2.68 | 25d | 1 | 0.75mi |
| 1105 61st Ave Fairmount Heights, MD | 4.0 | 3.5 | 1352 | $2,500 | $1.85 | 19d | 1 | 0.84mi |
| 6005 Eads St NE Apt 1 Washington, DC | 5.0 | 3.0 | 1750 | $6,100 | $3.49 | 25d | 1 | 0.85mi |
| 324 61st St NE Unit 7 Washington, DC | 5.0 | 2.0 | 1250 | $7,000 | $5.60 | 25d | 1 | 0.85mi |
| 805 Eastern Ave Fairmount Heights, MD | 4.0 | 2.0 | 936 | $2,400 | $2.56 | 6d | 1 | 1.06mi |
| 7290 Mahogany Dr Hyattsville, MD | 3.0 | 2.5 | 1300 | $2,400 | $1.85 | 5d | 1 | 1.07mi |
| 809 Eastern Ave Fairmount Heights, MD | 3.0 | 2.0 | 1246 | $2,400 | $1.93 | 6d | 1 | 1.07mi |
| 17 Quire Ave Capitol Heights, MD | 5.0 | 2.0 | 1300 | $2,850 | $2.19 | 44d | 1 | 1.10mi |
| 416 Topeka Ave Unit A Capitol Heights, MD | 3.0 | 2.0 | 1170 | $2,800 | $2.39 | 44d | 1 | 1.11mi |
| 520 56th St NE Washington, DC | 5.0 | 2.0 | 1670 | $5,500 | $3.29 | 25d | 1 | 1.18mi |
| 22 Chamber Ave Capitol Heights, MD | 3.0 | 1.0 | 942 | $3,000 | $3.18 | 44d | 1 | 1.19mi |
| 5501 Jay St NE Washington, DC | 4.0 | 3.0 | 1848 | $3,300 | $1.79 | 25d | 1 | 1.20mi |
| 1842 Ryderwood Ct Hyattsville, MD | 4.0 | 3.5 | 1680 | $3,199 | $1.90 | 19d | 1 | 1.21mi |
| 1746 Countrywood Ct Hyattsville, MD | 3.0 | 2.5 | 1296 | $2,450 | $1.89 | 12d | 1 | 1.25mi |
| 1741 Countrywood Ct Hyattsville, MD | 3.0 | 2.0 | 1312 | $2,295 | $1.75 | 25d | 1 | 1.27mi |
| 5338 Jay St NE Washington, DC | 3.0 | 1.5 | 1000 | $2,795 | $2.79 | 25d | 1 | 1.30mi |
| 337 54th St NE Unit A Washington, DC | 3.0 | 1.5 | 1184 | $2,850 | $2.41 | 25d | 1 | 1.31mi |
| 7626 Green Willow Ct Hyattsville, MD | 4.0 | 3.0 | 1220 | $2,850 | $2.34 | 19d | 1 | 1.35mi |
| 7425 Drumlea Rd Capitol Heights, MD | 4.0 | 3.5 | 1394 | $2,500 | $1.79 | 44d | 1 | 1.38mi |
| 1846 Cedarwood Ct Hyattsville, MD | 3.0 | 2.5 | 1120 | $2,150 | $1.92 | 44d | 1 | 1.41mi |
| 5213 Just St NE Washington, DC | 3.0 | 2.0 | 1114 | $2,400 | $2.15 | 25d | 1 | 1.41mi |
| 113 56th St SE Washington, DC | 3.0 | 2.0 | 1764 | $3,000 | $1.70 | 13d | 1 | 1.42mi |
| 5539 Central Ave SE Washington, DC | 3.0 | 2.0 | 1140 | $2,300 | $2.02 | 23d | 1 | 1.42mi |
| 7727 Swan Ter Hyattsville, MD | 3.0 | 2.5 | 1700 | $2,200 | $1.29 | 18d | 1 | 1.43mi |
| 5347 Ames St NE Washington, DC | 3.0 | 2.0 | 1428 | $3,000 | $2.10 | 25d | 1 | 1.45mi |
| 4802 Leroy Gorham Dr Capitol Heights, MD | 4.0 | 3.5 | 1482 | $3,500 | $2.36 | 4d | 1 | 1.49mi |
Listing history 10 events
-
2026-06-21days on market $269,000 Active 9 DOM
-
2026-06-18days on market $269,000 Active 6 DOM
-
2026-06-17days on market $269,000 Active 5 DOM
-
2026-06-16days on market $269,000 Active 4 DOM
-
2026-06-15days on market $269,000 Active 3 DOM
-
2026-06-13statusdays on market $269,000 Active 1 DOM
-
2026-06-10days on market $269,000 Coming Soon 4 DOM
-
2026-06-08days on market $269,000 Coming Soon 3 DOM
-
2026-06-07remarks 693-char remark
-
2026-06-07$269,000 Coming Soon 2 DOM
ⓘ Source: listings_history table (triggers on properties + properties_extension) + one-shot
backfill from property_details.listing_events for pre-trigger history.
Tax reassessment forecast MD · Partial reset (capped growth)
- Current annual tax
- $5,484 · $457/mo
- Projected year-2 tax
- $5,484 · $457/mo
- Expected delta
- $0/yr ($0/mo · 0.0%)
ⓘ Screening estimate from a state-policy table — verify with the county assessor before closing.
Climate risk First Street
- Flood 4/10 Moderate FEMA zone X (unshaded) · 22% chance over 30 yrs
- Wildfire 1/10 Low
- Heat 8/10 Severe 7 d/yr ≥103°F today · 15 d/yr by 30 yrs out
- Wind 4/10 Moderate 23% chance of damaging wind over 30 yrs
- Air quality 4/10 Moderate 4 unhealthy d/yr today · 5 by 30 yrs out
Nearby sold comps map
Loading sold comps map…
Walkable amenities ~0.75 mi
Loading nearby amenities…
Taxation est. · year 1
- Rental income
- $34,184
- − Mortgage interest
- −$15,068
- − Property taxes
- −$5,484
- − Insurance
- −$1,345
- − Repairs & maintenance
- −$2,735
- − Management
- −$2,735
- − Depreciation
- −$7,825
- Taxable loss
- −$1,008
- Est. tax savings @ 24.0%
- +$242
- After-tax cash flow
- $3,490/yr
For passive investors: Depreciation is non-cash, so a rental often shows a tax loss while cash-flowing — sheltering income. Rental losses are passive: they offset passive income freely, and up to $25,000/yr can offset ordinary (W-2) income if you actively participate and your MAGI is under $100k (phasing out to $0 by $150k); unused losses carry forward. On sale, claimed depreciation is recaptured at up to 25%, and gains may owe capital-gains tax (a 1031 exchange can defer both). Figures are a year-1 estimate at your 24.0% rate — not tax advice; consult a CPA.
Schools (NCES district)
- District
- Prince George'S County Public Schools
- NCES district ID
- 2400510
- Math proficiency
- 8% ▼ -11.00%
- Reading proficiency
- 24% ▼ -9.00%
- Median HH income
- $73,967
- Composite
- 16.82/100
- National rank
- #9151
- State rank
- #21 of 24 in MD
Livability — Seat Pleasant
- Score
- 63/100
- State rank
- #301
- US rank
- #15765
Category grades
Schools grade is shown separately in the Schools card above.
Census & demographics
- Census place
- Seat Pleasant, MD
- County
- Prince Georges County · 919,866 people
- Metro
- Washington-Arlington-Alexandria, DC-VA-MD-WV
- Population (ZIP)
- 41,093
- Household income
- $76,466
- Rent vs Own
- Severe rent burden
- 1418.0
Population outlook (Prince George's County) Hauer SSP2
- Today (2025)
- 1,005,426 people
- By 2030
- 1,048,416 · +4.3%
- By 2040
- 1,123,425 · +11.7%
- By 2050
- 1,183,220 · +17.7%
- By 2075
- 1,306,202 · +29.9%
- By 2100
- 1,408,179 · +40.1%
Race, ethnicity, and origin ACS 2023
- Neighborhood character
- Predominantly Black (78%)
- Race & ethnicity
- Black 78% Hispanic / Latino 16% Two or more races 4% White 3% Asian 1%
- Hispanic origin (detail)
- Mexican 2% Puerto Rican 2%
- Foreign-born
- 16% · Canada
- Languages at home
- 81% English-only · Spanish 13% French/Haitian/Cajun 1%
Political lean MEDSL · Prince George's
- 2024 margin
- Solid D (+75.2) · D 86.3% · R 11.2% · Other 2.5%
- 2008→2024 swing
- -3.3pp toward R · 2008: 78.5pp · 2024: 75.2pp
- All cycles
- 2024: D+75.2 2020: D+80.5 2016: D+81.0 2012: D+80.9 2008: D+78.5
Not yet ingested
- Civics
- —
Market trends
- HPI YoY
- ▼ -311.97%
- Current HPI
- 335.5152
- Rent YoY
- ▲ 5.90%
- Metro
- Washington-Arlington-Alexandria, DC-VA-MD-WV
- State GDP YoY
- ▲ 2.97%
- F500 in state
- 12
Industry mix (Fortune 500 HQ in MD)
| Industry | F500 HQs | Revenue |
|---|---|---|
| Aerospace / Defense | 1 | $71B |
|
||
| Utilities | 1 | $25B |
|
||
| Hotels | 1 | $24B |
|
||
| Consumer Goods | 1 | $7B |
|
||
| Real Estate | 1 | $6B |
|
||
| Chemicals | 1 | $2B |
|
||
Price history
+1635.5% since first listed13 events — show timeline
- 2026-06-06 Coming Soon $269,000 BRIGHT MLS
- 2010-09-04 Delisted — MRIS
- 2010-09-04 Listing Removed — BRIGHT MLS
- 2010-04-06 Price Changed — MRIS
- 2010-03-12 Price Changed — MRIS
- 2010-01-31 Price Changed — MRIS
- 2010-01-04 Listed — MRIS
- 2010-01-04 Listed $110,000 BRIGHT MLS
- 2006-01-23 Sold (Public Records) $210,000 Public Records
- 2005-11-28 Sold (MLS) $210,000 MRIS
- 2005-11-01 Delisted — MRIS
- 2005-09-21 Listed $210,000 MRIS
- 1964-08-14 Sold (Public Records) $15,500 Public Records
Property tax history
+6.5%/yrLatest (2025): $5,484 · +6.4% YoY. Source: county tax records.
Cash-flow waterfall
monthlySold comps — $/sqft
last 12 mo · ≤1 miLoading sold comps…