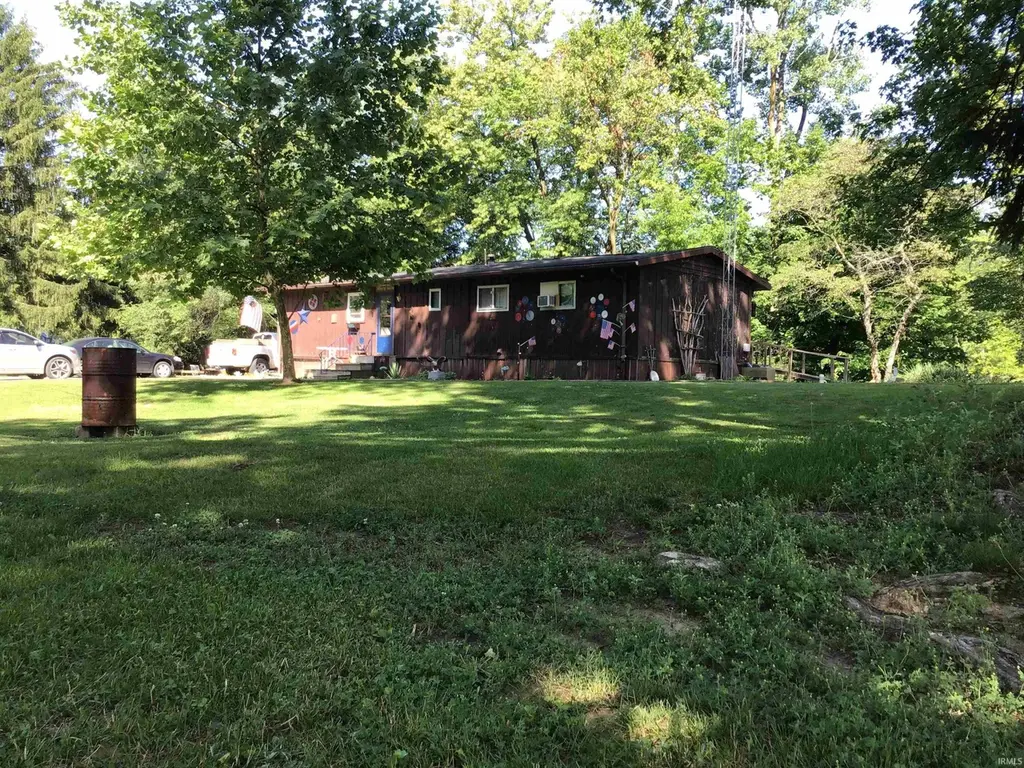
2338 E Tanner Ln · Winamac, IN
Flood risk 1/10 · Minimal
- FEMA flood zone
- X (unshaded)
- Chance of flooding over 30 yrs
- 0.0%
- Est. flood insurance / yr
- $507 – $1,088
Fire risk 1/10 · Minimal
- Est. fire insurance / yr
- $717 – $1,331
Heat risk 2/10 · Minimal
- Hot days now (above 101°F)
- 7 days/yr
- Hot days in 30 yrs
- 16 days/yr
Wind risk 2/10 · Minimal
- Chance of severe wind over 30 yrs
- —
Air-quality risk 2/10 · Minimal
- Unhealthy air days now
- 1 days/yr
- Unhealthy air days in 30 yrs
- 2 days/yr
Risk factors via First Street. Map © Google.
Why this score? — see what drove the D+ grade
The composite is a weighted blend of 9 inputs, each scored 0–100. Each bar is that input's sub-score; the figure is the points it added to the 100-point composite (weight × sub-score).
- Cash flow +19.3/30.0
- ARV discount +7.5/15.0
- DSCR +6.1/10.0
- 1% rule +5.1/10.0
- Livability +3.5/5.0
- Schools +2.6/10.0
- Rent growth +2.5/5.0
- Condition / age +2.5/5.0
- Appreciation +0.0/10.0
$125,000
🖨 Deal sheet 📄 Offer letter ✓ Due diligence
Listing remarks MLS
4 - 5 bedroom 2 bath manufactured home on the Tippecanoe river near Winamac. This home is situated a dead-end road on 2 100ft lots of high-bank wooded frontage w/ easy in and easy out access !! Updates include roof, deep well & extra bedrooms. 1.5 car attached garage. CASH/CONVENTIONAL BUYERS ONLY
Key facts
- 0.46 acre lot
- Garage
- Built 1973
Neighborhood map
What this means for you Summary
Snapshot
- This is a 4-bed/1.5-bath single-family listed at $125k.
Deal economics
- At list price, monthly cash flow is $137 ($2k/yr) — positive.
- The deal already cash-flows at list — no discount required.
- Meets the 1% rule at list price ($1k rent vs $125k).
- Recommended offer: $110k (12.0% below list) — sets the bar for market timing.
Location & tenants
- Location reads 69/100 on livability (#194 in IN) — a middle-class / working-renter tenant base. Strengths: crime A+, cost of living A+, housing A+; Watch: schools C-, amenities F, commute F.
- Culver Community Schools Corporation (rural): math 27% / reading 35% proficiency, ranked #236 of 301 in IN (top 78%) — families likely to look elsewhere, expect single-tenant / working-renter base with shorter leases.
- Market conditions: 10 active listings in the ZIP; 25 units permitted in Pulaski County in 2024 (0 in 5+ unit buildings).
Forward outlook
- Local home prices are declining (-3.0%/yr); year-one equity from $864 of loan paydown is wiped out by about $4k of value loss. Plan a longer hold.
- Pulaski County population projected at -23% by 2050 — secular population decline; favor cash flow + early exit over multi-decade hold.
Negotiation context
- It's been on market 361 days — a 12% lower offer ($110k) is reasonable based on typical stale-listing flexibility.
- 9 sale attempts since 24y ago; this cycle's ask has dropped $15k (11%) from the opening price — seller is motivated, your offer sets the floor, not the list.
Questions for the listing agent
- It's been on market 361 days. Have you received any prior offers? Is the seller open to a 12% concession, seller financing, or rate buy-down credit?
- Built in 1973 — when were the roof, HVAC, electrical panel, plumbing, and water heater last replaced?
- Why hasn't it sold? Are there any deal-killer items the seller is aware of (foundation, flood, title, zoning, code violations)?
- Is there a deadline driving the sale (1031 exchange, divorce, estate, relocation)? That informs how much negotiation room exists.
- The area grade is low — what's the realistic commute time and amenity access for the typical tenant pool here? Any planned neighborhood developments (good or bad) we should know about?
- What's the average days-on-market for RENTAL listings here right now (not sales)? A rising rental-DOM trend means longer vacancies and softer asking-rent achievability than the comps imply.
- What's the recent tenant-quality profile in this submarket — average credit score on applications, eviction rate, late-payment / NSF rate, and stable-employment percentage? A property-management company in the area should have these aggregated.
- How much new for-sale + rental construction is in the pipeline within 1–3 miles? Heavy new supply typically softens prices + rents 12–24 months out; constrained supply supports both.
Investment metrics
- 1% rule
- 1.01% ✓
- Cap rate
- 7.61%
- Cash-on-cash
- 4.71%
- DSCR
- 1.21
- GRM
- 8.2
CMA / ARV
No comps found within radius.
Projected returns pro-forma
-3.0% appreciation · 3.0% rent growth · sell at horizon
- IRR
- -8.9%
- Equity multiple
- 0.67×
- Total profit
- $-11,481
- Equity at exit
- $18,638
- IRR
- 0.6%
- Equity multiple
- 1.04×
- Total profit
- $1,354
- Equity at exit
- $10,808
Cash invested: $35,000 (down + closing). Projections, not guarantees.
Landlord ↔ Tenant lean methodology
- Overall (STATE)
- 90 Strongly Landlord-Friendly
- State Indiana
- 90 Strongly Landlord-Friendly · R+11
- County
- — inherits STATE
- City
- — inherits STATE
ZIP-level market 46996
- Home prices YoY
- -31.8%
- Active inventory
- 10
- Price-to-rent
- 8.2×
Monthly cashflow live
- Estimated rent
- $1,267 medium interval (Pro) →
- Mortgage (P&I)
- −$656
- Tax est. 1.5%
- −$156 /mo · $1,875/yr
- Insurance
- −$52
- HOA
- −$0
- Vacancy / Maint / Mgmt
- −$266
- Net cashflow
- $137
Break-even live
UW: 25.0% down · 7.5% · 30yr · 1.5% tax · 5.0% vac · 8.0% maint · 8.0% mgmt
Financing live
Cash to close
- Down payment
- $31,250
- Closing costs
- $3,750
- Reserves months
- —
- Total cash needed
- —
Loan-product check · same deal, 3 products live
Conventional
25% down · 7.5% · 30yr
- Down + closing
- —
- Monthly P&I
- —
- Monthly cashflow
- —
- DSCR
- —
- Eligible?
- —
Personal DTI + credit; lowest rate.
DSCR
20% down · 8.5% · 30yr
- Down + closing
- —
- Monthly P&I
- —
- Monthly cashflow
- —
- DSCR
- —
- Eligible?
- —
No personal income docs; deal must DSCR.
Hard money
10% down · 12.0% · 12mo
- Down + closing
- —
- Monthly P&I
- —
- Monthly cashflow
- —
- DSCR
- —
- Eligible?
- —
Short-term bridge; refi at stabilization.
Listing history 32 events
-
2026-06-19days on market $125,000 Active 361 DOM
-
2026-06-18days on market $125,000 Active 360 DOM
-
2026-06-17days on market $125,000 Active 359 DOM
-
2026-06-16days on market $125,000 Active 358 DOM
-
2026-06-15days on market $125,000 Active 357 DOM
-
2026-06-14days on market $125,000 Active 355 DOM
-
2026-06-12days on market $125,000 Active 354 DOM
-
2026-06-09days on market $125,000 Active 351 DOM
-
2026-06-08days on market $125,000 Active 350 DOM
-
2026-06-07days on market $125,000 Active 349 DOM
-
2026-06-07days on market $125,000 Active 348 DOM
-
2026-06-02days on market $125,000 Active 344 DOM
-
2026-06-01days on market $125,000 Active 343 DOM
-
2026-05-31days on market $125,000 Active 342 DOM
-
2026-05-30days on market $125,000 Active 341 DOM
-
2025-09-04price $125,000 304-char remark
Show marketing remark (304 chars)
4 - 5 bedroom 2 bath manufactured home on the Tippecanoe river near Winamac. This home is situated a dead-end road on 2 100ft lots of high-bank wooded frontage w/ easy in and easy out access !! Updates include roof, deep well & extra bedrooms. 1.5 car attached garage. CASH/CONVENTIONAL BUYERS ONLY
-
2025-06-23$140,000 Active 304-char remark
Show marketing remark (304 chars)
4 - 5 bedroom 2 bath manufactured home on the Tippecanoe river near Winamac. This home is situated a dead-end road on 2 100ft lots of high-bank wooded frontage w/ easy in and easy out access !! Updates include roof, deep well & extra bedrooms. 1.5 car attached garage. CASH/CONVENTIONAL BUYERS ONLY
-
2024-02-28historical
-
2014-09-09historical
-
2014-09-09historical
-
2014-09-09historical
-
2014-09-09historical
-
2012-01-28$64,000
-
2012-01-28$64,000
-
2011-08-16historical
-
2011-02-25$67,900
-
2011-02-15historical
-
2010-08-14$67,900
-
2010-02-14$67,900
-
2008-08-28$56,900
-
2002-03-21$59,900
-
2002-02-21$59,900
ⓘ Source: listings_history table (triggers on properties + properties_extension) + one-shot
backfill from property_details.listing_events for pre-trigger history.
Climate risk First Street
- Flood 1/10 Low FEMA zone X (unshaded) · 0% chance over 30 yrs
- Wildfire 1/10 Low
- Heat 2/10 Low 7 d/yr ≥101°F today · 16 d/yr by 30 yrs out
- Wind 2/10 Low
- Air quality 2/10 Low 1 unhealthy d/yr today · 2 by 30 yrs out
Nearby sold comps map
Loading sold comps map…
Walkable amenities ~0.75 mi
Loading nearby amenities…
Taxation est. · year 1
- Rental income
- $15,210
- − Mortgage interest
- −$7,002
- − Property taxes
- −$1,875
- − Insurance
- −$625
- − Repairs & maintenance
- −$1,217
- − Management
- −$1,217
- − Depreciation
- −$3,636
- Taxable loss
- −$362
- Est. tax savings @ 24.0%
- +$87
- After-tax cash flow
- $1,736/yr
For passive investors: Depreciation is non-cash, so a rental often shows a tax loss while cash-flowing — sheltering income. Rental losses are passive: they offset passive income freely, and up to $25,000/yr can offset ordinary (W-2) income if you actively participate and your MAGI is under $100k (phasing out to $0 by $150k); unused losses carry forward. On sale, claimed depreciation is recaptured at up to 25%, and gains may owe capital-gains tax (a 1031 exchange can defer both). Figures are a year-1 estimate at your 24.0% rate — not tax advice; consult a CPA.
Schools (NCES district)
- District
- Culver Community Schools Corporation
- NCES district ID
- 1802520
- Math proficiency
- 27% ▼ -9.00%
- Reading proficiency
- 35% ▼ -5.00%
- Median HH income
- $43,718
- Composite
- 26.41/100
- National rank
- #7227
- State rank
- #236 of 301 in IN
Livability — Winamac
- Score
- 69/100
- State rank
- #194
- US rank
- #8790
Category grades
Schools grade is shown separately in the Schools card above.
Census & demographics
- Population (ZIP)
- 6,231
Population outlook (Pulaski County) Hauer SSP2
- Today (2025)
- 11,942 people
- By 2030
- 11,394 · -4.6%
- By 2040
- 10,274 · -14.0%
- By 2050
- 9,209 · -22.9%
- By 2075
- 7,182 · -39.9%
- By 2100
- 5,365 · -55.1%
Race, ethnicity, and origin ACS 2023
- Neighborhood character
- Predominantly White (91%)
- Race & ethnicity
- White 91% Two or more races 4% Hispanic / Latino 3%
- Common ancestry
- Iranian 3% Romanian 3% Slovak 2%
- Foreign-born
- 4% · Canada, South Korea
- Languages at home
- 96% English-only · Spanish 3%
Political lean MEDSL · Pulaski
- 2024 margin
- Solid R (+53.7) · D 22.2% · R 75.9% · Other 1.9%
- 2008→2024 swing
- -38.2pp toward R · 2008: -15.5pp · 2024: -53.7pp
- All cycles
- 2024: R+53.7 2020: R+47.9 2016: R+46.5 2012: R+27.2 2008: R+15.5
Not yet ingested
- Civics
- —
Market trends
- HPI YoY
- ▼ -106.99%
- Current HPI
- 229.9497
- Rent YoY
- —
- Metro
- —
- State GDP YoY
- ▲ 2.90%
- F500 in state
- 18
Industry mix (Fortune 500 HQ in IN)
| Industry | F500 HQs | Revenue |
|---|---|---|
| Industrial Machinery | 2 | $37B |
|
||
| Healthcare | 1 | $177B |
|
||
| Pharmaceuticals | 1 | $45B |
|
||
| Metals / Steel | 1 | $18B |
|
||
| Agriculture | 1 | $17B |
|
||
| Packaging | 1 | $12B |
|
||
Price history
+108.7% since first listed17 events — show timeline
- 2025-09-04 Price Changed $125,000 IRMLS
- 2025-06-23 Listed $140,000 IRMLS
- 2024-02-28 Listing Removed — NIRA MLS as Distributed by MLS Grid
- 2014-09-09 Listing Removed — NIRA MLS as Distributed by MLS Grid
- 2014-09-09 Listing Removed — NIRA MLS as Distributed by MLS Grid
- 2014-09-09 Listing Removed — NIRA MLS as Distributed by MLS Grid
- 2014-09-09 Listing Removed — NIRA MLS as Distributed by MLS Grid
- 2012-01-28 Listed $64,000 NIRA MLS as Distributed by MLS Grid
- 2012-01-28 Listed $64,000 NIRA MLS as Distributed by MLS Grid
- 2011-08-16 Listing Removed — NIRA MLS as Distributed by MLS Grid
- 2011-02-25 Listed $67,900 NIRA MLS as Distributed by MLS Grid
- 2011-02-15 Listing Removed — NIRA MLS as Distributed by MLS Grid
- 2010-08-14 Listed $67,900 NIRA MLS as Distributed by MLS Grid
- 2010-02-14 Listed $67,900 NIRA MLS as Distributed by MLS Grid
- 2008-08-28 Listed $56,900 NIRA MLS as Distributed by MLS Grid
- 2002-03-21 Listed $59,900 NIRA MLS as Distributed by MLS Grid
- 2002-02-21 Listed $59,900 NIRA MLS as Distributed by MLS Grid
Property tax history
+8.3%/yrLatest (2024): $138 · +8.0% YoY. Source: county tax records.
Cash-flow waterfall
monthlySold comps — $/sqft
last 12 mo · ≤1 miLoading sold comps…