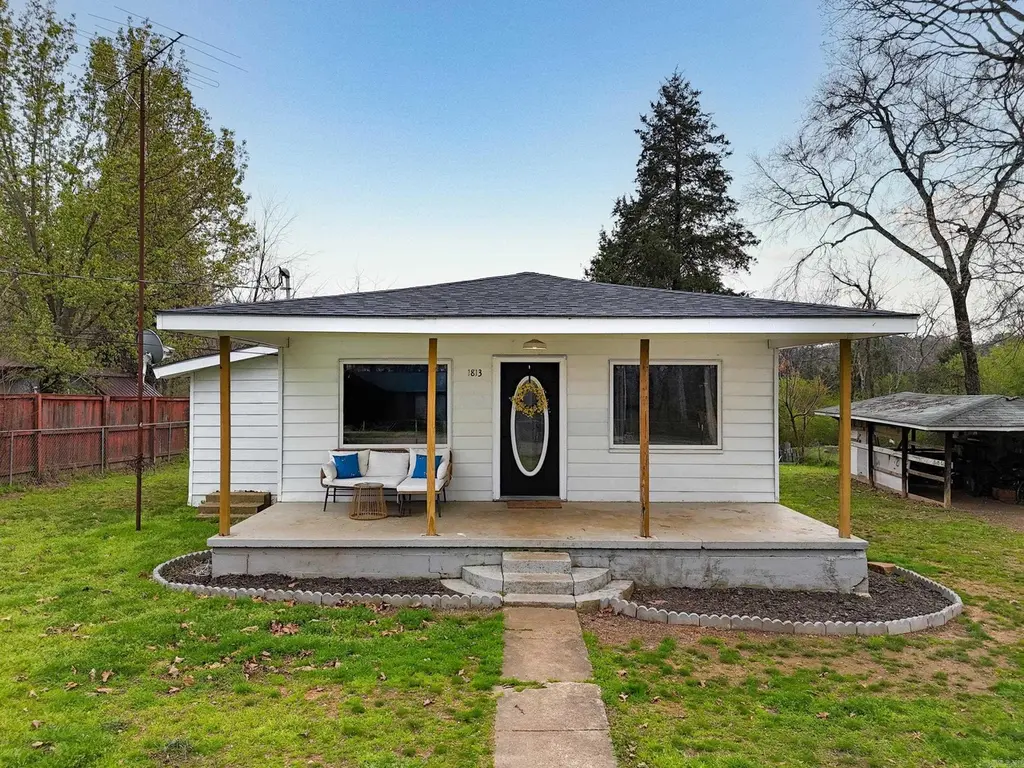
1813 Ford Dr · Clarksville, AR
Flood risk 1/10 · Minimal
- FEMA flood zone
- X (unshaded)
- Chance of flooding over 30 yrs
- 0.0%
- Est. flood insurance / yr
- $507 – $1,088
Fire risk 5/10 · Moderate
- Est. fire insurance / yr
- $1,499 – $2,785
Heat risk 6/10 · Moderate
- Hot days now (above 112°F)
- 7 days/yr
- Hot days in 30 yrs
- 20 days/yr
Wind risk 2/10 · Minimal
- Chance of severe wind over 30 yrs
- 2.0%
Air-quality risk 1/10 · Minimal
- Unhealthy air days now
- 0 days/yr
- Unhealthy air days in 30 yrs
- 0 days/yr
Risk factors via First Street. Map © Google.
Why this score? — see what drove the D grade
The composite is a weighted blend of 9 inputs, each scored 0–100. Each bar is that input's sub-score; the figure is the points it added to the 100-point composite (weight × sub-score).
- Cash flow +20.6/30.0
- DSCR +6.5/10.0
- 1% rule +4.1/10.0
- Livability +3.2/5.0
- Schools +2.6/10.0
- Rent growth +2.5/5.0
- Condition / age +2.5/5.0
- ARV discount +0.0/15.0
- Appreciation +0.0/10.0
$144,900
🖨 Deal sheet (PDF) 📄 Offer letter ✓ Due diligence
Listing remarks MLS
Beautifully kept and maintained, this 3 bedroom home has all the charm and warmth that anyone could ask for. The LARGE backyard offers room to grow, play, or grill and the entire property is completely fenced on all sides for your pets/kids. The water lines were replaced 5 years ago and the HVAC was serviced just months ago and works beautifully. This would make a perfect forever home and is priced to sell! Give me a call today so see this gem.
Key facts
- Updated kitchen
- Cozy living areas
- Fully fenced yard
Tags
Neighborhood map
What this means for you Summary
Snapshot
- This is a 3-bed/1.0-bath single-family listed at $145k.
Deal economics
- At list price, monthly cash flow is $194 ($2k/yr) — positive.
- The deal already cash-flows at list — no discount required.
- To meet the 1% rule (rent ≥ 1% of price), the offer needs to be $132k (8.9% below list).
- Recommended offer: $132k (8.9% below list) — sets the bar for 1% rule.
- Cap rate 7.9% vs local median 4.6% in Clarksville — top-decile yield for the area; either an underpriced asset or a hidden risk that comps aren't pricing in. Stress-test before assuming the spread holds.
Location & tenants
- Location reads 65/100 on livability (#141 in AR) — a middle-class / working-renter tenant base. Strengths: cost of living A+, housing A+; Watch: schools D, crime D-, amenities F.
- Clarksville School District (town): math 29% / reading 34% proficiency, ranked #147 of 238 in AR (top 62%) — families likely to look elsewhere, expect single-tenant / working-renter base with shorter leases.
- Market conditions: 154 active listings in the ZIP; 12 units permitted in Johnson County in 2024 (0 in 5+ unit buildings).
Forward outlook
- Local home prices are declining (-3.0%/yr); year-one equity from $1k of loan paydown is wiped out by about $4k of value loss. Plan a longer hold.
- Johnson County population projected at +8% by 2050 — modest demand growth; plan on rents tracking national, not racing it.
Negotiation context
- It's been on market 15 days — a 2% lower offer ($143k) is reasonable based on typical stale-listing flexibility.
- 2 sale attempts since 2y ago with the ask held roughly flat each time — persistent listings suggest the price (not the market) is what's stuck; bring a comps-based counter.
- Current owner paid $100k; 45% above their basis — modest negotiation headroom, anchor on the comps not their cost.
Risks & watch-outs
- Climate carrying-cost: moderate wildfire risk; extreme-heat days projected 7→20/yr by 2055 (HVAC capex compounding) — expect insurance premiums to compound above CPI over the hold.
Questions for the listing agent
- Is there a deadline driving the sale (1031 exchange, divorce, estate, relocation)? That informs how much negotiation room exists.
- Schools are D-rated, which usually means shorter tenancies and higher turnover. Who's the typical renter profile here, and what's been the actual vacancy rate?
- Crime grade is D in this area — have there been break-ins, vandalism, or insurance claims at this property in the last 3 years? What carrier currently insures it and at what premium?
- The area grade is low — what's the realistic commute time and amenity access for the typical tenant pool here? Any planned neighborhood developments (good or bad) we should know about?
- What's the average days-on-market for RENTAL listings here right now (not sales)? A rising rental-DOM trend means longer vacancies and softer asking-rent achievability than the comps imply.
- What's the recent tenant-quality profile in this submarket — average credit score on applications, eviction rate, late-payment / NSF rate, and stable-employment percentage? A property-management company in the area should have these aggregated.
- How much new for-sale + rental construction is in the pipeline within 1–3 miles? Heavy new supply typically softens prices + rents 12–24 months out; constrained supply supports both.
Investment metrics
- 1% rule
- 0.91% ✗
- Cap rate
- 7.90%
- Cash-on-cash
- 5.73%
- DSCR
- 1.25
- GRM
- 9.1
CMA / ARV
- ARV (on-the-fly)
- $103,680
- Comps found
- 11
Show comp detail 11 sales within ~0.75 mi
| Address | Dist | Beds/Ba | Sqft | Sold | Price | $/sf | Match |
|---|---|---|---|---|---|---|---|
| 1807 Ford Dr | 0.04mi | 2/1.0 (-1) | 1,027 (-11%) | 7mo | $75,000 | $73 | 69 |
| 1906 W Main St | 0.19mi | 3/1.0 | 1,270 (+10%) | 13mo | $135,000 | $106 | 63 |
| 1320 Reynolds St | 0.58mi | 3/1.0 | 1,152 (0%) | 16mo | $79,250 | $69 | 60 |
| 1309 Reynolds St | 0.61mi | 3/1.0 | 1,092 (-5%) | 6mo | $31,000 | $28 | 58 |
| 108 Carlton Dr | 0.20mi | 3/1.0 | 1,000 (-13%) | 22mo | $99,000 | $99 | 50 |
| 208 Cemetery St | 0.68mi | 3/1.0 | 1,216 (+6%) | 23mo | $75,000 | $62 | 40 |
| 1209 W Walton St | 0.69mi | 3/1.0 | 1,296 (+12%) | 9mo | $126,500 | $98 | 40 |
| 210 Cemetery St St | 0.69mi | 2/1.0 (-1) | 1,054 (-8%) | 14mo | $95,000 | $90 | 37 |
| 1306 Reynolds St | 0.63mi | 3/2.0 | 1,300 (+13%) | 10mo | $173,000 | $133 | 37 |
| 307 Hayes St | 0.70mi | 2/1.0 (-1) | 1,232 (+7%) | 18mo | $110,000 | $89 | 36 |
| 1302 W Taylor St | 0.56mi | 3/2.5 | 1,300 (+13%) | 22mo | $134,500 | $103 | 28 |
Match score weights: distance 35% · size 25% · config 20% · recency 20%. Top-matched comps best support the ARV.
Projected returns pro-forma
-3.0% appreciation · 3.0% rent growth · sell at horizon
- IRR
- -7.5%
- Equity multiple
- 0.72×
- Total profit
- $-11,217
- Equity at exit
- $21,605
- IRR
- 2.0%
- Equity multiple
- 1.14×
- Total profit
- $5,820
- Equity at exit
- $12,528
Cash invested: $40,572 (down + closing). Projections, not guarantees.
Landlord ↔ Tenant lean methodology
- Overall (STATE)
- 92 Strongly Landlord-Friendly
- State Arkansas
- 92 Strongly Landlord-Friendly · R+14
- County
- — inherits STATE
- City
- — inherits STATE
ZIP-level market 72830
- Home prices YoY
- -11.5%
- Active inventory
- 154
- Price-to-rent
- 9.1×
Monthly cashflow live
- Estimated rent
- $1,320 medium interval (Pro) →
- Mortgage (P&I)
- −$760
- Tax from tax record
- −$29 /mo · $350/yr
- Insurance
- −$60
- HOA
- −$0
- Vacancy / Maint / Mgmt
- −$277
- Net cashflow
- $194
Break-even live
Sensitivity live
| Price | -10% $276 | -5% $235 | +0% $194 | +5% $153 | +10% $112 |
|---|---|---|---|---|---|
| Rent | -10% $89 | -5% $142 | +0% $194 | +5% $246 | +10% $298 |
| Rate | -1.0pp $267 | -0.5pp $231 | base $194 | +0.5pp $156 | +1.0pp $118 |
UW: 25.0% down · 7.5% · 30yr · 1.5% tax · 5.0% vac · 8.0% maint · 8.0% mgmt
Financing live
Cash to close
- Down payment
- $36,225
- Closing costs
- $4,347
- Reserves months
- —
- Total cash needed
- —
Loan-product check · same deal, 3 products live
Conventional
25% down · 7.5% · 30yr
- Down + closing
- —
- Monthly P&I
- —
- Monthly cashflow
- —
- DSCR
- —
- Eligible?
- —
Personal DTI + credit; lowest rate.
DSCR
20% down · 8.5% · 30yr
- Down + closing
- —
- Monthly P&I
- —
- Monthly cashflow
- —
- DSCR
- —
- Eligible?
- —
No personal income docs; deal must DSCR.
Hard money
10% down · 12.0% · 12mo
- Down + closing
- —
- Monthly P&I
- —
- Monthly cashflow
- —
- DSCR
- —
- Eligible?
- —
Short-term bridge; refi at stabilization.
Listing history 6 events
-
2026-04-06status Under Contract
-
2026-03-20$144,900 New Listing
-
2024-09-26soldstatus $100,000 448-char remark
Show marketing remark (448 chars)
Beautifully kept and maintained, this 3 bedroom home has all the charm and warmth that anyone could ask for. The LARGE backyard offers room to grow, play, or grill and the entire property is completely fenced on all sides for your pets/kids. The water lines were replaced 5 years ago and the HVAC was serviced just months ago and works beautifully. This would make a perfect forever home and is priced to sell! Give me a call today so see this gem.
-
2024-09-26soldstatus $100,000
Show marketing remark (448 chars)
Beautifully kept and maintained, this 3 bedroom home has all the charm and warmth that anyone could ask for. The LARGE backyard offers room to grow, play, or grill and the entire property is completely fenced on all sides for your pets/kids. The water lines were replaced 5 years ago and the HVAC was serviced just months ago and works beautifully. This would make a perfect forever home and is priced to sell! Give me a call today so see this gem.
-
2024-07-24$109,000 448-char remark
Show marketing remark (448 chars)
Beautifully kept and maintained, this 3 bedroom home has all the charm and warmth that anyone could ask for. The LARGE backyard offers room to grow, play, or grill and the entire property is completely fenced on all sides for your pets/kids. The water lines were replaced 5 years ago and the HVAC was serviced just months ago and works beautifully. This would make a perfect forever home and is priced to sell! Give me a call today so see this gem.
-
2006-09-20soldstatus $43,000
ⓘ Source: listings_history table (triggers on properties + properties_extension) + one-shot
backfill from property_details.listing_events for pre-trigger history.
Tax reassessment forecast AR · Resets to sale price
- Current annual tax
- $350 · $29/mo
- Projected year-2 tax
- $927 · $77/mo
- Expected delta
- +$578/yr (+$48/mo · 165.1%)
ⓘ Screening estimate from a state-policy table — verify with the county assessor before closing.
Climate risk First Street
- Flood 1/10 Low FEMA zone X (unshaded) · 0% chance over 30 yrs
- Wildfire 5/10 Major
- Heat 6/10 Major 7 d/yr ≥112°F today · 20 d/yr by 30 yrs out
- Wind 2/10 Low 2% chance of damaging wind over 30 yrs
- Air quality 1/10 Low 0 unhealthy d/yr today · 0 by 30 yrs out
Nearby sold comps map
Loading sold comps map…
Walkable amenities ~0.75 mi
Loading nearby amenities…
Taxation est. · year 1
- Rental income
- $15,844
- − Mortgage interest
- −$8,117
- − Property taxes
- −$350
- − Insurance
- −$724
- − Repairs & maintenance
- −$1,268
- − Management
- −$1,268
- − Depreciation
- −$4,215
- Taxable loss
- −$97
- Est. tax savings @ 24.0%
- +$23
- After-tax cash flow
- $2,348/yr
For passive investors: Depreciation is non-cash, so a rental often shows a tax loss while cash-flowing — sheltering income. Rental losses are passive: they offset passive income freely, and up to $25,000/yr can offset ordinary (W-2) income if you actively participate and your MAGI is under $100k (phasing out to $0 by $150k); unused losses carry forward. On sale, claimed depreciation is recaptured at up to 25%, and gains may owe capital-gains tax (a 1031 exchange can defer both). Figures are a year-1 estimate at your 24.0% rate — not tax advice; consult a CPA.
Schools (NCES district)
- District
- Clarksville School District
- NCES district ID
- 0504380
- Math proficiency
- 29% ▼ -16.00%
- Reading proficiency
- 34% ▼ -5.00%
- Median HH income
- $33,344
- Composite
- 25.84/100
- National rank
- #7352
- State rank
- #147 of 238 in AR
Livability — Clarksville
- Score
- 65/100
- State rank
- #141
- US rank
- #12572
Category grades
Schools grade is shown separately in the Schools card above.
Census & demographics
- Census place
- Clarksville, AR
- Population (ZIP)
- 15,962
Population outlook (Johnson County) Hauer SSP2
- Today (2025)
- 27,452 people
- By 2030
- 28,003 · +2.0%
- By 2040
- 28,960 · +5.5%
- By 2050
- 29,627 · +7.9%
- By 2075
- 31,000 · +12.9%
- By 2100
- 31,173 · +13.6%
Race, ethnicity, and origin ACS 2023
- Neighborhood character
- Predominantly White (71%)
- Race & ethnicity
- White 71% Hispanic / Latino 18% Two or more races 9% Asian 4% Black 2%
- Hispanic origin (detail)
- Mexican 17%
- Common ancestry
- Slovak 2% Iranian 1% Lithuanian 1%
- Foreign-born
- 12% · Canada, Philippines, Vietnam
- Languages at home
- 84% English-only · Spanish 12% Other Asian/Pacific 2% German/W. Germanic 1%
Political lean MEDSL · Johnson
- 2024 margin
- Solid R (+51.4) · D 23.3% · R 74.7% · Other 2.0%
- 2008→2024 swing
- -28.4pp toward R · 2008: -23.1pp · 2024: -51.4pp
- All cycles
- 2024: R+51.4 2020: R+49.0 2016: R+40.6 2012: R+28.0 2008: R+23.1
Not yet ingested
- Civics
- —
Market trends
- HPI YoY
- ▼ -24.36%
- Current HPI
- 187.5114
- Rent YoY
- —
- Metro
- —
- State GDP YoY
- ▲ 3.80%
- F500 in state
- 10
Industry mix (Fortune 500 HQ in AR)
| Industry | F500 HQs | Revenue |
|---|---|---|
| Retail | 1 | $681B |
|
||
| Food / Agriculture | 1 | $53B |
|
||
| Retail / Energy | 1 | $22B |
|
||
| Transportation / Logistics | 1 | $12B |
|
||
| Energy | 1 | $4B |
|
||
Price history
+237.0% since first listed6 events — show timeline
- 2026-04-06 Pending — CARMLS
- 2026-03-20 Listed $144,900 CARMLS
- 2024-09-26 Sold (Public Records) $100,000 Public Records
- 2024-09-26 Sold (MLS) $100,000 NWARMLS
- 2024-07-24 Listed $109,000 NWARMLS
- 2006-09-20 Sold (Public Records) $43,000 Public Records
Property tax history
+17.8%/yrLatest (2025): $350 · +6600.6% YoY. Source: county tax records.
Cash-flow waterfall
monthlySold comps — $/sqft
last 12 mo · ≤1 miLoading sold comps…