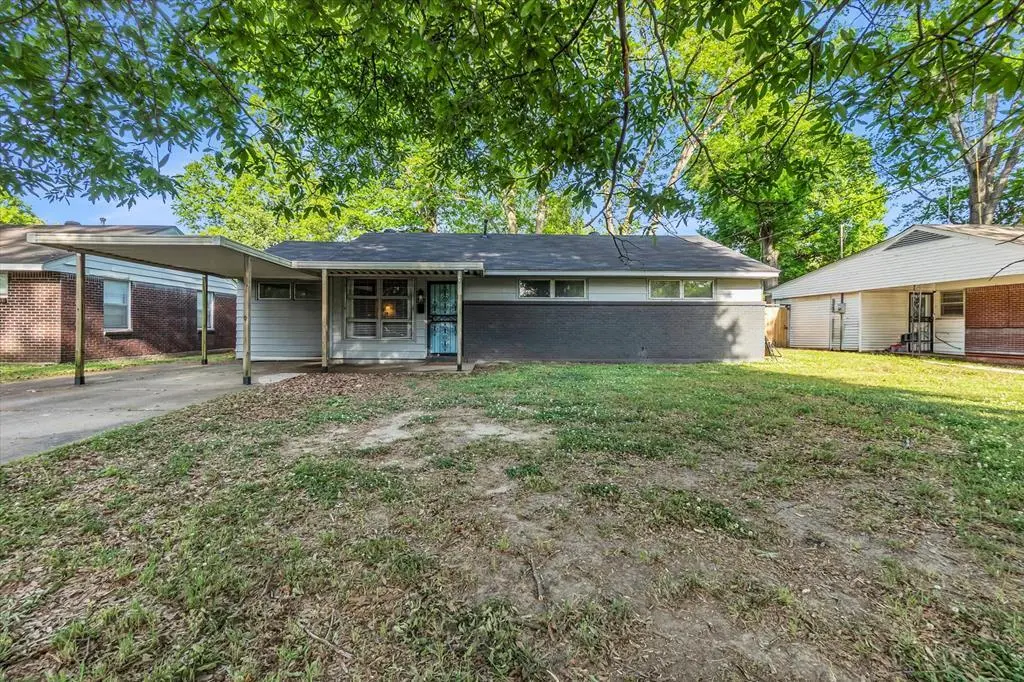
1025 Lehr St · West Memphis, AR
Flood risk 1/10 · Minimal
- FEMA flood zone
- X (shaded)
- Chance of flooding over 30 yrs
- 0.0%
- Est. flood insurance / yr
- $507 – $1,088
Fire risk 1/10 · Minimal
- Est. fire insurance / yr
- $1,499 – $2,785
Heat risk 7/10 · Major
- Hot days now (above 109°F)
- 7 days/yr
- Hot days in 30 yrs
- 21 days/yr
Wind risk 4/10 · Minor
- Chance of severe wind over 30 yrs
- 16.0%
Air-quality risk 2/10 · Minimal
- Unhealthy air days now
- 2 days/yr
- Unhealthy air days in 30 yrs
- 2 days/yr
Risk factors via First Street. Map © Google.
Why this score? — see what drove the D grade
The composite is a weighted blend of 9 inputs, each scored 0–100. Each bar is that input's sub-score; the figure is the points it added to the 100-point composite (weight × sub-score).
- Cash flow +19.0/30.0
- DSCR +6.0/10.0
- 1% rule +5.1/10.0
- ARV discount +3.2/15.0
- Livability +2.8/5.0
- Rent growth +2.5/5.0
- Condition / age +2.5/5.0
- Schools +1.2/10.0
- Appreciation +0.0/10.0
$148,900
🖨 Deal sheet (PDF) 📄 Offer letter ✓ Due diligence
Listing remarks MLS
Welcome to this well-maintained home offering space, comfort, and endless potential! Featuring very spacious rooms throughout, this property boasts a huge den plus a separate living room. .. perfect for entertaining, relaxing, or creating flexible living spaces to fit your needs. Enjoy the oversized laundry room, 1-car carport, and a large fenced backyard ideal for pets, gatherings, or outdoor enjoyment. Whether you're a first-time homebuyer looking for the perfect starter home or someone looking to downsize into your forever home, this property offers great bones, functionality, and charm. A solid home with plenty of room to grow and make your own!
Key facts
- Huge den
- Separate living room
- 8,275 sq ft lot
Tags
Neighborhood map
What this means for you Summary
Snapshot
- This is a 3-bed/1.0-bath single-family listed at $149k.
Deal economics
- At list price, monthly cash flow is $156 ($2k/yr) — positive.
- The deal already cash-flows at list — no discount required.
- Meets the 1% rule at list price ($2k rent vs $149k).
- Recommended offer: $140k (6.0% below list) — sets the bar for market timing.
Location & tenants
- Location reads 55/100 on livability (#413 in AR) — a working-class tenant base; expect higher turnover. Strengths: cost of living A+, housing A; Watch: crime F, amenities F, commute F.
- West Memphis School District (suburban): math 16% / reading 15% proficiency, ranked #224 of 238 in AR (top 94%) — low school quality limits family demand, transient renter base, plan for 1-2y turnover; 96% free/reduced lunch — lower-income household profile, screen leases tightly.
- Zoned schools: Richland Elementary School (math 43% / reading 22%, grade F, #277 of 454 statewide, top 61%, 528 students, 100% FRL); West Junior High School (math 19% / reading 25%, grade F, #175 of 201 statewide, top 88%, 507 students, 100% FRL); The Academies of West Memphis Charter School (math 7% / reading 22%, grade F, #265 of 292 statewide, top 91%, 952 students, 100% FRL, charter) — zoned schools at 100% FRL track the district average.
- Market conditions: 136 active listings in the ZIP; 1 comparable units currently listed for rent nearby; 69 units permitted in Crittenden County in 2024 (0 in 5+ unit buildings).
Forward outlook
- Local home prices are declining (-3.0%/yr); year-one equity from $1k of loan paydown is wiped out by about $4k of value loss. Plan a longer hold.
- Crittenden County population projected at -26% by 2050 — secular population decline; favor cash flow + early exit over multi-decade hold.
Negotiation context
- It's been on market 67 days — a 6% lower offer ($140k) is reasonable based on typical stale-listing flexibility.
- 3 sale attempts since 5y ago with the ask held roughly flat each time — persistent listings suggest the price (not the market) is what's stuck; bring a comps-based counter.
- Current owner paid $90k; list at $149k implies a 66% gain — meaningful room to come down on a strong offer.
Risks & watch-outs
- Watch-outs: built in 1955 — expect roof / HVAC / electrical / plumbing capex.
- Climate carrying-cost: extreme-heat days projected 7→21/yr by 2055 (HVAC capex compounding) — expect insurance premiums to compound above CPI over the hold.
Questions for the listing agent
- It's been on market 67 days. Have you received any prior offers? Is the seller open to a 6% concession, seller financing, or rate buy-down credit?
- Built in 1955 — when were the roof, HVAC, electrical panel, plumbing, and water heater last replaced?
- Why hasn't it sold? Are there any deal-killer items the seller is aware of (foundation, flood, title, zoning, code violations)?
- Is there a deadline driving the sale (1031 exchange, divorce, estate, relocation)? That informs how much negotiation room exists.
- Schools are D-rated, which usually means shorter tenancies and higher turnover. Who's the typical renter profile here, and what's been the actual vacancy rate?
- Crime grade is F in this area — have there been break-ins, vandalism, or insurance claims at this property in the last 3 years? What carrier currently insures it and at what premium?
- The area grade is low — what's the realistic commute time and amenity access for the typical tenant pool here? Any planned neighborhood developments (good or bad) we should know about?
- What's the average days-on-market for RENTAL listings here right now (not sales)? A rising rental-DOM trend means longer vacancies and softer asking-rent achievability than the comps imply.
- What's the recent tenant-quality profile in this submarket — average credit score on applications, eviction rate, late-payment / NSF rate, and stable-employment percentage? A property-management company in the area should have these aggregated.
- How much new for-sale + rental construction is in the pipeline within 1–3 miles? Heavy new supply typically softens prices + rents 12–24 months out; constrained supply supports both.
Investment metrics
- 1% rule
- 1.01% ✓
- Cap rate
- 7.55%
- Cash-on-cash
- 4.49%
- DSCR
- 1.20
- GRM
- 8.3
CMA / ARV
- ARV (median comp)
- $135,831
- List price
- $148,900
- Delta
- 9.62%
- Verdict
- FAIR
- Comps
- 20 within 1.0 mi
Show comp detail 12 sales within ~0.75 mi
| Address | Dist | Beds/Ba | Sqft | Sold | Price | $/sf | Match |
|---|---|---|---|---|---|---|---|
| 330 S Center Dr | 0.31mi | 3/1.0 | 1,240 (-2%) | 2mo | $165,000 | $133 | 82 |
| 714 Baylor Dr | 0.34mi | 3/2.0 | 1,285 (+2%) | 1mo | $169,900 | $132 | 76 |
| 1108 N Rich Rd | 0.31mi | 3/1.5 | 1,335 (+6%) | 2mo | $190,000 | $142 | 72 |
| 516 Highland Dr | 0.07mi | 3/1.0 | 1,103 (-12%) | 6mo | $155,000 | $141 | 71 |
| 814 Briarcliff Rd | 0.46mi | 3/2.0 | 1,242 (-1%) | 3mo | $168,000 | $135 | 70 |
| 1409 N Avalon St | 0.32mi | 3/1.5 | 1,172 (-7%) | 2mo | $164,900 | $141 | 70 |
| 1301 Crestmere St | 0.57mi | 3/2.0 | 1,283 (+2%) | 7mo | $185,000 | $144 | 61 |
| 1113 Spears St | 0.21mi | 3/1.5 | 1,076 (-15%) | 7mo | $136,250 | $127 | 58 |
| 208 S Center Dr | 0.58mi | 2/1.0 (-1) | 1,137 (-10%) | 0mo | $50,000 | $44 | 51 |
| 213 S Worthington Dr | 0.57mi | 3/2.0 | 1,375 (+9%) | 7mo | $169,900 | $124 | 49 |
| 1014 Balfour Rd | 0.73mi | 3/1.5 | 1,148 (-9%) | 4mo | $168,000 | $146 | 46 |
| 908 Roselawn Dr | 0.54mi | 3/2.0 | 1,442 (+14%) | 2mo | $90,000 | $62 | 45 |
Match score weights: distance 35% · size 25% · config 20% · recency 20%. Top-matched comps best support the ARV.
Projected returns pro-forma
-3.0% appreciation · 3.0% rent growth · sell at horizon
- IRR
- -9.3%
- Equity multiple
- 0.66×
- Total profit
- $-14,171
- Equity at exit
- $22,201
- IRR
- 0.2%
- Equity multiple
- 1.01×
- Total profit
- $545
- Equity at exit
- $12,874
Cash invested: $41,692 (down + closing). Projections, not guarantees.
Landlord ↔ Tenant lean methodology
- Overall (STATE)
- 92 Strongly Landlord-Friendly
- State Arkansas
- 92 Strongly Landlord-Friendly · R+14
- County
- — inherits STATE
- City
- — inherits STATE
ZIP-level market 72301
- Active inventory
- 136
- Price-to-rent
- 8.3×
Monthly cashflow live
- Estimated rent
- $1,500 medium interval (Pro) →
- Mortgage (P&I)
- −$781
- Tax est. 1.5%
- −$186 /mo · $2,234/yr
- Insurance
- −$62
- HOA
- −$0
- Vacancy / Maint / Mgmt
- −$315
- Net cashflow
- $156
Break-even live
Sensitivity live
| Price | -10% $259 | -5% $207 | +0% $156 | +5% $105 | +10% $53 |
|---|---|---|---|---|---|
| Rent | -10% $37 | -5% $97 | +0% $156 | +5% $215 | +10% $274 |
| Rate | -1.0pp $231 | -0.5pp $194 | base $156 | +0.5pp $117 | +1.0pp $78 |
UW: 25.0% down · 7.5% · 30yr · 1.5% tax · 5.0% vac · 8.0% maint · 8.0% mgmt
Financing live
Cash to close
- Down payment
- $37,225
- Closing costs
- $4,467
- Reserves months
- —
- Total cash needed
- —
Loan-product check · same deal, 3 products live
Conventional
25% down · 7.5% · 30yr
- Down + closing
- —
- Monthly P&I
- —
- Monthly cashflow
- —
- DSCR
- —
- Eligible?
- —
Personal DTI + credit; lowest rate.
DSCR
20% down · 8.5% · 30yr
- Down + closing
- —
- Monthly P&I
- —
- Monthly cashflow
- —
- DSCR
- —
- Eligible?
- —
No personal income docs; deal must DSCR.
Hard money
10% down · 12.0% · 12mo
- Down + closing
- —
- Monthly P&I
- —
- Monthly cashflow
- —
- DSCR
- —
- Eligible?
- —
Short-term bridge; refi at stabilization.
Rent comps 1 comps
| Address | Beds | Baths | Sqft | Rent | $/sqft | DOM | Units | Dist |
|---|---|---|---|---|---|---|---|---|
| 911 N Avalon St Unit Future applicants West Memphis, AR | 2.0 | 2.0 | 1057 | $1,500 | $1.42 | 0d | 1 | 0.25mi |
Listing history 26 events
-
2026-06-21days on market $148,900 Active 67 DOM
-
2026-06-18days on market $148,900 Active 64 DOM
-
2026-06-17days on market $148,900 Active 63 DOM
-
2026-06-16days on market $148,900 Active 62 DOM
-
2026-06-15days on market $148,900 Active 61 DOM
-
2026-06-13days on market $148,900 Active 59 DOM
-
2026-06-10days on market $148,900 Active 56 DOM
-
2026-06-09days on market $148,900 Active 55 DOM
-
2026-06-08days on market $148,900 Active 54 DOM
-
2026-06-07days on market $148,900 Active 53 DOM
-
2026-06-03days on market $148,900 Active 49 DOM
-
2026-06-02days on market $148,900 Active 48 DOM
-
2026-06-01days on market $148,900 Active 47 DOM
-
2026-05-31days on market $148,900 Active 46 DOM
-
2026-04-16$148,900 Active 657-char remark
Show marketing remark (657 chars)
Welcome to this well-maintained home offering space, comfort, and endless potential! Featuring very spacious rooms throughout, this property boasts a huge den plus a separate living room. .. perfect for entertaining, relaxing, or creating flexible living spaces to fit your needs. Enjoy the oversized laundry room, 1-car carport, and a large fenced backyard ideal for pets, gatherings, or outdoor enjoyment. Whether you're a first-time homebuyer looking for the perfect starter home or someone looking to downsize into your forever home, this property offers great bones, functionality, and charm. A solid home with plenty of room to grow and make your own!
-
2024-10-22price $119,900
-
2024-08-04price $124,900
-
2024-07-15price $129,900
-
2024-06-28price $135,000
-
2024-06-19price $145,000
-
2024-06-11price $150,000
-
2024-06-10$125,000 Active
-
2021-05-07soldstatus $89,900
-
2021-05-07soldstatus $89,900
-
2021-01-25$89,900
-
2005-11-21soldstatus $77,000
ⓘ Source: listings_history table (triggers on properties + properties_extension) + one-shot
backfill from property_details.listing_events for pre-trigger history.
Climate risk First Street
- Flood 1/10 Low FEMA zone X (shaded) · 0% chance over 30 yrs
- Wildfire 1/10 Low
- Heat 7/10 Severe 7 d/yr ≥109°F today · 21 d/yr by 30 yrs out
- Wind 4/10 Moderate 16% chance of damaging wind over 30 yrs
- Air quality 2/10 Low 2 unhealthy d/yr today · 2 by 30 yrs out
Nearby sold comps map
Loading sold comps map…
Walkable amenities ~0.75 mi
Loading nearby amenities…
Taxation est. · year 1
- Rental income
- $18,000
- − Mortgage interest
- −$8,341
- − Property taxes
- −$2,234
- − Insurance
- −$744
- − Repairs & maintenance
- −$1,440
- − Management
- −$1,440
- − Depreciation
- −$4,332
- Taxable loss
- −$530
- Est. tax savings @ 24.0%
- +$127
- After-tax cash flow
- $1,999/yr
For passive investors: Depreciation is non-cash, so a rental often shows a tax loss while cash-flowing — sheltering income. Rental losses are passive: they offset passive income freely, and up to $25,000/yr can offset ordinary (W-2) income if you actively participate and your MAGI is under $100k (phasing out to $0 by $150k); unused losses carry forward. On sale, claimed depreciation is recaptured at up to 25%, and gains may owe capital-gains tax (a 1031 exchange can defer both). Figures are a year-1 estimate at your 24.0% rate — not tax advice; consult a CPA.
Schools (NCES district)
- District
- West Memphis School District
- NCES district ID
- 0508040
- Math proficiency
- 16% ▼ -14.00%
- Reading proficiency
- 15% ▼ -14.00%
- Median HH income
- $29,382
- Composite
- 12.22/100
- National rank
- #9647
- State rank
- #224 of 238 in AR
Livability — West Memphis
- Score
- 55/100
- State rank
- #413
- US rank
- #23638
Category grades
Schools grade is shown separately in the Schools card above.
Census & demographics
- Census place
- West Memphis, AR
- City population
- 24,182
- Population (ZIP)
- 24,182
Population outlook (Crittenden County) Hauer SSP2
- Today (2025)
- 45,254 people
- By 2030
- 42,953 · -5.1%
- By 2040
- 38,235 · -15.5%
- By 2050
- 33,670 · -25.6%
- By 2075
- 24,315 · -46.3%
- By 2100
- 17,173 · -62.1%
Race, ethnicity, and origin ACS 2023
- Neighborhood character
- Majority Black (64%)
- Race & ethnicity
- Black 64% White 29% Two or more races 6% Hispanic / Latino 2%
- Common ancestry
- Serbian 1%
- Foreign-born
- 1% · Canada
- Languages at home
- 98% English-only · Spanish 1%
Political lean MEDSL · Crittenden
- 2024 margin
- Toss-up / Even · D 50.1% · R 47.9% · Other 2.0%
- 2008→2024 swing
- -12.4pp toward R · 2008: 14.7pp · 2024: 2.3pp
- All cycles
- 2024: D+2.3 2020: D+7.2 2016: D+9.0 2012: D+18.7 2008: D+14.7
Not yet ingested
- Civics
- —
Market trends
- HPI YoY
- ▼ -143.63%
- Current HPI
- 182.7665
- Rent YoY
- —
- Metro
- —
- State GDP YoY
- ▲ 3.80%
- F500 in state
- 10
Industry mix (Fortune 500 HQ in AR)
| Industry | F500 HQs | Revenue |
|---|---|---|
| Retail | 1 | $681B |
|
||
| Food / Agriculture | 1 | $53B |
|
||
| Retail / Energy | 1 | $22B |
|
||
| Transportation / Logistics | 1 | $12B |
|
||
| Energy | 1 | $4B |
|
||
Price history
+93.4% since first listed12 events — show timeline
- 2026-04-16 Listed $148,900 EARA
- 2024-10-22 Price Changed $119,900 EARA
- 2024-08-04 Price Changed $124,900 EARA
- 2024-07-15 Price Changed $129,900 EARA
- 2024-06-28 Price Changed $135,000 EARA
- 2024-06-19 Price Changed $145,000 EARA
- 2024-06-11 Price Changed $150,000 EARA
- 2024-06-10 Listed $125,000 EARA
- 2021-05-07 Sold (Public Records) $89,900 Public Records
- 2021-05-07 Sold (MLS) $89,900 EARA
- 2021-01-25 Listed $89,900 EARA
- 2005-11-21 Sold (Public Records) $77,000 Public Records
Property tax history
-9.5%/yrLatest (2025): $199 · -23.8% YoY. Source: county tax records.
Cash-flow waterfall
monthlySold comps — $/sqft
last 12 mo · ≤1 miLoading sold comps…