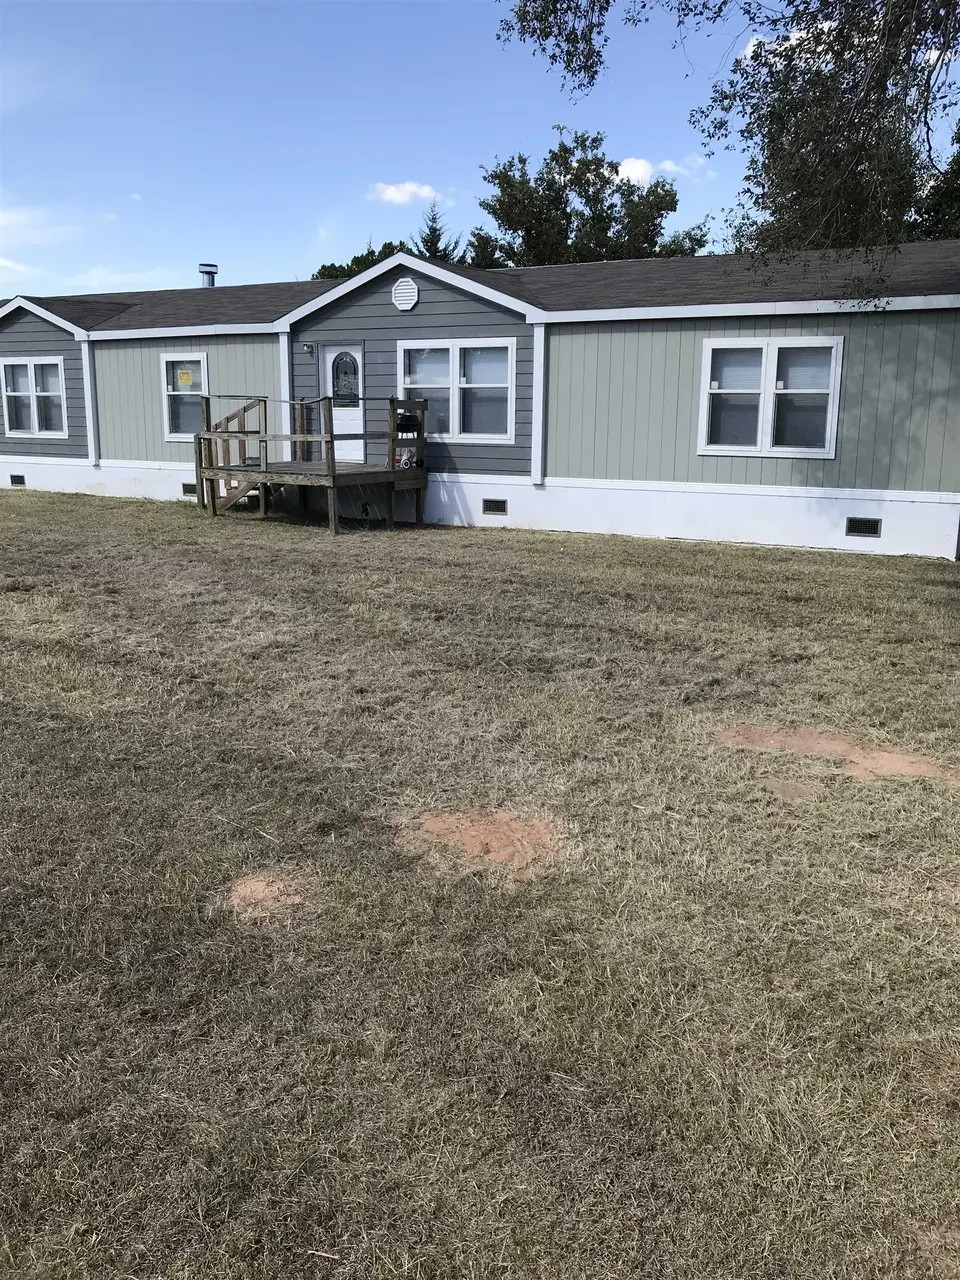
316 Avenue G · Beaver, OK
Flood risk 1/10 · Minimal
- FEMA flood zone
- X
- Chance of flooding over 30 yrs
- 0.0%
- Est. flood insurance / yr
- $508 – $851
Fire risk 4/10 · Minor
- Est. fire insurance / yr
- $2,463 – $4,575
Heat risk 5/10 · Moderate
- Hot days now (above threshold)
- 7 days/yr
- Hot days in 30 yrs
- 20 days/yr
Wind risk No data
- Chance of severe wind over 30 yrs
- —
Air-quality risk No data
- Unhealthy air days now
- —
- Unhealthy air days in 30 yrs
- —
Risk factors via First Street. Map © Google.
Why this score? — see what drove the B grade
The composite is a weighted blend of 9 inputs, each scored 0–100. Each bar is that input's sub-score; the figure is the points it added to the 100-point composite (weight × sub-score).
- Cash flow +29.2/30.0
- DSCR +10.0/10.0
- 1% rule +8.0/10.0
- Appreciation +7.6/10.0
- ARV discount +7.5/15.0
- Livability +3.3/5.0
- Schools +3.1/10.0
- Rent growth +2.5/5.0
- Condition / age +2.5/5.0
$99,900
🖨 Deal sheet (PDF) 📄 Offer letter ✓ Due diligence
Listing remarks
Owner will finance for 20 years with 10%down at 7% interest.
Key facts
- 0.24 acre lot
- 2 garage spots
- Built 2014
Property features AI
Exterior
- Parking: Detached 2-car garage
- Utilities: Public water; Public sewer
- Home design: South-facing; Single-story; Mobile home (residential, mobile home with real property)
- Construction: Wood siding
- Exterior features: Composition roof; Accessible entrance; Shed(s); Workshop; Lot approximately 75 x 140; Subdivision: Original town
Interior
- Kitchen: Microwave
- Bathrooms: 2 full bathrooms; 1 half bathroom
- Heating & cooling: Central heating; Electric heating; Natural gas heating; Central air conditioning; Ceiling fans
- Interior features: Window coverings; Fireplace (1)
Neighborhood map
What this means for you Summary
Snapshot
- This is a 4-bed/2.0-bath manufactured listed at $100k.
Deal economics
- At list price, monthly cash flow is $349 ($4k/yr) — positive.
- The deal already cash-flows at list — no discount required.
- Meets the 1% rule at list price ($1k rent vs $100k).
- Recommended offer: $97k (3.0% below list) — sets the bar for market timing.
Location & tenants
- Location reads 66/100 on livability (#126 in OK) — a middle-class / working-renter tenant base. Strengths: cost of living A+, housing A+, crime A-; Watch: health & safety C-, schools D-, amenities F.
- Beaver (rural): math 30% / reading 35% proficiency, ranked #214 of 513 in OK (top 42%) — families likely to look elsewhere, expect single-tenant / working-renter base with shorter leases.
- Market conditions: 16 active listings in the ZIP.
Forward outlook
- In year one you build about $6k of equity ($691 loan paydown + $5k appreciation (5.2% local appreciation)).
- Beaver County population projected at +3% by 2050 — modest demand growth; plan on rents tracking national, not racing it.
- At projected returns (5.2% appreciation + 3.0% rent growth), your $28k cash investment doubles in ~3 years — after that, you're playing with house money.
- By year 6, paydown + projected appreciation supports a ~$31k cash-out refi (75% LTV) — recoverable capital for the next deal without selling this one.
Negotiation context
- It's been on market 47 days — a 3% lower offer ($97k) is reasonable based on typical stale-listing flexibility.
Risks & watch-outs
- Climate carrying-cost: extreme-heat days projected 7→20/yr by 2055 (HVAC capex compounding) — expect insurance premiums to compound above CPI over the hold.
Questions for the listing agent
- It's been on market 47 days. Have you received any prior offers? Is the seller open to a 3% concession, seller financing, or rate buy-down credit?
- Is there a deadline driving the sale (1031 exchange, divorce, estate, relocation)? That informs how much negotiation room exists.
- Schools are D-rated, which usually means shorter tenancies and higher turnover. Who's the typical renter profile here, and what's been the actual vacancy rate?
- What's the average days-on-market for RENTAL listings here right now (not sales)? A rising rental-DOM trend means longer vacancies and softer asking-rent achievability than the comps imply.
- What's the recent tenant-quality profile in this submarket — average credit score on applications, eviction rate, late-payment / NSF rate, and stable-employment percentage? A property-management company in the area should have these aggregated.
- How much new for-sale + rental construction is in the pipeline within 1–3 miles? Heavy new supply typically softens prices + rents 12–24 months out; constrained supply supports both.
Investment metrics
- 1% rule
- 1.30% ✓
- Cap rate
- 10.48%
- Cash-on-cash
- 14.96%
- DSCR
- 1.67
- GRM
- 6.4
CMA / ARV
No comps found within radius.
Projected returns pro-forma
5.16% appreciation · 3.0% rent growth · sell at horizon
- IRR
- 26.1%
- Equity multiple
- 2.65×
- Total profit
- $46,151
- Equity at exit
- $57,566
- IRR
- 25.1%
- Equity multiple
- 5.29×
- Total profit
- $119,935
- Equity at exit
- $100,148
Cash invested: $27,972 (down + closing). Projections, not guarantees.
Landlord ↔ Tenant lean methodology
- Overall (STATE)
- 83 Strongly Landlord-Friendly
- State Oklahoma
- 83 Strongly Landlord-Friendly · R+20
- County
- — inherits STATE
- City
- — inherits STATE
ZIP-level market 73932
- Home prices YoY
- 4.0%
- Active inventory
- 16
- Price-to-rent
- 6.4×
Monthly cashflow live
- Estimated rent
- $1,299 medium interval (Pro) →
- Mortgage (P&I)
- −$524
- Tax from tax record
- −$112 /mo · $1,344/yr
- Insurance
- −$42
- HOA
- −$0
- Vacancy / Maint / Mgmt
- −$273
- Net cashflow
- $349
Break-even live
Sensitivity live
| Price | -10% $405 | -5% $377 | +0% $349 | +5% $321 | +10% $292 |
|---|---|---|---|---|---|
| Rent | -10% $246 | -5% $298 | +0% $349 | +5% $400 | +10% $451 |
| Rate | -1.0pp $399 | -0.5pp $374 | base $349 | +0.5pp $323 | +1.0pp $297 |
UW: 25.0% down · 7.5% · 30yr · 1.5% tax · 5.0% vac · 8.0% maint · 8.0% mgmt
Financing live
Cash to close
- Down payment
- $24,975
- Closing costs
- $2,997
- Reserves months
- —
- Total cash needed
- —
Loan-product check · same deal, 3 products live
Conventional
25% down · 7.5% · 30yr
- Down + closing
- —
- Monthly P&I
- —
- Monthly cashflow
- —
- DSCR
- —
- Eligible?
- —
Personal DTI + credit; lowest rate.
DSCR
20% down · 8.5% · 30yr
- Down + closing
- —
- Monthly P&I
- —
- Monthly cashflow
- —
- DSCR
- —
- Eligible?
- —
No personal income docs; deal must DSCR.
Hard money
10% down · 12.0% · 12mo
- Down + closing
- —
- Monthly P&I
- —
- Monthly cashflow
- —
- DSCR
- —
- Eligible?
- —
Short-term bridge; refi at stabilization.
Listing history 17 events
-
2026-06-21days on market $99,900 Active 47 DOM
-
2026-06-21days on market $99,900 Active 46 DOM
-
2026-06-18days on market $99,900 Active 44 DOM
-
2026-06-17days on market $99,900 Active 43 DOM
-
2026-06-16days on market $99,900 Active 42 DOM
-
2026-06-15days on market $99,900 Active 41 DOM
-
2026-06-13days on market $99,900 Active 39 DOM
-
2026-06-12days on market $99,900 Active 38 DOM
-
2026-06-09days on market $99,900 Active 35 DOM
-
2026-06-08days on market $99,900 Active 34 DOM
-
2026-06-08days on market $99,900 Active 33 DOM
-
2026-06-05days on market $99,900 Active 31 DOM
-
2026-06-04days on market $99,900 Active 29 DOM
-
2026-06-02days on market $99,900 Active 28 DOM
-
2026-06-01days on market $99,900 Active 27 DOM
-
2026-05-31days on market $99,900 Active 26 DOM
-
2026-05-05$99,900 Active
ⓘ Source: listings_history table (triggers on properties + properties_extension) + one-shot
backfill from property_details.listing_events for pre-trigger history.
Tax reassessment forecast OK · Resets to sale price
- Current annual tax
- $1,344 · $112/mo
- Projected year-2 tax
- $1,344 · $112/mo
- Expected delta
- $0/yr ($0/mo · 0.0%)
ⓘ Screening estimate from a state-policy table — verify with the county assessor before closing.
Climate risk First Street
- Flood 1/10 Low FEMA zone X · 0% chance over 30 yrs
- Wildfire 4/10 Moderate
- Heat 5/10 Major
Nearby sold comps map
Loading sold comps map…
Walkable amenities ~0.75 mi
Loading nearby amenities…
Taxation est. · year 1
- Rental income
- $15,590
- − Mortgage interest
- −$5,596
- − Property taxes
- −$1,344
- − Insurance
- −$500
- − Repairs & maintenance
- −$1,247
- − Management
- −$1,247
- − Depreciation
- −$2,906
- Taxable income
- $2,750
- Est. tax owed @ 24.0%
- −$660
- After-tax cash flow
- $3,526/yr
For passive investors: Depreciation is non-cash, so a rental often shows a tax loss while cash-flowing — sheltering income. Rental losses are passive: they offset passive income freely, and up to $25,000/yr can offset ordinary (W-2) income if you actively participate and your MAGI is under $100k (phasing out to $0 by $150k); unused losses carry forward. On sale, claimed depreciation is recaptured at up to 25%, and gains may owe capital-gains tax (a 1031 exchange can defer both). Figures are a year-1 estimate at your 24.0% rate — not tax advice; consult a CPA.
Schools (NCES district)
- District
- Beaver
- NCES district ID
- 4003750
- Math proficiency
- 30% ▬ 0.00%
- Reading proficiency
- 35% ▬ 0.00%
- Median HH income
- $46,714
- Composite
- 30.68/100
- National rank
- #11435
- State rank
- #214 of 513 in OK
Livability — Beaver
- Score
- 66/100
- State rank
- #126
- US rank
- #12291
Category grades
Schools grade is shown separately in the Schools card above.
Census & demographics
- Census place
- Beaver, OK
- Population (ZIP)
- 1,930
Population outlook (Beaver County) Hauer SSP2
- Today (2025)
- 5,381 people
- By 2030
- 5,465 · +1.6%
- By 2040
- 5,336 · -0.8%
- By 2050
- 5,561 · +3.3%
- By 2075
- 7,051 · +31.0%
- By 2100
- 9,341 · +73.6%
Race, ethnicity, and origin ACS 2023
- Neighborhood character
- Predominantly White (68%)
- Race & ethnicity
- White 68% Hispanic / Latino 28% Two or more races 11%
- Hispanic origin (detail)
- Mexican 28%
- Common ancestry
- Iranian 1%
- Foreign-born
- 13% · Canada
- Languages at home
- 75% English-only · Spanish 24%
Political lean MEDSL · Beaver
- 2024 margin
- Solid R (+83.8) · D 7.4% · R 91.2% · Other 1.3%
- 2008→2024 swing
- -5.3pp toward R · 2008: -78.5pp · 2024: -83.8pp
- All cycles
- 2024: R+83.8 2020: R+81.6 2016: R+81.0 2012: R+78.9 2008: R+78.5
Not yet ingested
- Civics
- —
Market trends
- HPI YoY
- ▲ 5.16%
- Current HPI
- 135.2376
- Rent YoY
- —
- Metro
- —
- State GDP YoY
- ▲ 1.55%
- F500 in state
- 6
Industry mix (Fortune 500 HQ in OK)
| Industry | F500 HQs | Revenue |
|---|---|---|
| Energy | 3 | $48B |
|
||
Price history
1 event — show timeline
- 2026-05-05 Listed $99,900 NWOAR
Property tax history
+12.6%/yrLatest (2025): $1,344 · -0.6% YoY. Source: county tax records.
Cash-flow waterfall
monthlySold comps — $/sqft
last 12 mo · ≤1 miLoading sold comps…