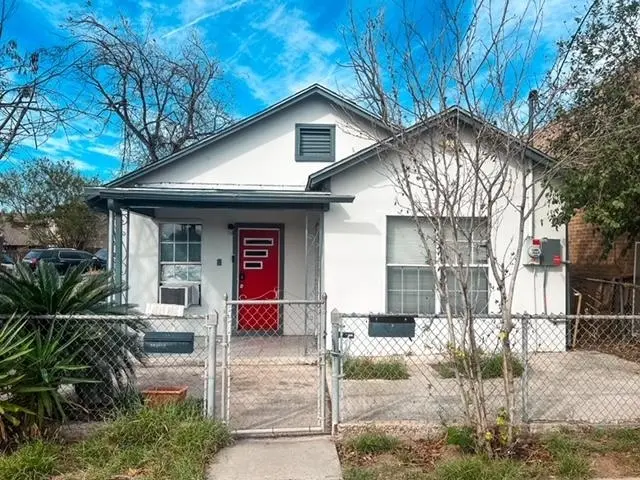
414 Houston St Frnt /rear · Laredo, TX
Flood risk 1/10 · Minimal
- FEMA flood zone
- X (unshaded)
- Chance of flooding over 30 yrs
- 0.0%
- Est. flood insurance / yr
- $507 – $1,088
Fire risk 4/10 · Minor
- Est. fire insurance / yr
- $1,222 – $2,270
Heat risk 8/10 · Major
- Hot days now (above 110°F)
- 7 days/yr
- Hot days in 30 yrs
- 23 days/yr
Wind risk 8/10 · Major
- Chance of severe wind over 30 yrs
- 80.0%
Air-quality risk 1/10 · Minimal
- Unhealthy air days now
- 0 days/yr
- Unhealthy air days in 30 yrs
- 0 days/yr
Risk factors via First Street. Map © Google.
Why this score? — see what drove the C grade
The composite is a weighted blend of 9 inputs, each scored 0–100. Each bar is that input's sub-score; the figure is the points it added to the 100-point composite (weight × sub-score).
- Cash flow +21.5/30.0
- ARV discount +7.5/15.0
- Appreciation +7.5/10.0
- DSCR +6.9/10.0
- 1% rule +5.7/10.0
- Livability +3.7/5.0
- Rent growth +2.5/5.0
- Condition / age +2.2/5.0
- Schools +2.0/10.0
$129,900
🖨 Deal sheet (PDF) 📄 Offer letter ✓ Due diligence
Listing remarks MLS
Excellent investment opportunity! Two homes in one lot, centrally located and in close proximity to the downtown historic district. 1952 Charm, front home with 738 sqft. Living room, 2 bedrooms w 1 bath and kitchenette. Laundry area. SOLAR PANELS to be assumed by buyer. 1 note at $196 p month. 1995 Separate back home with 665 sqft, Living room, 2 bedrooms w 1bath and kitchen/dining area. SOLAR PANELS assigned to each house, great savings!
Key facts
- Two homes in one lot
- Laundry area
- Centrally located
Tags
Neighborhood map
What this means for you Summary
Snapshot
- This is a 2-bed/1.0-bath single-family listed at $130k. Condition is rated fair.
Deal economics
- At list price, monthly cash flow is $195 ($2k/yr) — positive.
- The deal already cash-flows at list — no discount required.
- Meets the 1% rule at list price ($1k rent vs $130k).
- Recommended offer: $114k (12.0% below list) — sets the bar for market timing.
- Cap rate 8.1% vs local median 4.1% in Laredo — top-decile yield for the area; either an underpriced asset or a hidden risk that comps aren't pricing in. Stress-test before assuming the spread holds.
Location & tenants
- Location reads 73/100 on livability (#227 in TX) — a middle-class / working-renter tenant base. Strengths: cost of living A+, housing A+, health & safety A+; Watch: schools C-, crime C-, employment D+.
- Laredo ISD (urban): math 21% / reading 29% proficiency, ranked #739 of 826 in TX (top 90%) — low school quality limits family demand, transient renter base, plan for 1-2y turnover; 82% free/reduced lunch — lower-income household profile, screen leases tightly.
- Market conditions: 68 active listings in the ZIP; 5 comparable units currently listed for rent nearby; rentals lingering (median 45d on market — plan ~5-8 weeks vacancy on turnover, expect pricing pressure); 100% of comp listings sitting > 30 days — soft ceiling on asking rent; 1,448 units permitted in Webb County in 2024 (245 in 5+ unit buildings).
Forward outlook
- In year one you build about $7k of equity ($898 loan paydown + $6k appreciation (4.9% local appreciation)).
- Webb County population projected at +23% by 2050 — long-run rental-demand tailwind backs the buy-and-hold thesis.
- At projected returns (4.9% appreciation + 3.0% rent growth), your $36k cash investment doubles in ~4 years — after that, you're playing with house money.
- By year 5, paydown + projected appreciation supports a ~$32k cash-out refi (75% LTV) — recoverable capital for the next deal without selling this one.
Negotiation context
- It's been on market 491 days — a 12% lower offer ($114k) is reasonable based on typical stale-listing flexibility.
Risks & watch-outs
- Watch-outs: built in 1952 — expect roof / HVAC / electrical / plumbing capex.
- Climate carrying-cost: severe wind risk, 80% chance of damaging wind over 30y; extreme-heat days projected 7→23/yr by 2055 (HVAC capex compounding) — expect insurance premiums to compound above CPI over the hold.
Questions for the listing agent
- It's been on market 491 days. Have you received any prior offers? Is the seller open to a 12% concession, seller financing, or rate buy-down credit?
- Have any recent inspections been done? Can we get a copy of the seller's disclosures and any deferred-maintenance estimates?
- Built in 1952 — when were the roof, HVAC, electrical panel, plumbing, and water heater last replaced?
- Why hasn't it sold? Are there any deal-killer items the seller is aware of (foundation, flood, title, zoning, code violations)?
- Is there a deadline driving the sale (1031 exchange, divorce, estate, relocation)? That informs how much negotiation room exists.
- What's the average days-on-market for RENTAL listings here right now (not sales)? A rising rental-DOM trend means longer vacancies and softer asking-rent achievability than the comps imply.
- What's the recent tenant-quality profile in this submarket — average credit score on applications, eviction rate, late-payment / NSF rate, and stable-employment percentage? A property-management company in the area should have these aggregated.
- How much new for-sale + rental construction is in the pipeline within 1–3 miles? Heavy new supply typically softens prices + rents 12–24 months out; constrained supply supports both.
Investment metrics
- 1% rule
- 1.07% ✓
- Cap rate
- 8.10%
- Cash-on-cash
- 6.44%
- DSCR
- 1.29
- GRM
- 7.8
CMA / ARV
- ARV (median comp)
- $85,000
- List price
- $129,900
- Delta
- 52.82%
- Verdict
- OVERPRICED
- Comps
- 1 within 2.0 mi
Projected returns pro-forma
4.93% appreciation · 3.0% rent growth · sell at horizon
- IRR
- 18.2%
- Equity multiple
- 2.15×
- Total profit
- $41,866
- Equity at exit
- $73,047
- IRR
- 18.3%
- Equity multiple
- 4.19×
- Total profit
- $116,127
- Equity at exit
- $125,603
Cash invested: $36,372 (down + closing). Projections, not guarantees.
Landlord ↔ Tenant lean methodology
- Overall (STATE)
- 87 Strongly Landlord-Friendly
- State Texas
- 87 Strongly Landlord-Friendly · R+5
- County
- — inherits STATE
- City
- — inherits STATE
ZIP-level market 78040
- Home prices YoY
- 3.9%
- Active inventory
- 68
- Price-to-rent
- 7.8×
Monthly cashflow live
- Estimated rent
- $1,384 high interval (Pro) →
- Mortgage (P&I)
- −$681
- Tax est. 1.5%
- −$162 /mo · $1,948/yr
- Insurance
- −$54
- HOA
- −$0
- Vacancy / Maint / Mgmt
- −$291
- Net cashflow
- $195
Break-even live
Sensitivity live
| Price | -10% $285 | -5% $240 | +0% $195 | +5% $150 | +10% $106 |
|---|---|---|---|---|---|
| Rent | -10% $86 | -5% $141 | +0% $195 | +5% $250 | +10% $305 |
| Rate | -1.0pp $261 | -0.5pp $228 | base $195 | +0.5pp $162 | +1.0pp $127 |
UW: 25.0% down · 7.5% · 30yr · 1.5% tax · 5.0% vac · 8.0% maint · 8.0% mgmt
Financing live
Cash to close
- Down payment
- $32,475
- Closing costs
- $3,897
- Reserves months
- —
- Total cash needed
- —
Loan-product check · same deal, 3 products live
Conventional
25% down · 7.5% · 30yr
- Down + closing
- —
- Monthly P&I
- —
- Monthly cashflow
- —
- DSCR
- —
- Eligible?
- —
Personal DTI + credit; lowest rate.
DSCR
20% down · 8.5% · 30yr
- Down + closing
- —
- Monthly P&I
- —
- Monthly cashflow
- —
- DSCR
- —
- Eligible?
- —
No personal income docs; deal must DSCR.
Hard money
10% down · 12.0% · 12mo
- Down + closing
- —
- Monthly P&I
- —
- Monthly cashflow
- —
- DSCR
- —
- Eligible?
- —
Short-term bridge; refi at stabilization.
Rent comps 5 comps
| Address | Beds | Baths | Sqft | Rent | $/sqft | DOM | Units | Dist |
|---|---|---|---|---|---|---|---|---|
| 1319 Stone Ave Laredo, TX | 2.0 | 1.0 | 918 | $1,250 | $1.36 | 44d | 1 | 0.70mi |
| 1702 Cortez St Laredo, TX | 3.0 | 2.0 | 1628 | $1,700 | $1.04 | 44d | 1 | 1.31mi |
| 216 N Meadow Ave Unit 1 Laredo, TX | 3.0 | 2.0 | 960 | $1,300 | $1.35 | 44d | 1 | 1.34mi |
| 1718 Willow St Laredo, TX | 3.0 | 2.0 | 1705 | $1,350 | $0.79 | 44d | 1 | 1.38mi |
| 2016 Rosario St Laredo, TX | 3.0 | 1.0 | 1293 | $1,350 | $1.04 | 44d | 1 | 1.50mi |
Listing history 16 events
-
2026-06-21days on market $129,900 Active 491 DOM
-
2026-06-18days on market $129,900 Active 489 DOM
-
2026-06-17days on market $129,900 Active 488 DOM
-
2026-06-16days on market $129,900 Active 487 DOM
-
2026-06-15days on market $129,900 Active 486 DOM
-
2026-06-13days on market $129,900 Active 484 DOM
-
2026-06-12days on market $129,900 Active 483 DOM
-
2026-06-10days on market $129,900 Active 480 DOM
-
2026-06-08days on market $129,900 Active 479 DOM
-
2026-06-08days on market $129,900 Active 478 DOM
-
2026-06-07days on market $129,900 Active 477 DOM
-
2026-06-03days on market $129,900 Active 474 DOM
-
2026-06-02days on market $129,900 Active 473 DOM
-
2026-06-01days on market $129,900 Active 472 DOM
-
2026-05-31days on market $129,900 Active 471 DOM
-
2025-02-14$129,900 Active 442-char remark
Show marketing remark (442 chars)
Excellent investment opportunity! Two homes in one lot, centrally located and in close proximity to the downtown historic district. 1952 Charm, front home with 738 sqft. Living room, 2 bedrooms w 1 bath and kitchenette. Laundry area. SOLAR PANELS to be assumed by buyer. 1 note at $196 p month. 1995 Separate back home with 665 sqft, Living room, 2 bedrooms w 1bath and kitchen/dining area. SOLAR PANELS assigned to each house, great savings!
ⓘ Source: listings_history table (triggers on properties + properties_extension) + one-shot
backfill from property_details.listing_events for pre-trigger history.
Climate risk First Street
- Flood 1/10 Low FEMA zone X (unshaded) · 0% chance over 30 yrs
- Wildfire 4/10 Moderate
- Heat 8/10 Severe 7 d/yr ≥110°F today · 23 d/yr by 30 yrs out
- Wind 8/10 Severe 80% chance of damaging wind over 30 yrs
- Air quality 1/10 Low 0 unhealthy d/yr today · 0 by 30 yrs out
Nearby sold comps map
Loading sold comps map…
Walkable amenities ~0.75 mi
Loading nearby amenities…
Taxation est. · year 1
- Rental income
- $16,602
- − Mortgage interest
- −$7,276
- − Property taxes
- −$1,948
- − Insurance
- −$650
- − Repairs & maintenance
- −$1,328
- − Management
- −$1,328
- − Depreciation
- −$3,779
- Taxable income
- $293
- Est. tax owed @ 24.0%
- −$70
- After-tax cash flow
- $2,273/yr
For passive investors: Depreciation is non-cash, so a rental often shows a tax loss while cash-flowing — sheltering income. Rental losses are passive: they offset passive income freely, and up to $25,000/yr can offset ordinary (W-2) income if you actively participate and your MAGI is under $100k (phasing out to $0 by $150k); unused losses carry forward. On sale, claimed depreciation is recaptured at up to 25%, and gains may owe capital-gains tax (a 1031 exchange can defer both). Figures are a year-1 estimate at your 24.0% rate — not tax advice; consult a CPA.
Condition & rehab AI · 14 photos
The home requires moderate updates to its interior and exterior to improve its condition and value. Painting, updating cabinetry and fixtures, and landscaping improvements would significantly enhance its appeal.
Repairs flagged
- Minor Paint — Faded paint on interior walls and exterior
- Minor Flooring — Worn tile in living areas, carpet in bedrooms
- Minor Kitchen cabinets — Dated cabinetry, could be replaced for a fresh look
- Minor Bathroom fixtures — Basic fixtures, could be updated for a more modern look
Value-add opportunities
- Resale Painting and updating cabinetry in the kitchen — Fresh paint and updated cabinetry can significantly enhance the home's appeal
- Resale Updating bathroom fixtures and adding a modern vanity — Modernizing the bathroom can greatly improve the home's resale value
- Both Landscaping and curb appeal improvements — A well-maintained exterior can attract more buyers and renters
Renovation cost estimate screening
| Repair item | Severity | Est. cost |
|---|---|---|
| Paint · Faded paint on interior walls and exterior | Minor | $500–3,000 |
| Flooring · Worn tile in living areas, carpet in bedrooms | Minor | $500–3,000 |
| Kitchen cabinets · Dated cabinetry, could be replaced for a fresh look | Minor | $500–3,000 |
| Bathroom fixtures · Basic fixtures, could be updated for a more modern look | Minor | $500–3,000 |
| Total estimated repair cost · 4 items | $2,000–12,000 |
Value-add ROI direction
- Resale Painting and updating cabinetry in the kitchen — Fresh paint and updated cabinetry can significantly enhance the home's appeal ↑
- Resale Updating bathroom fixtures and adding a modern vanity — Modernizing the bathroom can greatly improve the home's resale value ↑
- Both Landscaping and curb appeal improvements — A well-maintained exterior can attract more buyers and renters ↑
ⓘ Cost ranges are severity-bucket heuristics (US national rule-of-thumb). Get contractor quotes + a written scope before underwriting a rehab budget.
Schools (NCES district)
- District
- Laredo ISD
- NCES district ID
- 4826790
- Math proficiency
- 21% ▼ -34.00%
- Reading proficiency
- 29% ▼ -13.00%
- Median HH income
- $25,655
- Composite
- 19.7/100
- National rank
- #8724
- State rank
- #739 of 826 in TX
Livability — Laredo
- Score
- 73/100
- State rank
- #227
- US rank
- #5399
Category grades
Schools grade is shown separately in the Schools card above.
Census & demographics
- Census place
- Laredo, TX
- City population
- 67,333
- Population (ZIP)
- 36,115
Population outlook (Webb County) Hauer SSP2
- Today (2025)
- 301,387 people
- By 2030
- 316,307 · +5.0%
- By 2040
- 345,636 · +14.7%
- By 2050
- 370,647 · +23.0%
- By 2075
- 413,907 · +37.3%
- By 2100
- 416,458 · +38.2%
Race, ethnicity, and origin ACS 2023
- Neighborhood character
- Predominantly Hispanic (97%)
- Race & ethnicity
- Hispanic / Latino 97% Two or more races 56% White 3%
- Hispanic origin (detail)
- Mexican 95%
- Foreign-born
- 32% · Canada
- Languages at home
- 7% English-only · Spanish 93%
Political lean MEDSL · Webb
- 2024 margin
- Toss-up / Even · D 48.5% · R 50.7%
- 2008→2024 swing
- -45.6pp toward R · 2008: 43.4pp · 2024: -2.2pp
- All cycles
- 2024: R+2.2 2020: D+23.3 2016: D+51.6 2012: D+54.0 2008: D+43.4
Not yet ingested
- Civics
- —
Market trends
- HPI YoY
- ▲ 4.93%
- Current HPI
- 133.0457
- Rent YoY
- —
- Metro
- —
- State GDP YoY
- ▲ 3.95%
- F500 in state
- 110
Industry mix (Fortune 500 HQ in TX)
| Industry | F500 HQs | Revenue |
|---|---|---|
| Energy | 16 | $1,198B |
|
||
| Technology | 5 | $198B |
|
||
| Engineering / Construction | 4 | $72B |
|
||
| Energy Services | 3 | $60B |
|
||
| Utilities | 3 | $41B |
|
||
| Healthcare | 2 | $330B |
|
||
Price history
1 event — show timeline
- 2025-02-14 Listed $129,900 LAOR
Cash-flow waterfall
monthlySold comps — $/sqft
last 12 mo · ≤1 miLoading sold comps…