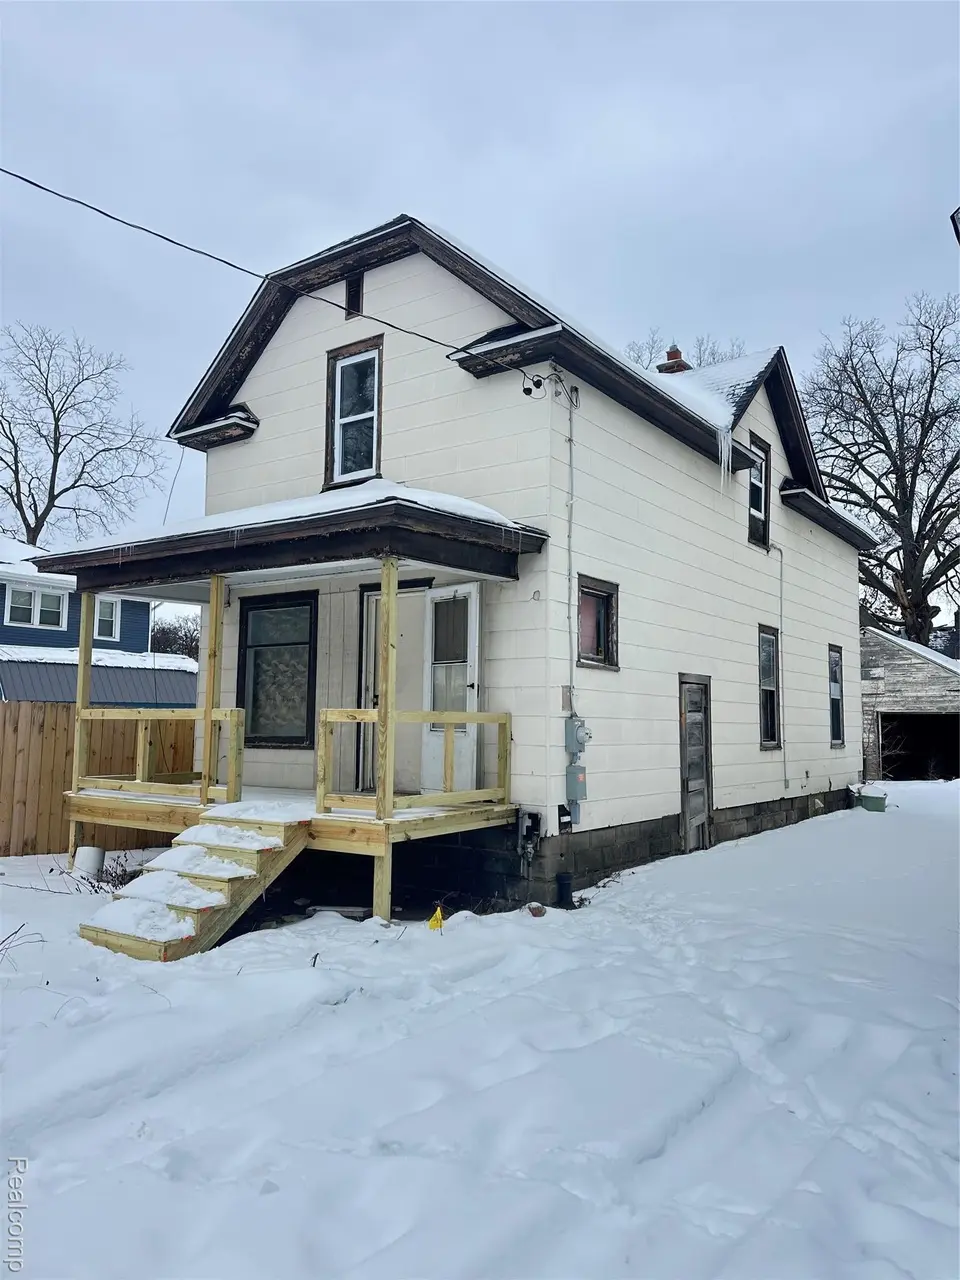
1241 Poplar St · Flint, MI
Flood risk 1/10 · Minimal
- FEMA flood zone
- X (unshaded)
- Chance of flooding over 30 yrs
- 0.0%
- Est. flood insurance / yr
- $507 – $1,088
Fire risk 1/10 · Minimal
- Est. fire insurance / yr
- $784 – $1,456
Heat risk 2/10 · Minimal
- Hot days now (above 96°F)
- 7 days/yr
- Hot days in 30 yrs
- 15 days/yr
Wind risk 2/10 · Minimal
- Chance of severe wind over 30 yrs
- —
Air-quality risk 3/10 · Minor
- Unhealthy air days now
- 3 days/yr
- Unhealthy air days in 30 yrs
- 4 days/yr
Risk factors via First Street. Map © Google.
Why this score? — see what drove the D- grade
The composite is a weighted blend of 9 inputs, each scored 0–100. Each bar is that input's sub-score; the figure is the points it added to the 100-point composite (weight × sub-score).
- Cash flow +15.0/30.0
- 1% rule +5.0/10.0
- DSCR +5.0/10.0
- Rent growth +5.0/5.0
- Livability +3.7/5.0
- Condition / age +2.5/5.0
- Schools +1.1/10.0
- ARV discount +0.0/15.0
- Appreciation +0.0/10.0
$29,999
🖨 Deal sheet (PDF) 📄 Offer letter ✓ Due diligence
Listing remarks MLS
New roof and several updates already completed. Property includes heating, electricity, and water systems in place. Located near downtown, offering convenient access to local amenities. Features include a basement and a garage, providing additional functionality and space. Home is in need of completion, making it a great opportunity for a buyer looking to add value or customize to their own preferences. Property is being sold as-is.
Key facts
- Heating systems
- Convenient access
- Water systems
Tags
Property features AI
Exterior
- Parking: Detached 1-car garage
- Utilities: Public water; Public sewer
- Home design: Single family residence; Two-story home; Ground-level entry with steps
- Construction: Vinyl siding; Block foundation
- Exterior features: Paved road access; Lot approximately 0.09 acres (32 x 120)
Interior
- Bedrooms: Total of 5 rooms (includes bedrooms and living areas)
- Bathrooms: 2 full bathrooms
- Heating & cooling: Forced air heating (natural gas); No central cooling
- Interior features: Unfinished basement
Neighborhood map
What this means for you Summary
Snapshot
- This is a 4-bed/2.0-bath single-family listed at $30k.
Deal economics
- At list price, monthly cash flow is $795 ($10k/yr) — positive.
- The deal already cash-flows at list — no discount required.
- Meets the 1% rule at list price ($1k rent vs $30k).
- Recommended offer: $28k (6.0% below list) — sets the bar for market timing.
- Cap rate 38.1% vs local median 11.5% in Flint — top-decile yield for the area; either an underpriced asset or a hidden risk that comps aren't pricing in. Stress-test before assuming the spread holds.
Location & tenants
- Location reads 74/100 on livability (#196 in MI, #4,946 nationally) — a middle-class / working-renter tenant base. Strengths: commute A+, cost of living A+, housing A+; Watch: schools F, crime F, employment F.
- Flint School District (urban): math 7% / reading 13% proficiency, ranked #714 of 760 in MI (top 94%) — low school quality limits family demand, transient renter base, plan for 1-2y turnover; 83% free/reduced lunch — lower-income household profile, screen leases tightly.
- Market conditions: Rents rising fast (+12.3%/yr); 135 active listings in the ZIP; 1 comparable units currently listed for rent nearby; lower-income renter base — watch delinquency; 419 units permitted in Genesee County in 2024 (68 in 5+ unit buildings).
- This rent runs 35% of the median local income ($44k/yr) — at the standard rent-burdened threshold; future hikes will face affordability resistance.
Forward outlook
- Local home prices are declining (-3.0%/yr); year-one equity from $207 of loan paydown is wiped out by about $900 of value loss. Plan a longer hold.
- Genesee County population projected at -27% by 2050 — secular population decline; favor cash flow + early exit over multi-decade hold.
- At projected returns (-3.0% appreciation + 8.0% rent growth), your $8k cash investment doubles in ~1 year — after that, you're playing with house money.
Negotiation context
- It's been on market 63 days — a 6% lower offer ($28k) is reasonable based on typical stale-listing flexibility.
- 6 sale attempts since 13y ago; this cycle's ask has dropped $5k (14%) from the opening price — seller is motivated, your offer sets the floor, not the list.
Risks & watch-outs
- Watch-outs: built in 1910 — expect roof / HVAC / electrical / plumbing capex.
Questions for the listing agent
- It's been on market 63 days. Have you received any prior offers? Is the seller open to a 6% concession, seller financing, or rate buy-down credit?
- Built in 1910 — when were the roof, HVAC, electrical panel, plumbing, and water heater last replaced?
- Why hasn't it sold? Are there any deal-killer items the seller is aware of (foundation, flood, title, zoning, code violations)?
- Is there a deadline driving the sale (1031 exchange, divorce, estate, relocation)? That informs how much negotiation room exists.
- Schools are F-rated, which usually means shorter tenancies and higher turnover. Who's the typical renter profile here, and what's been the actual vacancy rate?
- Crime grade is F in this area — have there been break-ins, vandalism, or insurance claims at this property in the last 3 years? What carrier currently insures it and at what premium?
- The area grade is low — what's the realistic commute time and amenity access for the typical tenant pool here? Any planned neighborhood developments (good or bad) we should know about?
- What's the average days-on-market for RENTAL listings here right now (not sales)? A rising rental-DOM trend means longer vacancies and softer asking-rent achievability than the comps imply.
- What's the recent tenant-quality profile in this submarket — average credit score on applications, eviction rate, late-payment / NSF rate, and stable-employment percentage? A property-management company in the area should have these aggregated.
- How much new for-sale + rental construction is in the pipeline within 1–3 miles? Heavy new supply typically softens prices + rents 12–24 months out; constrained supply supports both.
Investment metrics
- 1% rule
- 4.29% ✓
- Cap rate
- 38.07%
- Cash-on-cash
- 113.51%
- DSCR
- 6.05
- GRM
- 1.9
CMA / ARV
- ARV (on-the-fly)
- $25,200
- Comps found
- 8
Show comp detail 8 sales within ~0.75 mi
| Address | Dist | Beds/Ba | Sqft | Sold | Price | $/sf | Match |
|---|---|---|---|---|---|---|---|
| 1241 Poplar St | 0.00mi | 4/2.0 | 1,030 (+2%) | 1mo | $25,650 | $25 | 96 |
| 1224 Decker St | 0.27mi | 5/1.5 (+1) | 1,068 (+6%) | 8mo | $15,000 | $14 | 64 |
| 5206 Winsford By Way | 0.41mi | 3/1.0 (-1) | 986 (-2%) | 10mo | $52,000 | $53 | 60 |
| 1041 Nelson St | 0.32mi | 4/1.5 | 912 (-10%) | 15mo | $38,500 | $42 | 54 |
| 1106 Decker St | 0.23mi | 3/1.0 (-1) | 1,056 (+5%) | 24mo | $30,000 | $28 | 52 |
| 1640 Kentucky Ave | 0.53mi | 3/1.5 (-1) | 1,060 (+5%) | 14mo | $12,000 | $11 | 48 |
| 1809 Kentucky Ave | 0.68mi | 3/1.0 (-1) | 1,038 (+3%) | 10mo | $24,000 | $23 | 46 |
| 1729 Ohio Ave | 0.67mi | 3/1.0 (-1) | 1,056 (+5%) | 18mo | $25,000 | $24 | 36 |
Match score weights: distance 35% · size 25% · config 20% · recency 20%. Top-matched comps best support the ARV.
Projected returns pro-forma
-3.0% appreciation · 8.0% rent growth · sell at horizon
- IRR
- —
- Equity multiple
- 7.26×
- Total profit
- $52,566
- Equity at exit
- $4,473
- IRR
- —
- Equity multiple
- 17.90×
- Total profit
- $141,979
- Equity at exit
- $2,594
Cash invested: $8,400 (down + closing). Projections, not guarantees.
Landlord ↔ Tenant lean methodology
- Overall (STATE)
- 62 Landlord-Friendly
- State Michigan
- 62 Landlord-Friendly · EVEN
- County
- — inherits STATE
- City
- — inherits STATE
ZIP-level market 48503
- Home prices YoY
- -27.7%
- Rents YoY
- 12.3%
- Active inventory
- 135
- Price-to-rent
- 1.9×
Monthly cashflow live
- Estimated rent
- $1,286 medium interval (Pro) →
- Mortgage (P&I)
- −$157
- Tax from tax record
- −$52 /mo · $619/yr
- Insurance
- −$12
- HOA
- −$0
- Vacancy / Maint / Mgmt
- −$270
- Net cashflow
- $795
Break-even live
Sensitivity live
| Price | -10% $811 | -5% $803 | +0% $795 | +5% $786 | +10% $778 |
|---|---|---|---|---|---|
| Rent | -10% $693 | -5% $744 | +0% $795 | +5% $845 | +10% $896 |
| Rate | -1.0pp $810 | -0.5pp $802 | base $795 | +0.5pp $787 | +1.0pp $779 |
UW: 25.0% down · 7.5% · 30yr · 1.5% tax · 5.0% vac · 8.0% maint · 8.0% mgmt
Financing live
Cash to close
- Down payment
- $7,500
- Closing costs
- $900
- Reserves months
- —
- Total cash needed
- —
Loan-product check · same deal, 3 products live
Conventional
25% down · 7.5% · 30yr
- Down + closing
- —
- Monthly P&I
- —
- Monthly cashflow
- —
- DSCR
- —
- Eligible?
- —
Personal DTI + credit; lowest rate.
DSCR
20% down · 8.5% · 30yr
- Down + closing
- —
- Monthly P&I
- —
- Monthly cashflow
- —
- DSCR
- —
- Eligible?
- —
No personal income docs; deal must DSCR.
Hard money
10% down · 12.0% · 12mo
- Down + closing
- —
- Monthly P&I
- —
- Monthly cashflow
- —
- DSCR
- —
- Eligible?
- —
Short-term bridge; refi at stabilization.
Rent comps 1 comps
| Address | Beds | Baths | Sqft | Rent | $/sqft | DOM | Units | Dist |
|---|---|---|---|---|---|---|---|---|
| 1540 Garland St Flint, MI | 3.0 | 2.5 | 1344 | $1,017 | $0.76 | 22d | 1 | 1.27mi |
Listing history 16 events
-
2026-06-02status $29,999 Pending 63 DOM
-
2026-06-01days on market $29,999 Active 63 DOM
-
2026-05-31days on market $29,999 Active 62 DOM
-
2026-05-30days on market $29,999 Active 61 DOM
-
2026-05-07price $29,999 436-char remark
Show marketing remark (436 chars)
New roof and several updates already completed. Property includes heating, electricity, and water systems in place. Located near downtown, offering convenient access to local amenities. Features include a basement and a garage, providing additional functionality and space. Home is in need of completion, making it a great opportunity for a buyer looking to add value or customize to their own preferences. Property is being sold as-is.
-
2026-05-06price $29,999
-
2026-03-30$35,000 Active 436-char remark
Show marketing remark (436 chars)
New roof and several updates already completed. Property includes heating, electricity, and water systems in place. Located near downtown, offering convenient access to local amenities. Features include a basement and a garage, providing additional functionality and space. Home is in need of completion, making it a great opportunity for a buyer looking to add value or customize to their own preferences. Property is being sold as-is.
-
2026-03-30$35,000 Active
Show marketing remark (436 chars)
New roof and several updates already completed. Property includes heating, electricity, and water systems in place. Located near downtown, offering convenient access to local amenities. Features include a basement and a garage, providing additional functionality and space. Home is in need of completion, making it a great opportunity for a buyer looking to add value or customize to their own preferences. Property is being sold as-is.
-
2013-10-09historical
-
2013-10-08historical
-
2013-07-31$9,500
-
2013-07-31$9,500
-
2013-07-27historical
-
2013-07-27historical
-
2013-03-15$13,500
-
2013-03-15$13,500
ⓘ Source: listings_history table (triggers on properties + properties_extension) + one-shot
backfill from property_details.listing_events for pre-trigger history.
Tax reassessment forecast MI · Partial reset (capped growth)
- Current annual tax
- $619 · $52/mo
- Projected year-2 tax
- $619 · $52/mo
- Expected delta
- $0/yr ($0/mo · 0.0%)
ⓘ Screening estimate from a state-policy table — verify with the county assessor before closing.
Climate risk First Street
- Flood 1/10 Low FEMA zone X (unshaded) · 0% chance over 30 yrs
- Wildfire 1/10 Low
- Heat 2/10 Low 7 d/yr ≥96°F today · 15 d/yr by 30 yrs out
- Wind 2/10 Low
- Air quality 3/10 Moderate 3 unhealthy d/yr today · 4 by 30 yrs out
Nearby sold comps map
Loading sold comps map…
Walkable amenities ~0.75 mi
Loading nearby amenities…
Taxation est. · year 1
- Rental income
- $15,432
- − Mortgage interest
- −$1,680
- − Property taxes
- −$619
- − Insurance
- −$150
- − Repairs & maintenance
- −$1,235
- − Management
- −$1,235
- − Depreciation
- −$873
- Taxable income
- $9,640
- Est. tax owed @ 24.0%
- −$2,314
- After-tax cash flow
- $7,220/yr
For passive investors: Depreciation is non-cash, so a rental often shows a tax loss while cash-flowing — sheltering income. Rental losses are passive: they offset passive income freely, and up to $25,000/yr can offset ordinary (W-2) income if you actively participate and your MAGI is under $100k (phasing out to $0 by $150k); unused losses carry forward. On sale, claimed depreciation is recaptured at up to 25%, and gains may owe capital-gains tax (a 1031 exchange can defer both). Figures are a year-1 estimate at your 24.0% rate — not tax advice; consult a CPA.
Schools (NCES district)
- District
- Flint School District
- NCES district ID
- 2614520
- Math proficiency
- 7% ▬ 0.00%
- Reading proficiency
- 13% ▲ 3.00%
- Median HH income
- $25,954
- Composite
- 10.97/100
- National rank
- #14642
- State rank
- #714 of 760 in MI
Livability — Flint
- Score
- 74/100
- State rank
- #196
- US rank
- #4946
Category grades
Schools grade is shown separately in the Schools card above.
Census & demographics
- Census place
- Flint, MI
- County
- Genesee County · 221,329 people
- City population
- 93,814
- Metro
- Flint, MI
- Population (ZIP)
- 22,347
- Household income
- $44,411
- Rent vs Own
- Severe rent burden
- 1293.0
Population outlook (Genesee County) Hauer SSP2
- Today (2025)
- 381,312 people
- By 2030
- 362,731 · -4.9%
- By 2040
- 321,550 · -15.7%
- By 2050
- 279,212 · -26.8%
- By 2075
- 193,336 · -49.3%
- By 2100
- 128,118 · -66.4%
Race, ethnicity, and origin ACS 2023
- Neighborhood character
- Diverse neighborhood (Simpson 0.56)
- Race & ethnicity
- Black 55% White 36% Two or more races 4% Hispanic / Latino 3%
- Common ancestry
- Romanian 2% Lithuanian 2% Slovak 1%
- Foreign-born
- 5% · China, Canada
- Languages at home
- 93% English-only · Arabic 4% Spanish 1% Chinese 1%
Political lean MEDSL · Genesee
- 2024 margin
- Toss-up / Even · D 51.4% · R 47.2% · Other 1.4%
- 2008→2024 swing
- -28.3pp toward R · 2008: 32.5pp · 2024: 4.2pp
- All cycles
- 2024: D+4.2 2020: D+9.3 2016: D+9.5 2012: D+28.2 2008: D+32.5
Not yet ingested
- Civics
- —
Market trends
- HPI YoY
- ▼ -49.84%
- Current HPI
- 130.1152
- Rent YoY
- ▲ 12.35%
- Metro
- Flint, MI
- State GDP YoY
- ▲ 1.37%
- F500 in state
- 28
Industry mix (Fortune 500 HQ in MI)
| Industry | F500 HQs | Revenue |
|---|---|---|
| Automotive Parts | 3 | $48B |
|
||
| Automotive | 2 | $372B |
|
||
| Chemicals | 1 | $45B |
|
||
| Automotive Retail | 1 | $29B |
|
||
| Healthcare / Medical Devices | 1 | $23B |
|
||
| Automotive Technology | 1 | $20B |
|
||
Price history
+122.2% since first listed12 events — show timeline
- 2026-05-07 Price Changed $29,999 MiRealSource-MiMLS
- 2026-05-06 Price Changed $29,999 REALCOMP
- 2026-03-30 Listed $35,000 REALCOMP
- 2026-03-30 Listed $35,000 MiRealSource-MiMLS
- 2013-10-09 Listing Removed — MiRealSource-MiMLS
- 2013-10-08 Listing Removed — REALCOMP
- 2013-07-31 Listed $9,500 REALCOMP
- 2013-07-31 Listed $9,500 MiRealSource-MiMLS
- 2013-07-27 Listing Removed — MiRealSource-MiMLS
- 2013-07-27 Listing Removed — REALCOMP
- 2013-03-15 Listed $13,500 MiRealSource-MiMLS
- 2013-03-15 Listed $13,500 REALCOMP
Property tax history
+1.4%/yrLatest (2025): $619 · +1.3% YoY. Source: county tax records.
Cash-flow waterfall
monthlySold comps — $/sqft
last 12 mo · ≤1 miLoading sold comps…