 🔨 Auction
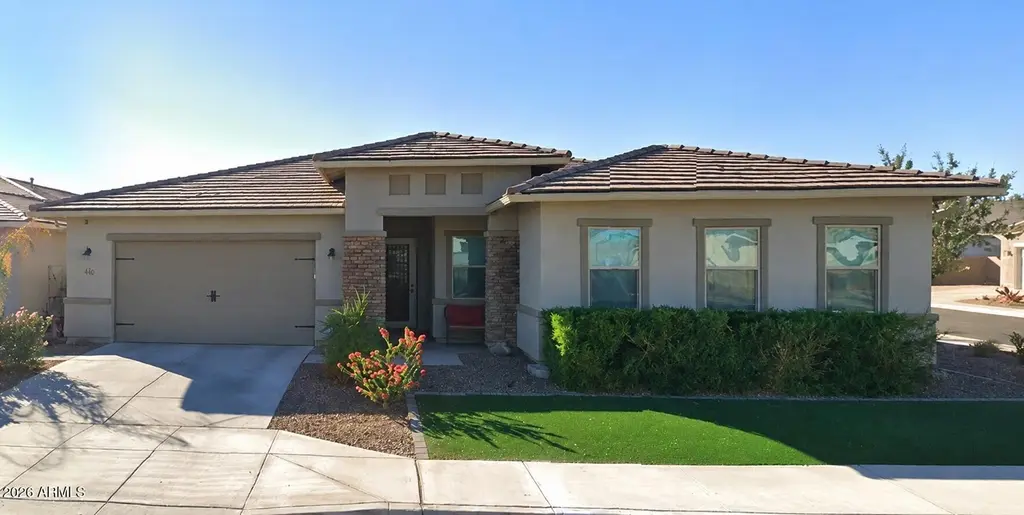
5154 N 184th Ln · Citrus Park, AZ
Flood risk 1/10 · Minimal
- FEMA flood zone
- X (shaded)
- Chance of flooding over 30 yrs
- 0.0%
- Est. flood insurance / yr
- $507 – $1,088
Fire risk 5/10 · Moderate
- Est. fire insurance / yr
- $610 – $1,132
Heat risk 9/10 · Severe
- Hot days now (above 113°F)
- 7 days/yr
- Hot days in 30 yrs
- 18 days/yr
Wind risk 1/10 · Minimal
- Chance of severe wind over 30 yrs
- —
Air-quality risk 1/10 · Minimal
- Unhealthy air days now
- 0 days/yr
- Unhealthy air days in 30 yrs
- 0 days/yr
Risk factors via First Street. Map © Google.
Why this score? — see what drove the F grade
The composite is a weighted blend of 9 inputs, each scored 0–100. Each bar is that input's sub-score; the figure is the points it added to the 100-point composite (weight × sub-score).
- ARV discount +7.5/15.0
- Rent growth +3.0/5.0
- Livability +3.0/5.0
- Schools +2.8/10.0
- Condition / age +2.5/5.0
- Cash flow +0.8/30.0
- 1% rule +0.0/10.0
- DSCR +0.0/10.0
- Appreciation +0.0/10.0
$1
🖨 Deal sheet 📄 Offer letter ✓ Due diligence
Listing remarks
The list price is not indicative of seller's final reserve amount. This property is part of an online bidding event. Inspections of this property and interaction with occupants are strictly prohibited. Property is sold ''as is'' and no for sale sign allowed. Auction date: 06.21.2026
Key facts
- 8,441 sq ft lot
- 2 garage spots
- Pool
Property features AI
Finance
- HOA & community: Monthly association fee of $119; HOA covers grounds maintenance; Community pool
Exterior
- Parking: 2 covered parking spaces; 2 open parking spaces; 2-car garage
- Utilities: City water; Sewer connected
- Home design: Single family residence; Fee simple ownership
- Construction: Stucco and wood frame construction; Painted exterior; Tile roof
- Exterior features: Private pool; Desert front yard; Desert back yard; Block fencing
Interior
- Kitchen: Eat-in kitchen
- Bedrooms: 4 bedrooms
- Bathrooms: 3 full bathrooms; 1 half bathroom
- Heating & cooling: Central air; Heating present
- Interior features: Eat-in kitchen; Full bathroom in primary bedroom
- Laundry & utility: Laundry inside
Neighborhood map
What this means for you Summary
Snapshot
- This is a 4-bed/3.5-bath single-family listed at $1.
Deal economics
- At list price, monthly cash flow is $-4k ($-45k/yr) — negative.
- The deal already cash-flows at list — no discount required.
- Meets the 1% rule at list price ($3k rent vs $1).
- Cap rate 1.2% vs local median 2.5% in Citrus Park — below-typical yield; the buyer is paying a premium for something (appreciation thesis, condition, location) that the cap rate doesn't capture.
Location & tenants
- Location reads 59/100 on livability (#199 in AZ) — a working-class tenant base; expect higher turnover. Strengths: crime A+, employment A+, housing A+; Watch: amenities F, commute F, cost of living F.
- Agua Fria Union High School District (4289) (suburban): math 24% / reading 37% proficiency, ranked #99 of 249 in AZ (top 40%) — families likely to look elsewhere, expect single-tenant / working-renter base with shorter leases.
- Zoned schools: Verrado High School (math 24% / reading 34%, grade F, #130 of 381 statewide, top 34%, 1,854 students, 26% FRL).
- Market conditions: Rents rising (+1.9%/yr); 474 active listings in the ZIP; 6 comparable units currently listed for rent nearby; rentals leasing fast (median 3d on market — plan ~1-2 weeks tenant-placement turnaround); high-income renter base; 36,011 units permitted in Maricopa County in 2024 (12,801 in 5+ unit buildings).
- This rent runs 31% of the median local income ($122k/yr) — at the standard rent-burdened threshold; future hikes will face affordability resistance.
Forward outlook
- Local home prices are declining (-3.0%/yr); year-one equity from $6k of loan paydown is wiped out by about $27k of value loss. Plan a longer hold.
- Maricopa County population projected at +38% by 2050 — long-run rental-demand tailwind backs the buy-and-hold thesis.
Negotiation context
- It's been on market 23 days — a 2% lower offer ($0) is reasonable based on typical stale-listing flexibility.
Risks & watch-outs
- Watch-outs: property tax is 1332555.0% of price.
- Climate carrying-cost: moderate wildfire risk; extreme-heat days projected 7→18/yr by 2055 (HVAC capex compounding) — expect insurance premiums to compound above CPI over the hold.
Questions for the listing agent
- What do current leases actually rent for vs. the listed asking? Can we see a recent rent roll and the last 12 months of T-12 income?
- Property tax is high relative to price — has the assessment been appealed recently, and will the sale trigger a re-assessment?
- What does the HOA fee cover, when was the last increase, and are there any pending special assessments or reserve-fund shortfalls?
- Is there a deadline driving the sale (1031 exchange, divorce, estate, relocation)? That informs how much negotiation room exists.
- Schools are D-rated, which usually means shorter tenancies and higher turnover. Who's the typical renter profile here, and what's been the actual vacancy rate?
- The area grade is low — what's the realistic commute time and amenity access for the typical tenant pool here? Any planned neighborhood developments (good or bad) we should know about?
- What's the average days-on-market for RENTAL listings here right now (not sales)? A rising rental-DOM trend means longer vacancies and softer asking-rent achievability than the comps imply.
- What's the recent tenant-quality profile in this submarket — average credit score on applications, eviction rate, late-payment / NSF rate, and stable-employment percentage? A property-management company in the area should have these aggregated.
- How much new for-sale + rental construction is in the pipeline within 1–3 miles? Heavy new supply typically softens prices + rents 12–24 months out; constrained supply supports both.
Investment metrics
- 1% rule
- 0.36% ✗
- Cap rate
- 1.23%
- Cash-on-cash
- -18.08%
- DSCR
- 0.20
- GRM
- 23.3
CMA / ARV
- ARV (on-the-fly)
- $888,370
- Comps found
- 12
Show comp detail 12 sales within ~0.75 mi
| Address | Dist | Beds/Ba | Sqft | Sold | Price | $/sf | Match |
|---|---|---|---|---|---|---|---|
| 5137 N 183rd Ln | 0.13mi | 4/3.5 | 3,430 (0%) | 2mo | $585,000 | $171 | 92 |
| 18242 W Colter St | 0.27mi | 4/3.5 | 3,180 (-7%) | 2mo | $815,000 | $256 | 74 |
| 5306 N 182nd Ln | 0.29mi | 4/5.0 | 3,630 (+6%) | 2mo | $1,355,000 | $373 | 69 |
| 18208 W San Juan Ct | 0.53mi | 4/5.0 | 3,372 (-2%) | 1mo | $1,545,000 | $458 | 66 |
| 5170 N 186th Dr | 0.24mi | 5/5.0 (+1) | 3,607 (+5%) | 6mo | $940,000 | $261 | 64 |
| 5134 N 185th Ln | 0.13mi | 4/2.5 | 2,947 (-14%) | 6mo | $625,500 | $212 | 61 |
| 18581 W Hazelwood St | 0.61mi | 4/3.0 | 3,245 (-5%) | 3mo | $765,000 | $236 | 58 |
| 18139 W Oregon Ct | 0.41mi | 5/5.0 (+1) | 3,607 (+5%) | 4mo | $1,100,000 | $305 | 58 |
| 5080 N 182nd Ln | 0.25mi | 4/2.5 | 2,947 (-14%) | 5mo | $610,000 | $207 | 56 |
| 18416 W Montebello Ave | 0.52mi | 4/3.0 | 3,795 (+11%) | 3mo | $837,000 | $221 | 53 |
| 18707 W Elm St | 0.52mi | 4/2.5 | 2,971 (-13%) | 6mo | $770,000 | $259 | 45 |
| 18025 W Montebello Ave | 0.74mi | 3/3.0 (-1) | 3,115 (-9%) | 2mo | $940,000 | $302 | 41 |
Match score weights: distance 35% · size 25% · config 20% · recency 20%. Top-matched comps best support the ARV.
Projected returns pro-forma
-3.0% appreciation · 1.92% rent growth · sell at horizon
- IRR
- -53.7%
- Equity multiple
- -0.55×
- Total profit
- $-385,947
- Equity at exit
- $132,459
- IRR
- —
- Equity multiple
- -1.64×
- Total profit
- $-656,664
- Equity at exit
- $76,810
Cash invested: $248,744 (down + closing). Projections, not guarantees.
Landlord ↔ Tenant lean methodology
- Overall (STATE)
- 87 Strongly Landlord-Friendly
- State Arizona
- 87 Strongly Landlord-Friendly · R+3
- County
- — inherits STATE
- City
- — inherits STATE
ZIP-level market 85340
- Rents YoY
- 1.9%
- Active inventory
- 474
Monthly cashflow live
- Estimated rent
- $3,178 high interval (Pro) →
- Mortgage (P&I)
- −$4,659
- Tax est. 1.5%
- −$1,110 /mo · $13,326/yr
- Insurance
- −$370
- HOA
- −$119
- Vacancy / Maint / Mgmt
- −$667
- Net cashflow
- $-3,748
Break-even live
UW: 25.0% down · 7.5% · 30yr · 1.5% tax · 5.0% vac · 8.0% maint · 8.0% mgmt
Financing live
Cash to close
- Down payment
- $222,092
- Closing costs
- $26,651
- Reserves months
- —
- Total cash needed
- —
Loan-product check · same deal, 3 products live
Conventional
25% down · 7.5% · 30yr
- Down + closing
- —
- Monthly P&I
- —
- Monthly cashflow
- —
- DSCR
- —
- Eligible?
- —
Personal DTI + credit; lowest rate.
DSCR
20% down · 8.5% · 30yr
- Down + closing
- —
- Monthly P&I
- —
- Monthly cashflow
- —
- DSCR
- —
- Eligible?
- —
No personal income docs; deal must DSCR.
Hard money
10% down · 12.0% · 12mo
- Down + closing
- —
- Monthly P&I
- —
- Monthly cashflow
- —
- DSCR
- —
- Eligible?
- —
Short-term bridge; refi at stabilization.
Rent comps 6 comps
| Address | Beds | Baths | Sqft | Rent | $/sqft | DOM | Units | Dist |
|---|---|---|---|---|---|---|---|---|
| 18388 W College Dr Goodyear, AZ | 3.0 | 2.5 | 2279 | $2,495 | $1.09 | 10d | 1 | 0.26mi |
| 4689 N 183rd Ave Goodyear, AZ | 4.0 | 4.5 | 4347 | $3,990 | $0.92 | 1d | 1 | 0.55mi |
| 19210 W Denton St Litchfield Park, AZ | 4.0 | 2.5 | 2961 | $4,900 | $1.65 | 1d | 1 | 0.93mi |
| 19208 W Elm St Litchfield Park, AZ | 5.0 | 3.0 | 2688 | $3,100 | $1.15 | 2d | 1 | 0.95mi |
| 19210 W Solano Dr Litchfield Park, AZ | 5.0 | 3.0 | 2917 | $2,600 | $0.89 | 1d | 1 | 1.07mi |
| 19550 W Badgett Ln Litchfield Park, AZ | 5.0 | 3.0 | 2688 | $2,350 | $0.87 | 22d | 1 | 1.47mi |
HOA detail
- Monthly dues
- $119 · $1,428/yr
Listing history 14 events
-
2026-06-18days on market $1 Active 23 DOM
-
2026-06-17days on market $1 Active 22 DOM
-
2026-06-16days on market $1 Active 21 DOM
-
2026-06-15days on market $1 Active 20 DOM
-
2026-06-13days on market $1 Active 18 DOM
-
2026-06-09days on market $1 Active 14 DOM
-
2026-06-08days on market $1 Active 13 DOM
-
2026-06-07days on market $1 Active 12 DOM
-
2026-06-04days on market $1 Active 9 DOM
-
2026-06-03days on market $1 Active 8 DOM
-
2026-06-02days on market $1 Active 7 DOM
-
2026-06-01days on market $1 Active 6 DOM
-
2026-05-31days on market $1 Active 5 DOM
-
2026-05-26$1 Active
ⓘ Source: listings_history table (triggers on properties + properties_extension) + one-shot
backfill from property_details.listing_events for pre-trigger history.
Climate risk First Street
- Flood 1/10 Low FEMA zone X (shaded) · 0% chance over 30 yrs
- Wildfire 5/10 Major
- Heat 9/10 Extreme 7 d/yr ≥113°F today · 18 d/yr by 30 yrs out
- Wind 1/10 Low
- Air quality 1/10 Low 0 unhealthy d/yr today · 0 by 30 yrs out
Nearby sold comps map
Loading sold comps map…
Walkable amenities ~0.75 mi
Loading nearby amenities…
Taxation est. · year 1
- Rental income
- $38,135
- − Mortgage interest
- −$49,763
- − Property taxes
- −$13,326
- − Insurance
- −$4,442
- − Repairs & maintenance
- −$3,051
- − Management
- −$3,051
- − HOA
- −$1,428
- − Depreciation
- −$25,843
- Taxable loss
- −$62,768
- Est. tax savings @ 24.0%
- +$15,064
- After-tax cash flow
- $-29,909/yr
For passive investors: Depreciation is non-cash, so a rental often shows a tax loss while cash-flowing — sheltering income. Rental losses are passive: they offset passive income freely, and up to $25,000/yr can offset ordinary (W-2) income if you actively participate and your MAGI is under $100k (phasing out to $0 by $150k); unused losses carry forward. On sale, claimed depreciation is recaptured at up to 25%, and gains may owe capital-gains tax (a 1031 exchange can defer both). Figures are a year-1 estimate at your 24.0% rate — not tax advice; consult a CPA.
Schools (NCES district)
- District
- Agua Fria Union High School District (4289)
- NCES district ID
- 0400450
- Math proficiency
- 24% ▼ -32.00%
- Reading proficiency
- 37% ▼ -12.00%
- Median HH income
- $64,107
- Composite
- 27.92/100
- National rank
- #6865
- State rank
- #99 of 249 in AZ
Livability — Citrus Park
- Score
- 59/100
- State rank
- #199
- US rank
- #20258
Category grades
Schools grade is shown separately in the Schools card above.
Census & demographics
- Census place
- Citrus Park, AZ
- County
- Maricopa County · 4,537,380 people
- Metro
- Phoenix-Mesa-Chandler, AZ
- Population (ZIP)
- 40,919
- Household income
- $122,323
- Rent vs Own
- Severe rent burden
- 696.0
Population outlook (Maricopa County) Hauer SSP2
- Today (2025)
- 4,979,203 people
- By 2030
- 5,378,229 · +8.0%
- By 2040
- 6,156,598 · +23.6%
- By 2050
- 6,872,376 · +38.0%
- By 2075
- 8,401,270 · +68.7%
- By 2100
- 9,247,439 · +85.7%
Race, ethnicity, and origin ACS 2023
- Neighborhood character
- Diverse neighborhood (Simpson 0.64)
- Race & ethnicity
- White 48% Hispanic / Latino 35% Two or more races 19% Black 5% Asian 4% Native American 1%
- Hispanic origin (detail)
- Mexican 27%
- Common ancestry
- Romanian 2% Portuguese 2% Slovak 2%
- Foreign-born
- 12% · Canada, Vietnam, China
- Languages at home
- 78% English-only · Spanish 16% Other Indo-European 1%
Political lean MEDSL · Maricopa
- 2024 margin
- Toss-up / Even · D 47.7% · R 51.2% · Other 1.1%
- 2008→2024 swing
- +7.1pp toward D · 2008: -10.6pp · 2024: -3.5pp
- All cycles
- 2024: R+3.5 2020: D+2.2 2016: R+3.5 2012: R+12.0 2008: R+10.6
Not yet ingested
- Civics
- —
Market trends
- HPI YoY
- ▼ -322.29%
- Current HPI
- 279.2294
- Rent YoY
- ▲ 1.92%
- Metro
- Phoenix-Mesa-Chandler, AZ
- State GDP YoY
- ▲ 4.54%
- F500 in state
- 20
Industry mix (Fortune 500 HQ in AZ)
| Industry | F500 HQs | Revenue |
|---|---|---|
| Technology | 2 | $13B |
|
||
| Mining / Metals | 1 | $23B |
|
||
| Environmental Services | 1 | $16B |
|
||
| Metals / Steel | 1 | $14B |
|
||
| Technology Distribution | 1 | $9B |
|
||
| Homebuilding | 1 | $8B |
|
||
Property tax history
+125.5%/yrLatest (2025): $3,754 · +3.2% YoY. Source: county tax records.
Cash-flow waterfall
monthlySold comps — $/sqft
last 12 mo · ≤1 miLoading sold comps…