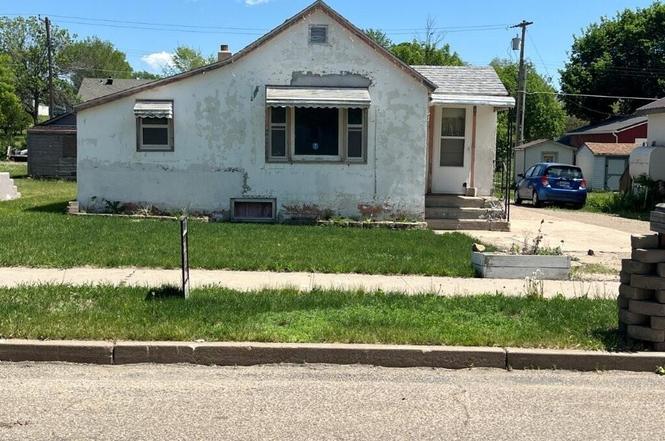
710 E 3rd Ave · Mobridge, SD
Flood risk 1/10 · Minimal
- FEMA flood zone
- —
- Chance of flooding over 30 yrs
- 0.0%
- Est. flood insurance / yr
- —
Fire risk 4/10 · Minor
- Est. fire insurance / yr
- $1,342 – $2,492
Heat risk 3/10 · Minor
- Hot days now (above 99°F)
- 7 days/yr
- Hot days in 30 yrs
- 14 days/yr
Wind risk 2/10 · Minimal
- Chance of severe wind over 30 yrs
- —
Air-quality risk 2/10 · Minimal
- Unhealthy air days now
- 2 days/yr
- Unhealthy air days in 30 yrs
- 2 days/yr
Risk factors via First Street. Map © Google.
Why this score? — see what drove the B grade
The composite is a weighted blend of 9 inputs, each scored 0–100. Each bar is that input's sub-score; the figure is the points it added to the 100-point composite (weight × sub-score).
- Cash flow +30.0/30.0
- 1% rule +10.0/10.0
- DSCR +10.0/10.0
- ARV discount +7.5/15.0
- Schools +4.7/10.0
- Livability +3.6/5.0
- Rent growth +2.5/5.0
- Condition / age +2.5/5.0
- Appreciation +0.0/10.0
$45,000
🖨 Deal sheet 📄 Offer letter ✓ Due diligence
Listing remarks MLS
This 2-bedroom, 1.5-bath home offers 842 square feet of main floor living space, with additional partially finished basement. A detached two-stall garage provides convenient parking and storage, complemented by an additional storage shed on the property. This home presents a great opportunity for owner-occupants or investors alike.
Key facts
- 7,000 sq ft lot
- 2 garage spots
- Built 1920
Property features AI
Exterior
- Parking: Attached or detached 2-car garage
- Utilities: Public water; Public sewer; Sewer connected; Water connected
- Home design: Single-family residence; One level
- Construction: Composition roof
- Exterior features: Composition roof; Lot dimensions approximately 50 x 140
Interior
- Kitchen: Range
- Heating & cooling: Natural gas heating
- Interior features: Range
Neighborhood map
What this means for you Summary
Snapshot
- This is a 2-bed/2.0-bath single-family listed at $45k.
Deal economics
- At list price, monthly cash flow is $370 ($4k/yr) — positive.
- The deal already cash-flows at list — no discount required.
- Meets the 1% rule at list price ($861 rent vs $45k).
- Recommended offer: $40k (12.0% below list) — sets the bar for market timing.
Location & tenants
- Location reads 71/100 on livability (#60 in SD) — a middle-class / working-renter tenant base. Strengths: cost of living A+, housing A+, crime B+; Watch: employment D+, amenities F, commute F.
- Mobridge-Pollock 62-6 (town): math 50% / reading 62% proficiency, ranked #14 of 59 in SD (top 24%) — acceptable for families but not a draw, mixed tenant base, ~2y average lease.
- Market conditions: 31 active listings in the ZIP; 7 units permitted in Walworth County in 2024 (0 in 5+ unit buildings).
Forward outlook
- Local home prices are declining (-3.0%/yr); year-one equity from $311 of loan paydown is wiped out by about $1k of value loss. Plan a longer hold.
- Walworth County population projected at +10% by 2050 — modest demand growth; plan on rents tracking national, not racing it.
- At projected returns (-3.0% appreciation + 3.0% rent growth), your $13k cash investment doubles in ~4 years — after that, you're playing with house money.
Negotiation context
- It's been on market 126 days — a 12% lower offer ($40k) is reasonable based on typical stale-listing flexibility.
- 2 sale attempts; this cycle's ask has dropped $10k (18%) from the opening price — seller is motivated, your offer sets the floor, not the list.
Risks & watch-outs
- Watch-outs: built in 1920 — expect roof / HVAC / electrical / plumbing capex.
Questions for the listing agent
- It's been on market 126 days. Have you received any prior offers? Is the seller open to a 12% concession, seller financing, or rate buy-down credit?
- Built in 1920 — when were the roof, HVAC, electrical panel, plumbing, and water heater last replaced?
- Why hasn't it sold? Are there any deal-killer items the seller is aware of (foundation, flood, title, zoning, code violations)?
- Is there a deadline driving the sale (1031 exchange, divorce, estate, relocation)? That informs how much negotiation room exists.
- Schools are B-rated — typically a magnet for longer-tenancy family renters. What's the average tenant stay here, and is there a school-zone premium baked into asking?
- What's the average days-on-market for RENTAL listings here right now (not sales)? A rising rental-DOM trend means longer vacancies and softer asking-rent achievability than the comps imply.
- What's the recent tenant-quality profile in this submarket — average credit score on applications, eviction rate, late-payment / NSF rate, and stable-employment percentage? A property-management company in the area should have these aggregated.
- How much new for-sale + rental construction is in the pipeline within 1–3 miles? Heavy new supply typically softens prices + rents 12–24 months out; constrained supply supports both.
Investment metrics
- 1% rule
- 1.91% ✓
- Cap rate
- 16.15%
- Cash-on-cash
- 35.20%
- DSCR
- 2.57
- GRM
- 4.4
CMA / ARV
No comps found within radius.
Projected returns pro-forma
-3.0% appreciation · 3.0% rent growth · sell at horizon
- IRR
- 30.8%
- Equity multiple
- 2.29×
- Total profit
- $16,261
- Equity at exit
- $6,710
- IRR
- 38.0%
- Equity multiple
- 4.53×
- Total profit
- $44,523
- Equity at exit
- $3,891
Cash invested: $12,600 (down + closing). Projections, not guarantees.
Landlord ↔ Tenant lean methodology
- Overall (STATE)
- 83 Strongly Landlord-Friendly
- State South Dakota
- 83 Strongly Landlord-Friendly · R+16
- County
- — inherits STATE
- City
- — inherits STATE
ZIP-level market 57601
- Home prices YoY
- -13.6%
- Active inventory
- 31
- Price-to-rent
- 4.4×
Monthly cashflow live
- Estimated rent
- $861 medium interval (Pro) →
- Mortgage (P&I)
- −$236
- Tax est. 1.5%
- −$56 /mo · $675/yr
- Insurance
- −$19
- HOA
- −$0
- Vacancy / Maint / Mgmt
- −$181
- Net cashflow
- $370
Break-even live
UW: 25.0% down · 7.5% · 30yr · 1.5% tax · 5.0% vac · 8.0% maint · 8.0% mgmt
Financing live
Cash to close
- Down payment
- $11,250
- Closing costs
- $1,350
- Reserves months
- —
- Total cash needed
- —
Loan-product check · same deal, 3 products live
Conventional
25% down · 7.5% · 30yr
- Down + closing
- —
- Monthly P&I
- —
- Monthly cashflow
- —
- DSCR
- —
- Eligible?
- —
Personal DTI + credit; lowest rate.
DSCR
20% down · 8.5% · 30yr
- Down + closing
- —
- Monthly P&I
- —
- Monthly cashflow
- —
- DSCR
- —
- Eligible?
- —
No personal income docs; deal must DSCR.
Hard money
10% down · 12.0% · 12mo
- Down + closing
- —
- Monthly P&I
- —
- Monthly cashflow
- —
- DSCR
- —
- Eligible?
- —
Short-term bridge; refi at stabilization.
Listing history 17 events
-
2026-06-18days on market $45,000 Active 126 DOM
-
2026-06-17days on market $45,000 Active 125 DOM
-
2026-06-16days on market $45,000 Active 124 DOM
-
2026-06-15days on market $45,000 Active 123 DOM
-
2026-06-13days on market $45,000 Active 121 DOM
-
2026-06-12days on market $45,000 Active 120 DOM
-
2026-06-09days on market $45,000 Active 117 DOM
-
2026-06-08days on market $45,000 Active 116 DOM
-
2026-06-08days on market $45,000 Active 115 DOM
-
2026-06-05days on market $45,000 Active 113 DOM
-
2026-06-04days on market $45,000 Active 111 DOM
-
2026-06-02days on market $45,000 Active 110 DOM
-
2026-06-01days on market $45,000 Active 109 DOM
-
2026-05-31days on market $45,000 Active 108 DOM
-
2026-04-14$55,000 Active 333-char remark
Show marketing remark (333 chars)
This 2-bedroom, 1.5-bath home offers 842 square feet of main floor living space, with additional partially finished basement. A detached two-stall garage provides convenient parking and storage, complemented by an additional storage shed on the property. This home presents a great opportunity for owner-occupants or investors alike.
-
2026-04-08price $55,000
-
2026-02-12$60,000 Active
ⓘ Source: listings_history table (triggers on properties + properties_extension) + one-shot
backfill from property_details.listing_events for pre-trigger history.
Climate risk First Street
- Flood 1/10 Low 0% chance over 30 yrs
- Wildfire 4/10 Moderate
- Heat 3/10 Moderate 7 d/yr ≥99°F today · 14 d/yr by 30 yrs out
- Wind 2/10 Low
- Air quality 2/10 Low 2 unhealthy d/yr today · 2 by 30 yrs out
Nearby sold comps map
Loading sold comps map…
Walkable amenities ~0.75 mi
Loading nearby amenities…
Taxation est. · year 1
- Rental income
- $10,338
- − Mortgage interest
- −$2,521
- − Property taxes
- −$675
- − Insurance
- −$225
- − Repairs & maintenance
- −$827
- − Management
- −$827
- − Depreciation
- −$1,309
- Taxable income
- $3,954
- Est. tax owed @ 24.0%
- −$949
- After-tax cash flow
- $3,486/yr
For passive investors: Depreciation is non-cash, so a rental often shows a tax loss while cash-flowing — sheltering income. Rental losses are passive: they offset passive income freely, and up to $25,000/yr can offset ordinary (W-2) income if you actively participate and your MAGI is under $100k (phasing out to $0 by $150k); unused losses carry forward. On sale, claimed depreciation is recaptured at up to 25%, and gains may owe capital-gains tax (a 1031 exchange can defer both). Figures are a year-1 estimate at your 24.0% rate — not tax advice; consult a CPA.
Schools (NCES district)
- District
- Mobridge-Pollock 62-6
- NCES district ID
- 4680441
- Math proficiency
- 50% ▲ 2.00%
- Reading proficiency
- 62% ▼ -3.00%
- Median HH income
- $42,172
- Composite
- 46.97/100
- National rank
- #2355
- State rank
- #14 of 59 in SD
Livability — Mobridge
- Score
- 71/100
- State rank
- #60
- US rank
- #7236
Category grades
Schools grade is shown separately in the Schools card above.
Census & demographics
- Census place
- Mobridge, SD
- Population (ZIP)
- 3,483
Population outlook (Walworth County) Hauer SSP2
- Today (2025)
- 5,610 people
- By 2030
- 5,693 · +1.5%
- By 2040
- 5,896 · +5.1%
- By 2050
- 6,200 · +10.5%
- By 2075
- 7,621 · +35.8%
- By 2100
- 9,375 · +67.1%
Race, ethnicity, and origin ACS 2023
- Neighborhood character
- Predominantly White (69%)
- Race & ethnicity
- White 69% Native American 18% Two or more races 12% Hispanic / Latino 1%
- Common ancestry
- Portuguese 13% Iranian 3% Scotch-Irish 2%
- Foreign-born
- 1%
- Languages at home
- 96% English-only · Spanish 3%
Political lean MEDSL · Walworth
- 2024 margin
- Solid R (+59.2) · D 19.5% · R 78.7% · Other 1.8%
- 2008→2024 swing
- -31.0pp toward R · 2008: -28.1pp · 2024: -59.2pp
- All cycles
- 2024: R+59.2 2020: R+54.3 2016: R+58.1 2012: R+43.1 2008: R+28.1
Not yet ingested
- Civics
- —
Market trends
- HPI YoY
- ▼ -25.03%
- Current HPI
- 159.6477
- Rent YoY
- —
- Metro
- —
- State GDP YoY
- ▲ 0.70%
- F500 in state
- 2
Industry mix (Fortune 500 HQ in SD)
| Industry | F500 HQs | Revenue |
|---|---|---|
| Utilities | 1 | $1B |
|
||
Price history
-8.3% since first listed3 events — show timeline
- 2026-04-14 Listed $55,000 GNMLS
- 2026-04-08 Price Changed $55,000 ABOR
- 2026-02-12 Listed $60,000 ABOR
Cash-flow waterfall
monthlySold comps — $/sqft
last 12 mo · ≤1 miLoading sold comps…