 Fourplex
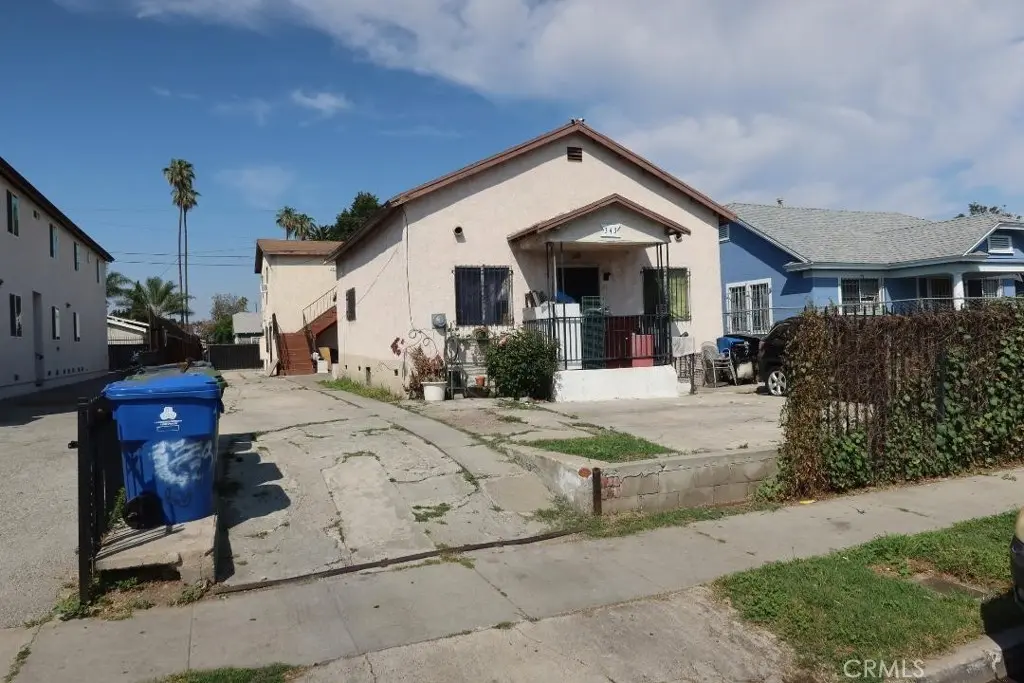
343 W 77th St · Los Angeles, CA
Flood risk 1/10 · Minimal
- FEMA flood zone
- X (unshaded)
- Chance of flooding over 30 yrs
- 0.0%
- Est. flood insurance / yr
- $507 – $1,088
Fire risk 1/10 · Minimal
- Est. fire insurance / yr
- $659 – $1,223
Heat risk 5/10 · Moderate
- Hot days now (above 88°F)
- 7 days/yr
- Hot days in 30 yrs
- 20 days/yr
Wind risk 1/10 · Minimal
- Chance of severe wind over 30 yrs
- —
Air-quality risk 5/10 · Moderate
- Unhealthy air days now
- 7 days/yr
- Unhealthy air days in 30 yrs
- 7 days/yr
Risk factors via First Street. Map © Google.
Why this score? — see what drove the C- grade
The composite is a weighted blend of 9 inputs, each scored 0–100. Each bar is that input's sub-score; the figure is the points it added to the 100-point composite (weight × sub-score).
- Cash flow +24.2/30.0
- DSCR +7.8/10.0
- 1% rule +5.2/10.0
- Schools +3.6/10.0
- Livability +3.4/5.0
- ARV discount +3.2/15.0
- Rent growth +2.5/5.0
- Condition / age +2.5/5.0
- Appreciation +0.0/10.0
$849,000
🖨 Deal sheet 📄 Offer letter ✓ Due diligence
Multi-family units
County records classify this as Multi-Family (2-4 Unit). Listing-text estimate: 4 units. confirmed
Listing remarks MLS
Four units located at 343 W 77th St Los Angeles, CA. Please don't disturb the tenants. .. two units are one bedroom/one bathroom per unit, one unit is a single and one unit is three bedrooms/one bathroom, please call the Agent for more information, separate gas and electric meter for each unit.
Key facts
- Fully rented
- 6,354 sq ft lot
- Built 1933
Tags
Neighborhood map
What this means for you Summary
Snapshot
- This is a 2×1bd/1ba + 1×3bd/1ba + 1×?bd/1ba units multifamily listed at $849k.
Deal economics
- At list price, monthly cash flow is $2k ($20k/yr) — positive. Per door: $425/mo.
- The deal already cash-flows at list — no discount required.
- Meets the 1% rule at list price ($9k rent vs $849k).
- Recommended offer: $798k (6.0% below list) — sets the bar for market timing.
- Cap rate 8.7% vs local median 2.1% in Los Angeles — top-decile yield for the area; either an underpriced asset or a hidden risk that comps aren't pricing in. Stress-test before assuming the spread holds.
Location & tenants
- Location reads 68/100 on livability (#273 in CA) — a middle-class / working-renter tenant base. Strengths: amenities A+, commute A+, employment B; Watch: health & safety C-, schools D+, crime F.
- Los Angeles Unified (urban): math 29% / reading 54% proficiency, ranked #223 of 517 in CA (top 43%) — families likely to look elsewhere, expect single-tenant / working-renter base with shorter leases; 67% free/reduced lunch — lower-income household profile, screen leases tightly.
- Market conditions: Rents flat; 161 active listings in the ZIP; 19,697 units permitted in Los Angeles County in 2024 (9,426 in 5+ unit buildings).
- At $8,685/mo this rent would consume 186% of the median local household income ($56k/yr) (locally 4550% of renters already pay >50% of income on rent) — very limited rent-growth headroom before tenants either downsize or default.
Forward outlook
- Local home prices are declining (-3.0%/yr); year-one equity from $6k of loan paydown is wiped out by about $25k of value loss. Plan a longer hold.
- Los Angeles County population projected at +9% by 2050 — modest demand growth; plan on rents tracking national, not racing it.
Negotiation context
- It's been on market 80 days — a 6% lower offer ($798k) is reasonable based on typical stale-listing flexibility.
- 6 sale attempts since 27y ago with the ask held roughly flat each time — persistent listings suggest the price (not the market) is what's stuck; bring a comps-based counter.
- Current owner paid $250k; list at $849k implies a 240% gain — meaningful room to come down on a strong offer.
Risks & watch-outs
- Watch-outs: built in 1933 — expect roof / HVAC / electrical / plumbing capex.
- Climate carrying-cost: extreme-heat days projected 7→20/yr by 2055 (HVAC capex compounding) — expect insurance premiums to compound above CPI over the hold.
Questions for the listing agent
- It's been on market 80 days. Have you received any prior offers? Is the seller open to a 6% concession, seller financing, or rate buy-down credit?
- Can we see the unit-by-unit rent roll, current vacancy, and any below-market leases? What's the average tenancy length?
- What capital expenditures (roof, boiler, parking lot, exteriors) have been made in the last 5 years, and what's planned in the next 2?
- Built in 1933 — when were the roof, HVAC, electrical panel, plumbing, and water heater last replaced?
- Why hasn't it sold? Are there any deal-killer items the seller is aware of (foundation, flood, title, zoning, code violations)?
- Is there a deadline driving the sale (1031 exchange, divorce, estate, relocation)? That informs how much negotiation room exists.
- Schools are D-rated, which usually means shorter tenancies and higher turnover. Who's the typical renter profile here, and what's been the actual vacancy rate?
- Crime grade is F in this area — have there been break-ins, vandalism, or insurance claims at this property in the last 3 years? What carrier currently insures it and at what premium?
- What's the average days-on-market for RENTAL listings here right now (not sales)? A rising rental-DOM trend means longer vacancies and softer asking-rent achievability than the comps imply.
- What's the recent tenant-quality profile in this submarket — average credit score on applications, eviction rate, late-payment / NSF rate, and stable-employment percentage? A property-management company in the area should have these aggregated.
- How much new apartment / multifamily construction is in the pipeline within 1–3 miles? Heavy new supply (>2% of stock underway) typically softens rents 12–24 months out; light construction supports rent growth.
Investment metrics
- 1% rule
- 1.02% ✓
- Cap rate
- 8.69%
- Cash-on-cash
- 8.57%
- DSCR
- 1.38
- GRM
- 8.1
CMA / ARV
- ARV (median comp)
- $775,224
- List price
- $849,000
- Delta
- 9.52%
- Verdict
- FAIR
- Comps
- 20 within 1.0 mi
Show comp detail 7 sales within ~0.75 mi
| Address | Dist | Beds/Ba | Sqft | Sold | Price | $/sf | Match |
|---|---|---|---|---|---|---|---|
| 431 W 78th | 0.12mi | 7/4.0 (-1) | 2,415 (-6%) | 0mo | $900,000 | $373 | 80 |
| 431 W 81st St | 0.29mi | 7/3.0 (-1) | 2,539 (-1%) | 3mo | $920,000 | $362 | 74 |
| 8027 S Figueroa St | 0.35mi | 8/4.0 | 2,688 (+5%) | 3mo | $665,000 | $247 | 73 |
| 218 E 76th Pl | 0.50mi | 8/4.0 | 2,712 (+6%) | 4mo | $605,000 | $223 | 64 |
| 820 W 80th St | 0.53mi | 7/5.0 (-1) | 2,698 (+6%) | 1mo | $950,000 | $352 | 56 |
| 241 W 84th St | 0.48mi | 8/4.0 | 2,880 (+13%) | 18mo | $1,100,000 | $382 | 42 |
| 108 W 84th St | 0.58mi | 9/5.0 (+1) | 2,783 (+9%) | 18mo | $915,000 | $329 | 34 |
Match score weights: distance 35% · size 25% · config 20% · recency 20%. Top-matched comps best support the ARV.
Projected returns pro-forma
-3.0% appreciation · 0.11% rent growth · sell at horizon
- IRR
- -6.3%
- Equity multiple
- 0.77×
- Total profit
- $-54,264
- Equity at exit
- $126,589
- IRR
- -0.3%
- Equity multiple
- 0.98×
- Total profit
- $-4,273
- Equity at exit
- $73,406
Cash invested: $237,720 (down + closing). Projections, not guarantees.
Landlord ↔ Tenant lean methodology
- Overall (CITY)
- 0 Strongly Tenant-Friendly
- State California
- 18 Strongly Tenant-Friendly · D+13
- County
- — inherits STATE
- City Los Angeles
- 0 Strongly Tenant-Friendly · D+22
ZIP-level market 90003
- Rents YoY
- 0.1%
- Active inventory
- 161
- Price-to-rent
- 34.4×
Monthly cashflow live
- Estimated rent
- $8,685 high interval (Pro) →
- Mortgage (P&I)
- −$4,452
- Tax from tax record
- −$357 /mo · $4,284/yr
- Insurance
- −$354
- HOA
- −$0
- Vacancy / Maint / Mgmt
- −$1,824
- Net cashflow
- $1,698
Break-even live
4-unit breakdown (identical units grouped — click to expand)
| Units | Beds | Baths | Est. rent |
|---|---|---|---|
| 2× units | 1 | 1 | $4,116 |
| #1 | 1 | 1 | $2,058 |
| #2 | 1 | 1 | $2,058 |
| 1× unit | 3 | 1 | $2,548 |
| 1× unit | 0 | 1 | $2,020 |
| Total (4 units) | $8,685 | ||
UW: 25.0% down · 7.5% · 30yr · 1.5% tax · 5.0% vac · 8.0% maint · 8.0% mgmt
Financing live
Cash to close
- Down payment
- $212,250
- Closing costs
- $25,470
- Reserves months
- —
- Total cash needed
- —
Loan-product check · same deal, 3 products live
Conventional
25% down · 7.5% · 30yr
- Down + closing
- —
- Monthly P&I
- —
- Monthly cashflow
- —
- DSCR
- —
- Eligible?
- —
Personal DTI + credit; lowest rate.
DSCR
20% down · 8.5% · 30yr
- Down + closing
- —
- Monthly P&I
- —
- Monthly cashflow
- —
- DSCR
- —
- Eligible?
- —
No personal income docs; deal must DSCR.
Hard money
10% down · 12.0% · 12mo
- Down + closing
- —
- Monthly P&I
- —
- Monthly cashflow
- —
- DSCR
- —
- Eligible?
- —
Short-term bridge; refi at stabilization.
Listing history 32 events
-
2026-06-18days on market $849,000 Active 80 DOM
-
2026-06-17days on market $849,000 Active 79 DOM
-
2026-06-16days on market $849,000 Active 78 DOM
-
2026-06-15days on market $849,000 Active 77 DOM
-
2026-06-13days on market $849,000 Active 75 DOM
-
2026-06-09days on market $849,000 Active 71 DOM
-
2026-06-08days on market $849,000 Active 70 DOM
-
2026-06-07days on market $849,000 Active 69 DOM
-
2026-06-04days on market $849,000 Active 66 DOM
-
2026-06-03days on market $849,000 Active 65 DOM
-
2026-06-02days on market $849,000 Active 64 DOM
-
2026-06-01days on market $849,000 Active 63 DOM
-
2026-05-31days on market $849,000 Active 62 DOM
-
2026-03-30$849,000 Active 295-char remark
Show marketing remark (295 chars)
Four units located at 343 W 77th St Los Angeles, CA. Please don't disturb the tenants. .. two units are one bedroom/one bathroom per unit, one unit is a single and one unit is three bedrooms/one bathroom, please call the Agent for more information, separate gas and electric meter for each unit.
-
2012-05-10soldstatus $250,000
-
2012-04-13soldstatus $240,000 Closed 139-char remark
Show marketing remark (139 chars)
Great Income Property. A lot of potential; Needs some TLC. This is a Short Sale. All terms and conditions are subject to Lender's approval.
-
2012-02-13status Pending 139-char remark
Show marketing remark (139 chars)
Great Income Property. A lot of potential; Needs some TLC. This is a Short Sale. All terms and conditions are subject to Lender's approval.
-
2012-01-25status Active 139-char remark
Show marketing remark (139 chars)
Great Income Property. A lot of potential; Needs some TLC. This is a Short Sale. All terms and conditions are subject to Lender's approval.
-
2012-01-17historical Hold 139-char remark
Show marketing remark (139 chars)
Great Income Property. A lot of potential; Needs some TLC. This is a Short Sale. All terms and conditions are subject to Lender's approval.
-
2011-11-29price $250,000 139-char remark
Show marketing remark (139 chars)
Great Income Property. A lot of potential; Needs some TLC. This is a Short Sale. All terms and conditions are subject to Lender's approval.
-
2011-10-19price $260,000 139-char remark
Show marketing remark (139 chars)
Great Income Property. A lot of potential; Needs some TLC. This is a Short Sale. All terms and conditions are subject to Lender's approval.
-
2011-09-22$270,000 Active 139-char remark
Show marketing remark (139 chars)
Great Income Property. A lot of potential; Needs some TLC. This is a Short Sale. All terms and conditions are subject to Lender's approval.
-
2002-08-02soldstatus $210,000
-
2002-08-02soldstatus $210,000
-
2002-06-13historical
-
2002-06-05$215,000
-
2001-02-14historical
-
2000-10-20
-
2000-05-01historical
-
1999-12-13$204,900
-
1992-06-02soldstatus $195,000
-
1992-06-02soldstatus $195,000
ⓘ Source: listings_history table (triggers on properties + properties_extension) + one-shot
backfill from property_details.listing_events for pre-trigger history.
Tax reassessment forecast CA · Resets to sale price
- Current annual tax
- $4,284 · $357/mo
- Projected year-2 tax
- $6,452 · $538/mo
- Expected delta
- +$2,169/yr (+$181/mo · 50.6%)
ⓘ Screening estimate from a state-policy table — verify with the county assessor before closing.
Climate risk First Street
- Flood 1/10 Low FEMA zone X (unshaded) · 0% chance over 30 yrs
- Wildfire 1/10 Low
- Heat 5/10 Major 7 d/yr ≥88°F today · 20 d/yr by 30 yrs out
- Wind 1/10 Low
- Air quality 5/10 Major 7 unhealthy d/yr today · 7 by 30 yrs out
Nearby sold comps map
Loading sold comps map…
Walkable amenities ~0.75 mi
Loading nearby amenities…
Taxation est. · year 1
- Rental income
- $104,220
- − Mortgage interest
- −$47,557
- − Property taxes
- −$4,284
- − Insurance
- −$4,245
- − Repairs & maintenance
- −$8,338
- − Management
- −$8,338
- − Depreciation
- −$24,698
- Taxable income
- $6,761
- Est. tax owed @ 24.0%
- −$1,623
- After-tax cash flow
- $18,756/yr
For passive investors: Depreciation is non-cash, so a rental often shows a tax loss while cash-flowing — sheltering income. Rental losses are passive: they offset passive income freely, and up to $25,000/yr can offset ordinary (W-2) income if you actively participate and your MAGI is under $100k (phasing out to $0 by $150k); unused losses carry forward. On sale, claimed depreciation is recaptured at up to 25%, and gains may owe capital-gains tax (a 1031 exchange can defer both). Figures are a year-1 estimate at your 24.0% rate — not tax advice; consult a CPA.
Schools (NCES district)
- District
- Los Angeles Unified
- NCES district ID
- 0622710
- Math proficiency
- 29% ▼ -4.00%
- Reading proficiency
- 54% ▲ 10.00%
- Median HH income
- $50,403
- Composite
- 35.67/100
- National rank
- #4875
- State rank
- #223 of 517 in CA
Livability — Los Angeles
- Score
- 68/100
- State rank
- #273
- US rank
- #9237
Category grades
Schools grade is shown separately in the Schools card above.
Census & demographics
- Census place
- Los Angeles, CA
- County
- Los Angeles County · 9,444,647 people
- City population
- 3,838,149
- Metro
- Los Angeles-Long Beach-Anaheim, CA
- Population (ZIP)
- 70,065
- Household income
- $56,030
- Rent vs Own
- Severe rent burden
- 4550.0
Population outlook (Los Angeles County) Hauer SSP2
- Today (2025)
- 10,940,515 people
- By 2030
- 11,256,481 · +2.9%
- By 2040
- 11,729,929 · +7.2%
- By 2050
- 11,948,407 · +9.2%
- By 2075
- 11,818,114 · +8.0%
- By 2100
- 10,842,928 · -0.9%
Race, ethnicity, and origin ACS 2023
- Neighborhood character
- Predominantly Hispanic (81%)
- Race & ethnicity
- Hispanic / Latino 81% Two or more races 20% Black 16% Native American 1%
- Hispanic origin (detail)
- Mexican 51%
- Common ancestry
- British 1%
- Foreign-born
- 40% · Canada
- Languages at home
- 24% English-only · Spanish 75%
Political lean MEDSL · Los Angeles
- 2024 margin
- Solid D (+32.9) · D 64.8% · R 31.9% · Other 3.3%
- 2008→2024 swing
- -7.4pp toward R · 2008: 40.4pp · 2024: 32.9pp
- All cycles
- 2024: D+32.9 2020: D+44.2 2016: D+48.0 2012: D+40.0 2008: D+40.4
Not yet ingested
- Civics
- —
Market trends
- HPI YoY
- ▼ -785.95%
- Current HPI
- 512.5667
- Rent YoY
- ▲ 0.11%
- Metro
- Los Angeles-Long Beach-Anaheim, CA
- State GDP YoY
- ▲ 3.21%
- F500 in state
- 116
Industry mix (Fortune 500 HQ in CA)
| Industry | F500 HQs | Revenue |
|---|---|---|
| Technology | 27 | $1,492B |
|
||
| Financial Services | 3 | $174B |
|
||
| Retail | 3 | $44B |
|
||
| Insurance | 3 | $26B |
|
||
| Media / Entertainment | 2 | $115B |
|
||
| Pharmaceuticals / Biotech | 2 | $62B |
|
||
Price history
+335.4% since first listed19 events — show timeline
- 2026-03-30 Listed $849,000 CRMLS
- 2012-05-10 Sold (Public Records) $250,000 Public Records
- 2012-04-13 Sold (MLS) $240,000 CRMLS
- 2012-02-13 Pending — CRMLS
- 2012-01-25 Relisted — CRMLS
- 2012-01-17 Delisted — CRMLS
- 2011-11-29 Price Changed $250,000 CRMLS
- 2011-10-19 Price Changed $260,000 CRMLS
- 2011-09-22 Listed $270,000 CRMLS
- 2002-08-02 Sold (Public Records) $210,000 Public Records
- 2002-08-02 Sold (MLS) $210,000 TheMLS
- 2002-06-13 Delisted — TheMLS
- 2002-06-05 Listed $215,000 TheMLS
- 2001-02-14 Delisted — TheMLS
- 2000-10-20 Listed — TheMLS
- 2000-05-01 Listing Removed — CRMLS
- 1999-12-13 Listed $204,900 CRMLS
- 1992-06-02 Sold (Public Records) $195,000 Public Records
- 1992-06-02 Sold (Public Records) $195,000 Public Records
Property tax history
-1.3%/yrLatest (2025): $4,284 · +2.5% YoY. Source: county tax records.
Cash-flow waterfall
monthlySold comps — $/sqft
last 12 mo · ≤1 miLoading sold comps…