7560 Liberty Rd · Solon, OH
Flood risk 1/10 · Minimal
- FEMA flood zone
- X (unshaded)
- Chance of flooding over 30 yrs
- 0.0%
- Est. flood insurance / yr
- $473 – $860
Fire risk 1/10 · Minimal
- Est. fire insurance / yr
- $713 – $1,323
Heat risk 2/10 · Minimal
- Hot days now (above 96°F)
- 7 days/yr
- Hot days in 30 yrs
- 16 days/yr
Wind risk 1/10 · Minimal
- Chance of severe wind over 30 yrs
- —
Air-quality risk 3/10 · Minor
- Unhealthy air days now
- 2 days/yr
- Unhealthy air days in 30 yrs
- 4 days/yr
Risk factors via First Street. Map © Google.
Why this score? — see what drove the F grade
The composite is a weighted blend of 9 inputs, each scored 0–100. Each bar is that input's sub-score; the figure is the points it added to the 100-point composite (weight × sub-score).
- ARV discount +8.2/15.0
- Schools +8.1/10.0
- Cash flow +5.9/30.0
- Livability +4.5/5.0
- Rent growth +2.5/5.0
- Condition / age +2.5/5.0
- 1% rule +1.2/10.0
- DSCR +0.2/10.0
- Appreciation +0.0/10.0
$375,000
🖨 Deal sheet 📄 Offer letter ✓ Due diligence
Listing remarks
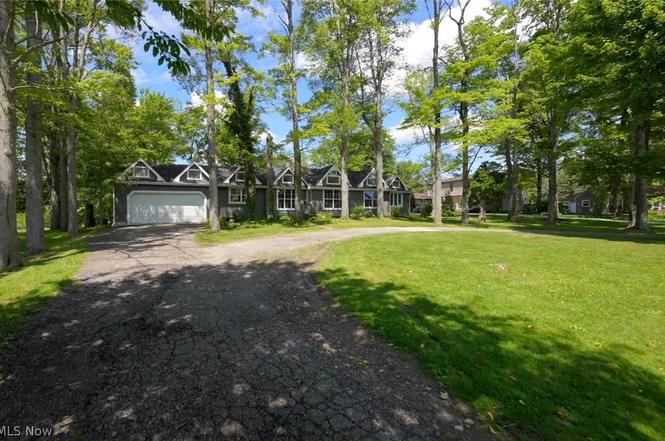
Welcome Home! Turn the Key and Move Right Into This Exceptional Opportunity! This 4 Bedroom, 2 Full Bath, Ranch Style Home w/ over 2k Total Square Feet Located on 2 Acres Backing up to a Nature Preserve is Waiting for You to Call Home! This Home Has Been in the Family Since the Late 1940's, w/ Love and Generations of Memories. Completely Modernized Home to Elevate this Property to a New Level of Appeal! Home Meticulously Combines Style and Functionality w/ the Refreshed Design Adding Beauty and Practicality for Everyday Living. Rare Opportunity to Own a Turn Key Home w/ Provided Space Both Inside & Out in Solon Award Winning School System! Gleaming Hardwood Floors, Vaulted Ceilings, 1
Key facts
- 2 acre lot
- 2 garage spots
- Built 1941
Property features AI
Exterior
- Parking: Attached 2-car garage with garage door opener
- Utilities: Public water; Public sewer
- Home design: Single-story; Updated/remodeled condition; Block foundation
- Construction: Wood siding; Asphalt/fiberglass roof; Built according to public records
- Exterior features: Circular driveway; Drive-through access; Garage faces front; Asphalt driveway
Interior
- Kitchen: Range; Microwave; Dishwasher; Garbage disposal; Refrigerator; Kitchen island
- Bedrooms: 4 main-level bedrooms
- Bathrooms: 2 full bathrooms (both on the main level)
- Interior features: Beamed ceilings; Ceiling fans; Cathedral ceilings; High ceilings; Vaulted ceilings; Kitchen island
- Laundry & utility: Main-level laundry; Washer; Dryer; Sump pump
Neighborhood map
What this means for you Summary
Snapshot
- This is a 3-bed/1.5-bath single-family listed at $375k.
Deal economics
- At list price, monthly cash flow is $-738 ($-9k/yr) — negative.
- To cash-flow at today's rent, offer at most $245k (34.7% below list).
- To meet the 1% rule (rent ≥ 1% of price), the offer needs to be $231k (38.3% below list).
- Recommended offer: $231k (38.3% below list) — sets the bar for 1% rule.
- Cap rate 3.9% vs local median 2.3% in Solon — top-decile yield for the area; either an underpriced asset or a hidden risk that comps aren't pricing in. Stress-test before assuming the spread holds.
Location & tenants
- Location reads 91/100 on livability (#5 in OH, #42 nationally) — a professional / high-income tenant draw. Strengths: schools A+, crime A+, amenities A+.
- Solon City (suburban): math 89% / reading 93% proficiency, ranked #1 of 656 in OH (top 0%) — strong family-tenant draw, lease renewals of 3-5y typical; only 9% free/reduced lunch — higher-income household profile.
- Market conditions: 101 active listings in the ZIP; 4 comparable units currently listed for rent nearby; rentals lingering (median 44d on market — plan ~5-8 weeks vacancy on turnover, expect pricing pressure); 50% of comp listings sitting > 30 days — soft ceiling on asking rent; high-income renter base; 1,441 units permitted in Cuyahoga County in 2024 (700 in 5+ unit buildings).
Forward outlook
- Local home prices are declining (-3.0%/yr); year-one equity from $3k of loan paydown is wiped out by about $11k of value loss. Plan a longer hold.
- Cuyahoga County population projected to shrink 8% by 2050 — rents likely to lag national; underwrite the cash flow, not the appreciation.
Negotiation context
- Only 1 days on market — expect competitive offers; lowballing is unlikely to land.
- 2 sale attempts since 2y ago with the ask held roughly flat each time — persistent listings suggest the price (not the market) is what's stuck; bring a comps-based counter.
Risks & watch-outs
- Watch-outs: built in 1941 — expect roof / HVAC / electrical / plumbing capex.
Questions for the listing agent
- What do current leases actually rent for vs. the listed asking? Can we see a recent rent roll and the last 12 months of T-12 income?
- Built in 1941 — when were the roof, HVAC, electrical panel, plumbing, and water heater last replaced?
- Is there a deadline driving the sale (1031 exchange, divorce, estate, relocation)? That informs how much negotiation room exists.
- Schools are A-rated — typically a magnet for longer-tenancy family renters. What's the average tenant stay here, and is there a school-zone premium baked into asking?
- The area grade is low — what's the realistic commute time and amenity access for the typical tenant pool here? Any planned neighborhood developments (good or bad) we should know about?
- What's the average days-on-market for RENTAL listings here right now (not sales)? A rising rental-DOM trend means longer vacancies and softer asking-rent achievability than the comps imply.
- What's the recent tenant-quality profile in this submarket — average credit score on applications, eviction rate, late-payment / NSF rate, and stable-employment percentage? A property-management company in the area should have these aggregated.
- How much new for-sale + rental construction is in the pipeline within 1–3 miles? Heavy new supply typically softens prices + rents 12–24 months out; constrained supply supports both.
Investment metrics
- 1% rule
- 0.62% ✗
- Cap rate
- 3.93%
- Cash-on-cash
- -8.43%
- DSCR
- 0.62
- GRM
- 13.5
CMA / ARV
- ARV (on-the-fly)
- $380,700
- Comps found
- 11
Show comp detail 11 sales within ~0.75 mi
| Address | Dist | Beds/Ba | Sqft | Sold | Price | $/sf | Match |
|---|---|---|---|---|---|---|---|
| 10497 Kerwick Ct | 0.62mi | 3/2.0 | 1,583 (-2%) | 6mo | $385,000 | $243 | 60 |
| 11239 Stanley Ln | 0.51mi | 3/2.0 | 1,505 (-7%) | 5mo | $335,000 | $223 | 58 |
| 10492 Kerwick Ct | 0.60mi | 3/3.0 | 1,566 (-3%) | 10mo | $380,000 | $243 | 52 |
| 3087 Aspen Ln | 0.33mi | 2/2.0 (-1) | 1,778 (+10%) | 11mo | $434,900 | $245 | 52 |
| 11227 Frederick Ln | 0.62mi | 3/2.0 | 1,730 (+7%) | 10mo | $359,900 | $208 | 50 |
| 7224 Liberty Rd | 0.67mi | 4/2.0 (+1) | 1,664 (+3%) | 19mo | $435,000 | $261 | 42 |
| 10593 Penny Ln | 0.70mi | 3/2.5 | 1,720 (+6%) | 15mo | $355,000 | $206 | 41 |
| 11230 Frederick Ln | 0.66mi | 2/3.0 (-1) | 1,523 (-6%) | 10mo | $397,720 | $261 | 40 |
| 3079 Landing Ln | 0.57mi | 3/3.5 | 1,790 (+10%) | 12mo | $420,000 | $235 | 38 |
| 35510 Pettibone Rd | 0.72mi | 4/2.0 (+1) | 1,780 (+10%) | 12mo | $385,000 | $216 | 33 |
| 34900 Pettibone Rd | 0.70mi | 3/2.0 | 1,472 (-9%) | 22mo | $330,000 | $224 | 32 |
Match score weights: distance 35% · size 25% · config 20% · recency 20%. Top-matched comps best support the ARV.
Projected returns pro-forma
-3.0% appreciation · 3.0% rent growth · sell at horizon
- IRR
- -31.2%
- Equity multiple
- -0.03×
- Total profit
- $-107,724
- Equity at exit
- $55,914
- IRR
- -34.4%
- Equity multiple
- -0.47×
- Total profit
- $-154,219
- Equity at exit
- $32,423
Cash invested: $105,000 (down + closing). Projections, not guarantees.
Landlord ↔ Tenant lean methodology
- Overall (STATE)
- 73 Landlord-Friendly
- State Ohio
- 73 Landlord-Friendly · R+6
- County
- — inherits STATE
- City
- — inherits STATE
ZIP-level market 44139
- Active inventory
- 101
- Price-to-rent
- 13.5×
Monthly cashflow live
- Estimated rent
- $2,312 medium interval (Pro) →
- Mortgage (P&I)
- −$1,967
- Tax from tax record
- −$441 /mo · $5,297/yr
- Insurance
- −$156
- HOA
- −$0
- Vacancy / Maint / Mgmt
- −$486
- Net cashflow
- $-738
Break-even live
UW: 25.0% down · 7.5% · 30yr · 1.5% tax · 5.0% vac · 8.0% maint · 8.0% mgmt
Financing live
Cash to close
- Down payment
- $93,750
- Closing costs
- $11,250
- Reserves months
- —
- Total cash needed
- —
Loan-product check · same deal, 3 products live
Conventional
25% down · 7.5% · 30yr
- Down + closing
- —
- Monthly P&I
- —
- Monthly cashflow
- —
- DSCR
- —
- Eligible?
- —
Personal DTI + credit; lowest rate.
DSCR
20% down · 8.5% · 30yr
- Down + closing
- —
- Monthly P&I
- —
- Monthly cashflow
- —
- DSCR
- —
- Eligible?
- —
No personal income docs; deal must DSCR.
Hard money
10% down · 12.0% · 12mo
- Down + closing
- —
- Monthly P&I
- —
- Monthly cashflow
- —
- DSCR
- —
- Eligible?
- —
Short-term bridge; refi at stabilization.
Rent comps 4 comps
| Address | Beds | Baths | Sqft | Rent | $/sqft | DOM | Units | Dist |
|---|---|---|---|---|---|---|---|---|
| 7101 Liberty Rd Solon, OH | 4.0 | 2.0 | 1344 | $2,200 | $1.64 | 12d | 1 | 0.91mi |
| 9976 Darrow Rd Twinsburg, OH | 3.0 | 1.5 | 1050 | $1,400 | $1.33 | 43d | 1 | 1.43mi |
| 32450 Cromwell Dr Solon, OH | 1.0–2.0 | 1.0–2.0 | 970 | $1,675 | $1.73 | 1d | 23 | 1.45mi |
| 2487 Warren Pkwy Unit 3 Twinsburg, OH | 3.0 | 1.5 | 1292 | $1,900 | $1.47 | 43d | 1 | 1.47mi |
Listing history 2 events
-
2026-06-19remarks 695-char remark
-
2026-06-19$375,000 Active 1 DOM
ⓘ Source: listings_history table (triggers on properties + properties_extension) + one-shot
backfill from property_details.listing_events for pre-trigger history.
Tax reassessment forecast OH · Partial reset (capped growth)
- Current annual tax
- $5,297 · $441/mo
- Projected year-2 tax
- $5,574 · $464/mo
- Expected delta
- +$276/yr (+$23/mo · 5.2%)
ⓘ Screening estimate from a state-policy table — verify with the county assessor before closing.
Climate risk First Street
- Flood 1/10 Low FEMA zone X (unshaded) · 0% chance over 30 yrs
- Wildfire 1/10 Low
- Heat 2/10 Low 7 d/yr ≥96°F today · 16 d/yr by 30 yrs out
- Wind 1/10 Low
- Air quality 3/10 Moderate 2 unhealthy d/yr today · 4 by 30 yrs out
Nearby sold comps map
Loading sold comps map…
Walkable amenities ~0.75 mi
Loading nearby amenities…
Taxation est. · year 1
- Rental income
- $27,747
- − Mortgage interest
- −$21,006
- − Property taxes
- −$5,297
- − Insurance
- −$1,875
- − Repairs & maintenance
- −$2,220
- − Management
- −$2,220
- − Depreciation
- −$10,909
- Taxable loss
- −$15,780
- Est. tax savings @ 24.0%
- +$3,787
- After-tax cash flow
- $-5,064/yr
For passive investors: Depreciation is non-cash, so a rental often shows a tax loss while cash-flowing — sheltering income. Rental losses are passive: they offset passive income freely, and up to $25,000/yr can offset ordinary (W-2) income if you actively participate and your MAGI is under $100k (phasing out to $0 by $150k); unused losses carry forward. On sale, claimed depreciation is recaptured at up to 25%, and gains may owe capital-gains tax (a 1031 exchange can defer both). Figures are a year-1 estimate at your 24.0% rate — not tax advice; consult a CPA.
Schools (NCES district)
- District
- Solon City
- NCES district ID
- 3904660
- Math proficiency
- 89% ▼ -7.00%
- Reading proficiency
- 93% ▼ -1.00%
- Median HH income
- $95,909
- Composite
- 81.16/100
- National rank
- #42
- State rank
- #1 of 656 in OH
Livability — Solon
- Score
- 91/100
- State rank
- #5
- US rank
- #42
Category grades
Schools grade is shown separately in the Schools card above.
Census & demographics
- Census place
- Solon, OH
- County
- Cuyahoga County · 1,090,369 people
- City population
- 24,706
- Metro
- Cleveland-Elyria, OH
- Population (ZIP)
- 24,706
- Household income
- $138,425
- Rent vs Own
- Severe rent burden
- 368.0
Population outlook (Cuyahoga County) Hauer SSP2
- Today (2025)
- 1,244,621 people
- By 2030
- 1,230,093 · -1.2%
- By 2040
- 1,189,108 · -4.5%
- By 2050
- 1,145,706 · -7.9%
- By 2075
- 1,076,557 · -13.5%
- By 2100
- 978,987 · -21.3%
Race, ethnicity, and origin ACS 2023
- Neighborhood character
- Majority White (65%)
- Race & ethnicity
- White 65% Asian 14% Black 12% Two or more races 7% Hispanic / Latino 3%
- Common ancestry
- Romanian 6% Scotch-Irish 3% Italian 2%
- Foreign-born
- 18% · China, Canada, Vietnam
- Languages at home
- 77% English-only · Chinese 6% Russian/Polish/Slavic 5% Other Indo-European 4%
Political lean MEDSL · Cuyahoga
- 2024 margin
- Solid D (+31.5) · D 65.4% · R 33.9%
- 2008→2024 swing
- -7.4pp toward R · 2008: 38.9pp · 2024: 31.5pp
- All cycles
- 2024: D+31.5 2020: D+34.1 2016: D+35.0 2012: D+38.7 2008: D+38.9
Not yet ingested
- Civics
- —
Market trends
- HPI YoY
- ▼ -196.10%
- Current HPI
- 191.8418
- Rent YoY
- —
- Metro
- Cleveland-Elyria, OH
- State GDP YoY
- ▲ 1.98%
- F500 in state
- 48
Industry mix (Fortune 500 HQ in OH)
| Industry | F500 HQs | Revenue |
|---|---|---|
| Insurance | 3 | $145B |
|
||
| Industrial Machinery | 3 | $49B |
|
||
| Financial Services | 3 | $24B |
|
||
| Consumer Goods | 2 | $93B |
|
||
| Aerospace / Defense | 2 | $47B |
|
||
| Utilities | 2 | $33B |
|
||
Price history
+14900.0% since first listed3 events — show timeline
- 2026-06-19 Listed $375,000 MLSNOW
- 2024-10-08 Rental Removed $2,500 TURBOTENANT
- 2024-09-25 Listed for Rent $2,500 TURBOTENANT
Property tax history
+3.3%/yrLatest (2025): $5,297 · -1.3% YoY. Source: county tax records.
Cash-flow waterfall
monthlySold comps — $/sqft
last 12 mo · ≤1 miLoading sold comps…