1025 42nd Pl N · Birmingham, AL
Flood risk 1/10 · Minimal
- FEMA flood zone
- X (unshaded)
- Chance of flooding over 30 yrs
- 0.0%
- Est. flood insurance / yr
- $507 – $1,088
Fire risk 1/10 · Minimal
- Est. fire insurance / yr
- $916 – $1,700
Heat risk 6/10 · Moderate
- Hot days now (above 106°F)
- 7 days/yr
- Hot days in 30 yrs
- 19 days/yr
Wind risk 6/10 · Moderate
- Chance of severe wind over 30 yrs
- 27.0%
Air-quality risk 4/10 · Minor
- Unhealthy air days now
- 6 days/yr
- Unhealthy air days in 30 yrs
- 8 days/yr
Risk factors via First Street. Map © Google.
Why this score? — see what drove the D grade
The composite is a weighted blend of 9 inputs, each scored 0–100. Each bar is that input's sub-score; the figure is the points it added to the 100-point composite (weight × sub-score).
- Cash flow +15.0/30.0
- ARV discount +7.5/15.0
- 1% rule +5.0/10.0
- DSCR +5.0/10.0
- Livability +3.4/5.0
- Rent growth +2.5/5.0
- Condition / age +2.5/5.0
- Schools +0.9/10.0
- Appreciation +0.0/10.0
$9,000
🖨 Deal sheet 📄 Offer letter ✓ Due diligence
Listing remarks MLS
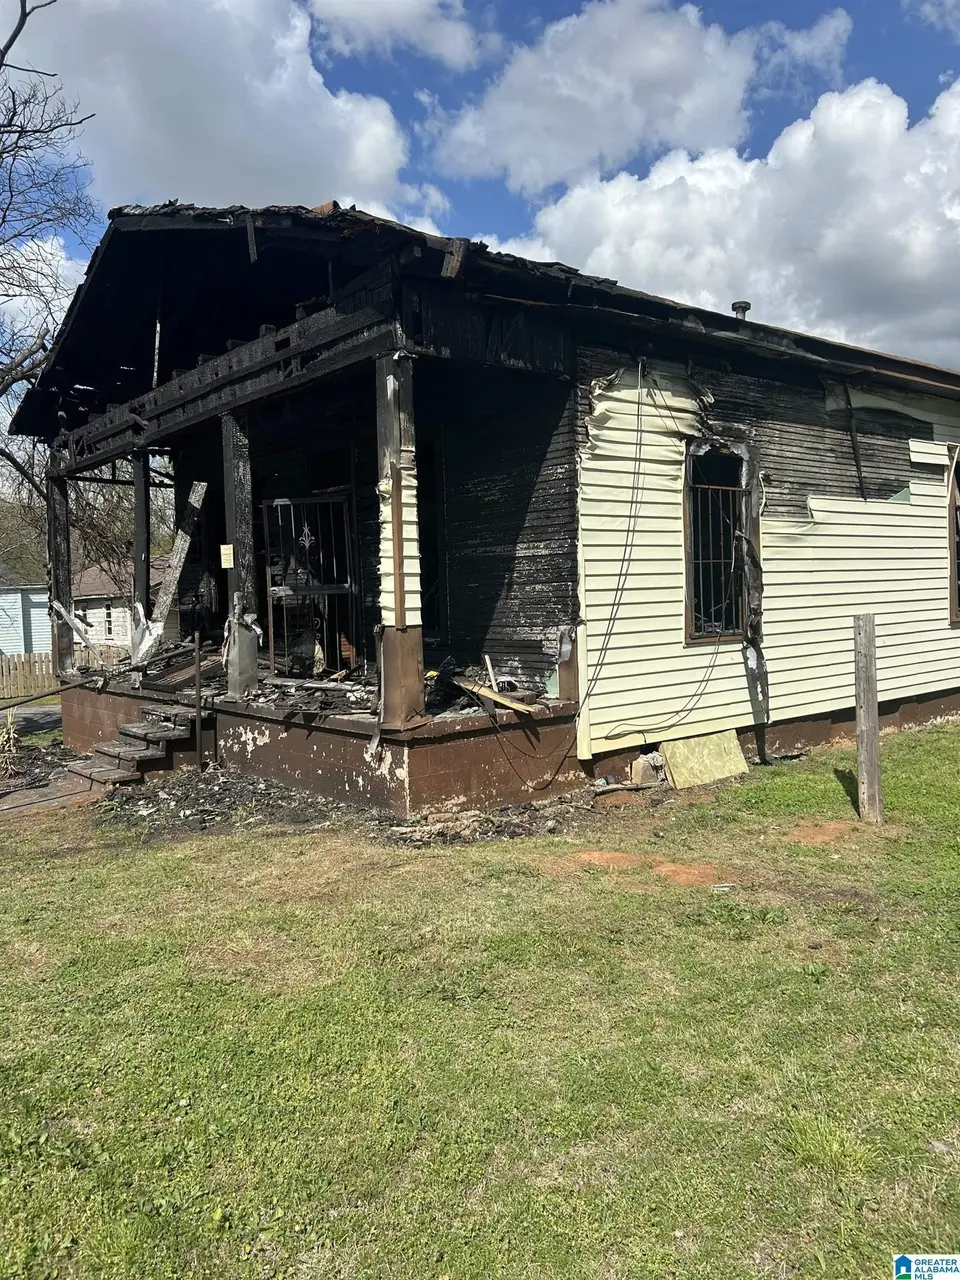
3 bed, 1 bath home with approximately 1,262 sq ft. Property has partial fire damage in the front two rooms and will require renovation. Located in Kingston directly across the street from the new Coca-Cola plant. Property is being sold as-is. Buyer to verify all information. We have an assignable interest in the property and are seeking a quick closing.
Key facts
- 5,662 sq ft lot
- Built 1940
- Listed 54 days
Neighborhood map
What this means for you Summary
Snapshot
- This is a 3-bed/1.0-bath single-family listed at $9k.
Deal economics
- At list price, monthly cash flow is $869 ($10k/yr) — positive.
- The deal already cash-flows at list — no discount required.
- Meets the 1% rule at list price ($1k rent vs $9k).
- Recommended offer: $9k (3.0% below list) — sets the bar for market timing.
- Cap rate 122.2% vs local median 6.2% in Birmingham — top-decile yield for the area; either an underpriced asset or a hidden risk that comps aren't pricing in. Stress-test before assuming the spread holds.
Location & tenants
- Location reads 67/100 on livability (#78 in AL) — a middle-class / working-renter tenant base. Strengths: commute A+, cost of living A+, housing A+; Watch: amenities C-, schools F, crime F.
- Birmingham City (urban): math 4% / reading 20% proficiency, ranked #116 of 129 in AL (top 90%) — low school quality limits family demand, transient renter base, plan for 1-2y turnover; 82% free/reduced lunch — lower-income household profile, screen leases tightly.
- Market conditions: 81 active listings in the ZIP; 37 comparable units currently listed for rent nearby; rentals at typical pace (median 24d on market — plan ~3-4 weeks tenant-placement turnaround); 43% of comp listings sitting > 30 days — soft ceiling on asking rent; lower-income renter base — watch delinquency; 2,114 units permitted in Jefferson County in 2024 (556 in 5+ unit buildings).
- This rent runs 39% of the median local income ($37k/yr) — at the standard rent-burdened threshold; future hikes will face affordability resistance.
Forward outlook
- Local home prices are declining (-3.0%/yr); year-one equity from $62 of loan paydown is wiped out by about $270 of value loss. Plan a longer hold.
- Jefferson County population projected to shrink 4% by 2050 — rents likely to lag national; underwrite the cash flow, not the appreciation.
- At projected returns (-3.0% appreciation + 3.0% rent growth), your $3k cash investment doubles in ~1 year — after that, you're playing with house money.
Negotiation context
- It's been on market 54 days — a 3% lower offer ($9k) is reasonable based on typical stale-listing flexibility.
- Current owner paid $8k; 20% above their basis — modest negotiation headroom, anchor on the comps not their cost.
Risks & watch-outs
- Watch-outs: built in 1940 — expect roof / HVAC / electrical / plumbing capex.
- Climate carrying-cost: major wind risk, 27% chance of damaging wind over 30y; extreme-heat days projected 7→19/yr by 2055 (HVAC capex compounding) — expect insurance premiums to compound above CPI over the hold.
Questions for the listing agent
- It's been on market 54 days. Have you received any prior offers? Is the seller open to a 3% concession, seller financing, or rate buy-down credit?
- Built in 1940 — when were the roof, HVAC, electrical panel, plumbing, and water heater last replaced?
- Is there a deadline driving the sale (1031 exchange, divorce, estate, relocation)? That informs how much negotiation room exists.
- Schools are F-rated, which usually means shorter tenancies and higher turnover. Who's the typical renter profile here, and what's been the actual vacancy rate?
- Crime grade is F in this area — have there been break-ins, vandalism, or insurance claims at this property in the last 3 years? What carrier currently insures it and at what premium?
- The area grade is low — what's the realistic commute time and amenity access for the typical tenant pool here? Any planned neighborhood developments (good or bad) we should know about?
- What's the average days-on-market for RENTAL listings here right now (not sales)? A rising rental-DOM trend means longer vacancies and softer asking-rent achievability than the comps imply.
- What's the recent tenant-quality profile in this submarket — average credit score on applications, eviction rate, late-payment / NSF rate, and stable-employment percentage? A property-management company in the area should have these aggregated.
- How much new for-sale + rental construction is in the pipeline within 1–3 miles? Heavy new supply typically softens prices + rents 12–24 months out; constrained supply supports both.
Investment metrics
- 1% rule
- 13.10% ✓
- Cap rate
- 122.22%
- Cash-on-cash
- 414.03%
- DSCR
- 19.42
- GRM
- 0.6
CMA / ARV
- ARV (median comp)
- $66,662
- List price
- $9,000
- Delta
- -86.50%
- Verdict
- UNDERPRICED
- Comps
- 20 within 1.0 mi
Show comp detail 12 sales within ~0.75 mi
| Address | Dist | Beds/Ba | Sqft | Sold | Price | $/sf | Match |
|---|---|---|---|---|---|---|---|
| 4228 12th Ct N | 0.24mi | 2/2.0 (-1) | 1,254 (+2%) | 15mo | $70,500 | $56 | 64 |
| 833 49th St N | 0.70mi | 3/2.0 | 1,231 (+0%) | 1mo | $200,000 | $162 | 62 |
| 819 45th Pl | 0.40mi | 3/2.0 | 1,279 (+4%) | 11mo | $138,000 | $108 | 62 |
| 904 46th St | 0.35mi | 3/1.0 | 1,130 (-8%) | 12mo | $80,000 | $71 | 60 |
| 1320 45th St | 0.44mi | 3/1.0 | 1,341 (+9%) | 5mo | $106,000 | $79 | 59 |
| 750 39th St | 0.55mi | 3/1.0 | 1,344 (+9%) | 2mo | $21,000 | $16 | 57 |
| 832 49th St N | 0.67mi | 3/2.0 | 1,322 (+8%) | 2mo | $195,000 | $148 | 51 |
| 1401 46th Street Ensley | 0.44mi | 3/1.0 | 1,089 (-11%) | 13mo | $48,356 | $44 | 50 |
| 829 49th St N | 0.70mi | 3/2.0 | 1,322 (+8%) | 1mo | $205,000 | $155 | 50 |
| 837 49th St N | 0.70mi | 3/2.0 | 1,322 (+8%) | 2mo | $200,000 | $151 | 49 |
| 912 48th St N | 0.62mi | 3/1.0 | 1,073 (-13%) | 6mo | $55,000 | $51 | 45 |
| 4105 7th Ave N | 0.59mi | 2/2.0 (-1) | 1,352 (+10%) | 4mo | $73,000 | $54 | 43 |
Match score weights: distance 35% · size 25% · config 20% · recency 20%. Top-matched comps best support the ARV.
Projected returns pro-forma
-3.0% appreciation · 3.0% rent growth · sell at horizon
- IRR
- —
- Equity multiple
- 22.40×
- Total profit
- $53,936
- Equity at exit
- $1,342
- IRR
- —
- Equity multiple
- 47.96×
- Total profit
- $118,345
- Equity at exit
- $778
Cash invested: $2,520 (down + closing). Projections, not guarantees.
Landlord ↔ Tenant lean methodology
- Overall (STATE)
- 90 Strongly Landlord-Friendly
- State Alabama
- 90 Strongly Landlord-Friendly · R+15
- County
- — inherits STATE
- City
- — inherits STATE
ZIP-level market 35212
- Active inventory
- 81
- Price-to-rent
- 0.6×
Monthly cashflow live
- Estimated rent
- $1,179 high interval (Pro) →
- Mortgage (P&I)
- −$47
- Tax est. 1.5%
- −$11 /mo · $135/yr
- Insurance
- −$4
- HOA
- −$0
- Vacancy / Maint / Mgmt
- −$248
- Net cashflow
- $869
Break-even live
UW: 25.0% down · 7.5% · 30yr · 1.5% tax · 5.0% vac · 8.0% maint · 8.0% mgmt
Financing live
Cash to close
- Down payment
- $2,250
- Closing costs
- $270
- Reserves months
- —
- Total cash needed
- —
Loan-product check · same deal, 3 products live
Conventional
25% down · 7.5% · 30yr
- Down + closing
- —
- Monthly P&I
- —
- Monthly cashflow
- —
- DSCR
- —
- Eligible?
- —
Personal DTI + credit; lowest rate.
DSCR
20% down · 8.5% · 30yr
- Down + closing
- —
- Monthly P&I
- —
- Monthly cashflow
- —
- DSCR
- —
- Eligible?
- —
No personal income docs; deal must DSCR.
Hard money
10% down · 12.0% · 12mo
- Down + closing
- —
- Monthly P&I
- —
- Monthly cashflow
- —
- DSCR
- —
- Eligible?
- —
Short-term bridge; refi at stabilization.
Rent comps 37 comps
| Address | Beds | Baths | Sqft | Rent | $/sqft | DOM | Units | Dist |
|---|---|---|---|---|---|---|---|---|
| 1117 42nd Pl N Birmingham, AL | 3.0 | 1.0 | 1026 | $900 | $0.88 | 43d | 1 | 0.04mi |
| 1217 43rd St N Birmingham, AL | 2.0 | 1.0 | 750 | $850 | $1.13 | 43d | 1 | 0.18mi |
| 813 42nd Pl N Birmingham, AL | 3.0 | 2.0 | 1424 | $1,285 | $0.90 | 43d | 1 | 0.27mi |
| 1017 Cahaba St Birmingham, AL | 2.0 | 2.0 | 1035 | $1,350 | $1.30 | 3d | 1 | 0.33mi |
| 4513 13th Ave N Birmingham, AL | 2.0 | 2.0 | 778 | $1,175 | $1.51 | 23d | 1 | 0.40mi |
| 934 47th St N Birmingham, AL | 3.0 | 1.0 | 972 | $1,000 | $1.03 | 23d | 1 | 0.43mi |
| 3920 11th Ave N Birmingham, AL | 3.0 | 2.0 | 1200 | $1,025 | $0.85 | 2d | 1 | 0.44mi |
| 737 47th St N Unit B Birmingham, AL | 2.0 | 1.0 | 706 | $750 | $1.06 | 23d | 1 | 0.52mi |
| 1101 47th St N Birmingham, AL | 3.0 | 2.0 | 1296 | $1,200 | $0.93 | 23d | 1 | 0.53mi |
| 941 47th Pl N Birmingham, AL | 3.0 | 1.0 | 879 | $950 | $1.08 | 23d | 1 | 0.55mi |
| 4108 7th Ave N Birmingham, AL | 3.0 | 1.0 | 1100 | $1,350 | $1.23 | 23d | 1 | 0.58mi |
| 236 48th St N Birmingham, AL | 3.0 | 2.0 | 1318 | $1,750 | $1.33 | 3d | 1 | 0.64mi |
| 1601 48th St N Birmingham, AL | 3.0 | 1.0 | 1313 | $1,200 | $0.91 | 23d | 1 | 0.73mi |
| 821 50th St N Birmingham, AL | 3.0 | 1.5 | 1416 | $1,523 | $1.08 | 1d | 1 | 0.75mi |
| 233 52nd St N Birmingham, AL | 2.0 | 1.0 | 1430 | $1,200 | $0.84 | 43d | 1 | 0.90mi |
| 972 53rd St N Birmingham, AL | 2.0 | 1.0 | 841 | $900 | $1.07 | 43d | 1 | 1.00mi |
| 4345 2nd Ave S Birmingham, AL | 3.0 | 2.0 | 988 | $1,800 | $1.82 | 23d | 1 | 1.06mi |
| 1515 36th Pl N Birmingham, AL | 3.0 | 2.0 | 1204 | $1,273 | $1.06 | 43d | 1 | 1.07mi |
| 1705 52nd St N Birmingham, AL | 3.0 | 1.5 | 1214 | $1,100 | $0.91 | 43d | 1 | 1.11mi |
| 4233 3rd Ave S Birmingham, AL | 2.0 | 1.0 | 750 | $1,150 | $1.53 | 43d | 1 | 1.21mi |
| 3509 Norwood Blvd Birmingham, AL | 2.0 | 1.0 | 943 | $1,100 | $1.17 | 3d | 1 | 1.24mi |
| 4243 4th Ave S Birmingham, AL | 2.0 | 1.0 | 805 | $1,150 | $1.43 | 43d | 1 | 1.26mi |
| 4236 39th Ave N Birmingham, AL | 3.0 | 2.0 | 1000 | $1,195 | $1.20 | 23d | 1 | 1.26mi |
| 4231 40th Ave N Birmingham, AL | 3.0 | 1.0 | 1272 | $850 | $0.67 | 19d | 1 | 1.30mi |
| 4237 5th Ave S Unit 4241-F Birmingham, AL | 2.0 | 1.0 | 725 | $1,098 | $1.51 | 43d | 1 | 1.33mi |
| 4237 5th Ave S Unit 4241-H Birmingham, AL | 2.0 | 1.0 | 725 | $1,115 | $1.54 | 43d | 1 | 1.33mi |
| 4237 5th Ave S Unit 4237-E Birmingham, AL | 2.0 | 1.0 | 725 | $1,135 | $1.57 | 3d | 1 | 1.33mi |
| 620 52nd St S Birmingham, AL | 3.0 | 2.0 | 1346 | $2,750 | $2.04 | 23d | 1 | 1.36mi |
| 4028 40th Ave N Birmingham, AL | 3.0 | 1.0 | 1186 | $950 | $0.80 | 43d | 1 | 1.37mi |
| 5811 2nd Ave N Birmingham, AL | 2.0 | 1.0 | 1000 | $1,200 | $1.20 | 3d | 1 | 1.38mi |
| 4220 40th Ct N Birmingham, AL | 3.0 | 1.0 | 948 | $1,200 | $1.27 | 43d | 1 | 1.38mi |
| 712 47th Way S Birmingham, AL | 2.0 | 1.0 | 1042 | $1,725 | $1.66 | 19d | 1 | 1.39mi |
| 1405 33rd St N Birmingham, AL | 3.0 | 1.0 | 952 | $990 | $1.04 | 23d | 1 | 1.41mi |
| 724 47th Way S Unit 1019289P Birmingham, AL | 2.0 | 1.0 | 1044 | $8,438 | $8.08 | 43d | 1 | 1.42mi |
| 4317 41st Ave N Birmingham, AL | 3.0 | 1.0 | 864 | $1,000 | $1.16 | 43d | 1 | 1.43mi |
| 137 59th St N Unit 3 Birmingham, AL | 2.0 | 1.0 | 800 | $725 | $0.91 | 23d | 1 | 1.45mi |
| 137 59th St N Apt 6 Birmingham, AL | 2.0 | 1.0 | 800 | $725 | $0.91 | 43d | 1 | 1.45mi |
Listing history 4 events
-
2026-05-05price $9,000 355-char remark
Show marketing remark (355 chars)
3 bed, 1 bath home with approximately 1,262 sq ft. Property has partial fire damage in the front two rooms and will require renovation. Located in Kingston directly across the street from the new Coca-Cola plant. Property is being sold as-is. Buyer to verify all information. We have an assignable interest in the property and are seeking a quick closing.
-
2026-04-08price $10,500 355-char remark
Show marketing remark (355 chars)
3 bed, 1 bath home with approximately 1,262 sq ft. Property has partial fire damage in the front two rooms and will require renovation. Located in Kingston directly across the street from the new Coca-Cola plant. Property is being sold as-is. Buyer to verify all information. We have an assignable interest in the property and are seeking a quick closing.
-
2026-04-06$13,500 Active 355-char remark
Show marketing remark (355 chars)
3 bed, 1 bath home with approximately 1,262 sq ft. Property has partial fire damage in the front two rooms and will require renovation. Located in Kingston directly across the street from the new Coca-Cola plant. Property is being sold as-is. Buyer to verify all information. We have an assignable interest in the property and are seeking a quick closing.
-
1988-01-08soldstatus $7,500
ⓘ Source: listings_history table (triggers on properties + properties_extension) + one-shot
backfill from property_details.listing_events for pre-trigger history.
Climate risk First Street
- Flood 1/10 Low FEMA zone X (unshaded) · 0% chance over 30 yrs
- Wildfire 1/10 Low
- Heat 6/10 Major 7 d/yr ≥106°F today · 19 d/yr by 30 yrs out
- Wind 6/10 Major 27% chance of damaging wind over 30 yrs
- Air quality 4/10 Moderate 6 unhealthy d/yr today · 8 by 30 yrs out
Nearby sold comps map
Loading sold comps map…
Walkable amenities ~0.75 mi
Loading nearby amenities…
Taxation est. · year 1
- Rental income
- $14,152
- − Mortgage interest
- −$504
- − Property taxes
- −$135
- − Insurance
- −$45
- − Repairs & maintenance
- −$1,132
- − Management
- −$1,132
- − Depreciation
- −$262
- Taxable income
- $10,942
- Est. tax owed @ 24.0%
- −$2,626
- After-tax cash flow
- $7,808/yr
For passive investors: Depreciation is non-cash, so a rental often shows a tax loss while cash-flowing — sheltering income. Rental losses are passive: they offset passive income freely, and up to $25,000/yr can offset ordinary (W-2) income if you actively participate and your MAGI is under $100k (phasing out to $0 by $150k); unused losses carry forward. On sale, claimed depreciation is recaptured at up to 25%, and gains may owe capital-gains tax (a 1031 exchange can defer both). Figures are a year-1 estimate at your 24.0% rate — not tax advice; consult a CPA.
Schools (NCES district)
- District
- Birmingham City
- NCES district ID
- 0100390
- Math proficiency
- 4% ▼ -17.00%
- Reading proficiency
- 20% ▼ -4.00%
- Median HH income
- $31,988
- Composite
- 9.49/100
- National rank
- #9850
- State rank
- #116 of 129 in AL
Livability — Birmingham
- Score
- 67/100
- State rank
- #78
- US rank
- #10412
Category grades
Schools grade is shown separately in the Schools card above.
Census & demographics
- Census place
- Birmingham, AL
- County
- Jefferson County · 527,445 people
- City population
- 210,422
- Metro
- Birmingham-Hoover, AL
- Population (ZIP)
- 10,160
- Household income
- $36,633
- Rent vs Own
- Severe rent burden
- 798.0
Population outlook (Jefferson County) Hauer SSP2
- Today (2025)
- 669,185 people
- By 2030
- 669,694 · +0.1%
- By 2040
- 661,388 · -1.2%
- By 2050
- 643,086 · -3.9%
- By 2075
- 577,267 · -13.7%
- By 2100
- 474,758 · -29.1%
Race, ethnicity, and origin ACS 2023
- Neighborhood character
- Predominantly Black (68%)
- Race & ethnicity
- Black 68% White 24% Hispanic / Latino 6% Two or more races 3% Asian 1%
- Hispanic origin (detail)
- Mexican 3%
- Common ancestry
- Italian 2% Slovak 2% Hispanic 1%
- Foreign-born
- 3% · Canada
- Languages at home
- 95% English-only · Spanish 3% French/Haitian/Cajun 1%
Political lean MEDSL · Jefferson
- 2024 margin
- D (+10.4) · D 54.6% · R 44.2% · Other 1.2%
- 2008→2024 swing
- +5.4pp toward D · 2008: 5.1pp · 2024: 10.4pp
- All cycles
- 2024: D+10.4 2020: D+13.2 2016: D+7.2 2012: D+6.0 2008: D+5.1
Not yet ingested
- Civics
- —
Market trends
- HPI YoY
- ▼ -190.24%
- Current HPI
- 120.1264
- Rent YoY
- —
- Metro
- Birmingham-Hoover, AL
- State GDP YoY
- ▲ 2.94%
- F500 in state
- 4
Industry mix (Fortune 500 HQ in AL)
| Industry | F500 HQs | Revenue |
|---|---|---|
| Financial Services | 1 | $8B |
|
||
| Healthcare | 1 | $5B |
|
||
Price history
+20.0% since first listed4 events — show timeline
- 2026-05-05 Price Changed $9,000 Greater Alabama MLS
- 2026-04-08 Price Changed $10,500 Greater Alabama MLS
- 2026-04-06 Listed $13,500 Greater Alabama MLS
- 1988-01-08 Sold (Public Records) $7,500 Public Records
Property tax history
+3.2%/yrLatest (2025): $787 · +0.0% YoY. Source: county tax records.
Cash-flow waterfall
monthlySold comps — $/sqft
last 12 mo · ≤1 miLoading sold comps…