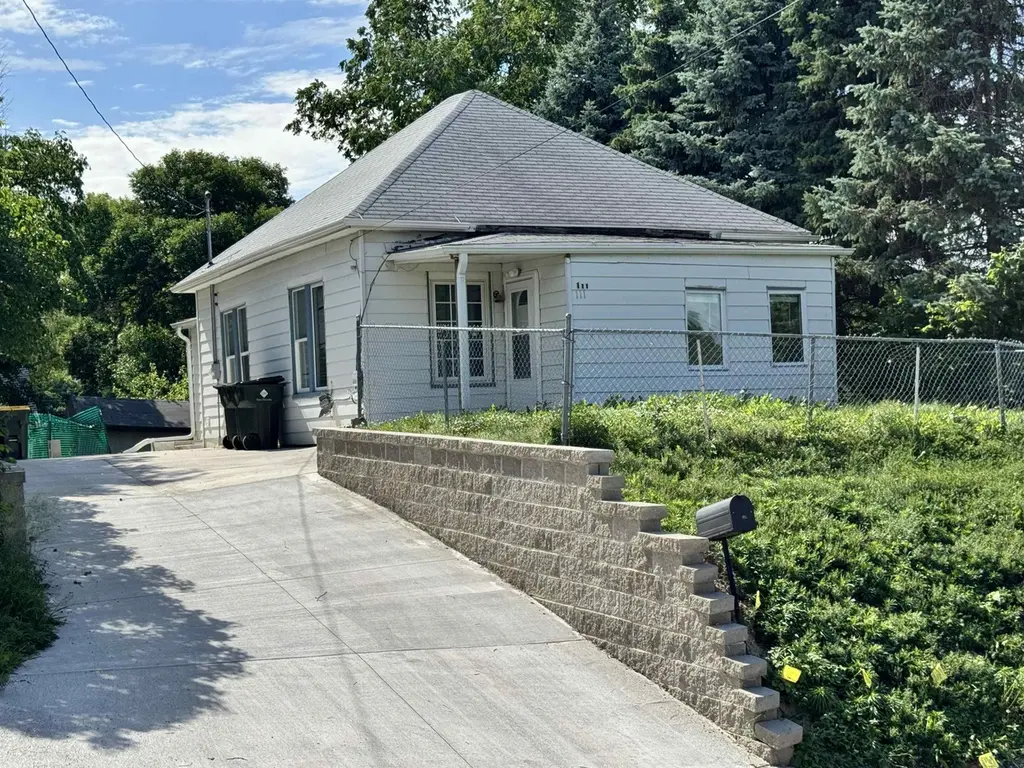
111 S Dorman St · Sioux City, IA
Flood risk 1/10 · Minimal
- FEMA flood zone
- X (unshaded)
- Chance of flooding over 30 yrs
- 0.0%
- Est. flood insurance / yr
- $473 – $860
Fire risk 4/10 · Minor
- Est. fire insurance / yr
- $902 – $1,676
Heat risk 3/10 · Minor
- Hot days now (above 102°F)
- 7 days/yr
- Hot days in 30 yrs
- 15 days/yr
Wind risk 2/10 · Minimal
- Chance of severe wind over 30 yrs
- —
Air-quality risk 1/10 · Minimal
- Unhealthy air days now
- 0 days/yr
- Unhealthy air days in 30 yrs
- 0 days/yr
Risk factors via First Street. Map © Google.
Why this score? — see what drove the B- grade
The composite is a weighted blend of 9 inputs, each scored 0–100. Each bar is that input's sub-score; the figure is the points it added to the 100-point composite (weight × sub-score).
- Cash flow +25.4/30.0
- ARV discount +15.0/15.0
- DSCR +8.4/10.0
- 1% rule +6.2/10.0
- Schools +4.7/10.0
- Livability +3.9/5.0
- Rent growth +2.5/5.0
- Condition / age +2.5/5.0
- Appreciation +0.0/10.0
$89,000
🖨 Deal sheet 📄 Offer letter ✓ Due diligence
Listing remarks MLS
Good starter or investment property, previously rented for 850 dls.
Key facts
- Off street parking
- Newer furnace
- Newer retaining wall
Tags
Property features AI
Exterior
- Parking: Gravel parking
- Utilities: Public water; Public sewer
- Home design: Single-family residence (residential property); Fixer condition
- Construction: Aluminum siding
- Exterior features: Fenced yard; Shingle roof
Interior
- Bathrooms: One 3/4 bathroom
- Heating & cooling: Natural gas forced-air heating
- Interior features: Has basement (partial, crawl space)
- Laundry & utility: Main-level laundry
Neighborhood map
What this means for you Summary
Snapshot
- This is a 2-bed/1.0-bath single-family listed at $89k.
Deal economics
- At list price, monthly cash flow is $206 ($2k/yr) — positive.
- The deal already cash-flows at list — no discount required.
- Meets the 1% rule at list price ($997 rent vs $89k).
- Cap rate 9.1% vs local median 3.7% in Sioux City — top-decile yield for the area; either an underpriced asset or a hidden risk that comps aren't pricing in. Stress-test before assuming the spread holds.
Location & tenants
- Location reads 78/100 on livability (#138 in IA, #2,544 nationally) — a middle-class / working-renter tenant base. Strengths: cost of living A+, housing A+, health & safety A+; Watch: crime F, commute F.
- Sioux City Community School District (urban): math 54% / reading 57% proficiency, ranked #264 of 289 in IA (top 91%) — acceptable for families but not a draw, mixed tenant base, ~2y average lease.
- Zoned schools: Loess Hills Elementary (math 64% / reading 54%, grade B-, #428 of 616 statewide, top 70%, 589 students, 60% FRL); West Middle School (math 54% / reading 54%, grade B-, #206 of 246 statewide, top 84%, 864 students, 48% FRL); West High School (math 44% / reading 58%, grade D+, #308 of 336 statewide, top 92%, 1,252 students, 76% FRL).
- Market conditions: 79 active listings in the ZIP; 1 comparable units currently listed for rent nearby; 170 units permitted in Woodbury County in 2024 (90 in 5+ unit buildings).
Forward outlook
- Local home prices are declining (-3.0%/yr); year-one equity from $615 of loan paydown is wiped out by about $3k of value loss. Plan a longer hold.
Negotiation context
- Only 14 days on market — expect competitive offers; lowballing is unlikely to land.
- 5 sale attempts; this cycle's ask has dropped $6k (6%) from the opening price — seller is motivated, your offer sets the floor, not the list.
- Current owner paid $58k; list at $89k implies a 53% gain — meaningful room to come down on a strong offer.
Risks & watch-outs
- Watch-outs: built in 1909 — expect roof / HVAC / electrical / plumbing capex.
Questions for the listing agent
- Built in 1909 — when were the roof, HVAC, electrical panel, plumbing, and water heater last replaced?
- Is there a deadline driving the sale (1031 exchange, divorce, estate, relocation)? That informs how much negotiation room exists.
- Crime grade is F in this area — have there been break-ins, vandalism, or insurance claims at this property in the last 3 years? What carrier currently insures it and at what premium?
- What's the average days-on-market for RENTAL listings here right now (not sales)? A rising rental-DOM trend means longer vacancies and softer asking-rent achievability than the comps imply.
- What's the recent tenant-quality profile in this submarket — average credit score on applications, eviction rate, late-payment / NSF rate, and stable-employment percentage? A property-management company in the area should have these aggregated.
- How much new for-sale + rental construction is in the pipeline within 1–3 miles? Heavy new supply typically softens prices + rents 12–24 months out; constrained supply supports both.
Investment metrics
- 1% rule
- 1.12% ✓
- Cap rate
- 9.07%
- Cash-on-cash
- 9.90%
- DSCR
- 1.44
- GRM
- 7.4
CMA / ARV
- ARV (on-the-fly)
- $126,392
- Comps found
- 12
Show comp detail 12 sales within ~0.75 mi
| Address | Dist | Beds/Ba | Sqft | Sold | Price | $/sf | Match |
|---|---|---|---|---|---|---|---|
| 307 S Collins St | 0.20mi | 2/1.0 | 870 (+2%) | 5mo | $159,000 | $183 | 83 |
| 2321 W 2nd St | 0.10mi | 2/1.0 | 816 (-4%) | 17mo | $152,000 | $186 | 73 |
| 111 S Dorman St | 0.00mi | 2/1.0 | 764 (-10%) | 11mo | $58,000 | $76 | 73 |
| 204 S John St | 0.22mi | 2/1.0 | 768 (-10%) | 3mo | $80,000 | $104 | 71 |
| 200 S Leonard St | 0.07mi | 1/1.0 (-1) | 772 (-10%) | 15mo | $75,000 | $97 | 63 |
| 301 S John St | 0.24mi | 2/2.0 | 914 (+7%) | 17mo | $155,000 | $170 | 59 |
| 310 & 312 Helmer St | 0.42mi | 3/1.0 (+1) | 948 (+11%) | 4mo | $78,000 | $82 | 54 |
| 615 Colon St | 0.58mi | 2/1.0 | 908 (+6%) | 13mo | $77,500 | $85 | 52 |
| 1815 W Highland Ave | 0.39mi | 1/1.0 (-1) | 730 (-14%) | 5mo | $32,000 | $44 | 49 |
| 1630 W Palmer Ave | 0.58mi | 2/1.0 | 960 (+12%) | 17mo | $142,000 | $148 | 38 |
| 707 Prescott St | 0.57mi | 3/1.0 (+1) | 967 (+13%) | 15mo | $157,000 | $162 | 33 |
| 412 Berry St | 0.72mi | 2/1.0 | 757 (-11%) | 17mo | $190,000 | $251 | 33 |
Match score weights: distance 35% · size 25% · config 20% · recency 20%. Top-matched comps best support the ARV.
Projected returns pro-forma
-3.0% appreciation · 3.0% rent growth · sell at horizon
- IRR
- -1.4%
- Equity multiple
- 0.95×
- Total profit
- $-1,329
- Equity at exit
- $13,270
- IRR
- 8.3%
- Equity multiple
- 1.63×
- Total profit
- $15,687
- Equity at exit
- $7,695
Cash invested: $24,920 (down + closing). Projections, not guarantees.
Landlord ↔ Tenant lean methodology
- Overall (STATE)
- 83 Strongly Landlord-Friendly
- State Iowa
- 83 Strongly Landlord-Friendly · R+6
- County
- — inherits STATE
- City
- — inherits STATE
ZIP-level market 51103
- Home prices YoY
- -23.0%
- Active inventory
- 79
- Price-to-rent
- 7.4×
Monthly cashflow live
- Estimated rent
- $997 medium interval (Pro) →
- Mortgage (P&I)
- −$467
- Tax from tax record
- −$78 /mo · $938/yr
- Insurance
- −$37
- HOA
- −$0
- Vacancy / Maint / Mgmt
- −$209
- Net cashflow
- $206
Break-even live
UW: 25.0% down · 7.5% · 30yr · 1.5% tax · 5.0% vac · 8.0% maint · 8.0% mgmt
Financing live
Cash to close
- Down payment
- $22,250
- Closing costs
- $2,670
- Reserves months
- —
- Total cash needed
- —
Loan-product check · same deal, 3 products live
Conventional
25% down · 7.5% · 30yr
- Down + closing
- —
- Monthly P&I
- —
- Monthly cashflow
- —
- DSCR
- —
- Eligible?
- —
Personal DTI + credit; lowest rate.
DSCR
20% down · 8.5% · 30yr
- Down + closing
- —
- Monthly P&I
- —
- Monthly cashflow
- —
- DSCR
- —
- Eligible?
- —
No personal income docs; deal must DSCR.
Hard money
10% down · 12.0% · 12mo
- Down + closing
- —
- Monthly P&I
- —
- Monthly cashflow
- —
- DSCR
- —
- Eligible?
- —
Short-term bridge; refi at stabilization.
Rent comps 1 comps
| Address | Beds | Baths | Sqft | Rent | $/sqft | DOM | Units | Dist |
|---|---|---|---|---|---|---|---|---|
| 301 Wesley Pkwy Sioux City, IA | 1.0 | 1.0 | 620 | $997 | $1.61 | 44d | 1 | 1.40mi |
Listing history 12 events
-
2026-06-19days on market $89,000 Active 14 DOM
-
2026-06-18days on market $89,000 Active 13 DOM
-
2026-06-17days on market $89,000 Active 12 DOM
-
2026-06-17price $89,000 Active 11 DOM
-
2026-06-16days on market $95,000 Active 11 DOM
-
2026-06-15days on market $95,000 Active 10 DOM
-
2026-06-14days on market $95,000 Active 8 DOM
-
2026-06-12days on market $95,000 Active 7 DOM
-
2026-06-09days on market $95,000 Active 4 DOM
-
2026-06-08days on market $95,000 Active 3 DOM
-
2026-06-07remarks 201-char remark
-
2026-06-07$95,000 Active 2 DOM
ⓘ Source: listings_history table (triggers on properties + properties_extension) + one-shot
backfill from property_details.listing_events for pre-trigger history.
Tax reassessment forecast IA · Partial reset (capped growth)
- Current annual tax
- $938 · $78/mo
- Projected year-2 tax
- $1,168 · $97/mo
- Expected delta
- +$230/yr (+$19/mo · 24.5%)
ⓘ Screening estimate from a state-policy table — verify with the county assessor before closing.
Climate risk First Street
- Flood 1/10 Low FEMA zone X (unshaded) · 0% chance over 30 yrs
- Wildfire 4/10 Moderate
- Heat 3/10 Moderate 7 d/yr ≥102°F today · 15 d/yr by 30 yrs out
- Wind 2/10 Low
- Air quality 1/10 Low 0 unhealthy d/yr today · 0 by 30 yrs out
Nearby sold comps map
Loading sold comps map…
Walkable amenities ~0.75 mi
Loading nearby amenities…
Taxation est. · year 1
- Rental income
- $11,964
- − Mortgage interest
- −$4,985
- − Property taxes
- −$938
- − Insurance
- −$445
- − Repairs & maintenance
- −$957
- − Management
- −$957
- − Depreciation
- −$2,589
- Taxable income
- $1,092
- Est. tax owed @ 24.0%
- −$262
- After-tax cash flow
- $2,206/yr
For passive investors: Depreciation is non-cash, so a rental often shows a tax loss while cash-flowing — sheltering income. Rental losses are passive: they offset passive income freely, and up to $25,000/yr can offset ordinary (W-2) income if you actively participate and your MAGI is under $100k (phasing out to $0 by $150k); unused losses carry forward. On sale, claimed depreciation is recaptured at up to 25%, and gains may owe capital-gains tax (a 1031 exchange can defer both). Figures are a year-1 estimate at your 24.0% rate — not tax advice; consult a CPA.
Schools (NCES district)
- District
- Sioux City Community School District
- NCES district ID
- 1926400
- Math proficiency
- 54% ▼ -7.00%
- Reading proficiency
- 57% ▼ -2.00%
- Median HH income
- $44,967
- Composite
- 46.86/100
- National rank
- #2371
- State rank
- #264 of 289 in IA
Livability — Sioux City
- Score
- 78/100
- State rank
- #138
- US rank
- #2544
Category grades
Schools grade is shown separately in the Schools card above.
Census & demographics
- Census place
- Sioux City, IA
- City population
- 51,789
- Population (ZIP)
- 17,145
Population outlook (Woodbury County) Hauer SSP2
- Today (2025)
- 103,226 people
- By 2030
- 103,060 · -0.2%
- By 2040
- 102,533 · -0.7%
- By 2050
- 102,788 · -0.4%
- By 2075
- 107,227 · +3.9%
- By 2100
- 113,980 · +10.4%
Race, ethnicity, and origin ACS 2023
- Neighborhood character
- Diverse neighborhood (Simpson 0.62)
- Race & ethnicity
- White 53% Hispanic / Latino 31% Two or more races 18% Asian 4% Black 4% Native American 4%
- Hispanic origin (detail)
- Mexican 20%
- Common ancestry
- Iranian 3% Portuguese 3% Slovak 2%
- Foreign-born
- 16% · Canada, Vietnam
- Languages at home
- 70% English-only · Spanish 23% Vietnamese 3% German/W. Germanic 1%
Political lean MEDSL · Woodbury
- 2024 margin
- Strong R (+23.0) · D 37.8% · R 60.9% · Other 1.3%
- 2008→2024 swing
- -22.5pp toward R · 2008: -0.5pp · 2024: -23.0pp
- All cycles
- 2024: R+23.0 2020: R+15.5 2016: R+19.9 2012: R+0.2 2008: R+0.5
Not yet ingested
- Civics
- —
Market trends
- HPI YoY
- ▼ -78.41%
- Current HPI
- 262.3809
- Rent YoY
- —
- Metro
- —
- State GDP YoY
- ▲ 2.48%
- F500 in state
- 4
Industry mix (Fortune 500 HQ in IA)
| Industry | F500 HQs | Revenue |
|---|---|---|
| Financial Services | 1 | $16B |
|
||
| Retail / Convenience | 1 | $15B |
|
||
Price history
+427.8% since first listed13 events — show timeline
- 2026-06-05 Listed $95,000 NWIA
- 2025-11-16 Rental Removed $1,100 APPFOLIO
- 2025-10-29 Listed for Rent $1,100 APPFOLIO
- 2025-07-15 Sold (Public Records) $58,000 Public Records
- 2025-07-14 Sold (MLS) $58,000 NWIA
- 2025-06-24 Pending — NWIA
- 2025-06-12 Relisted — NWIA
- 2025-06-12 Price Changed $75,000 NWIA
- 2025-04-23 Relisted — NWIA
- 2025-04-16 Pending — NWIA
- 2025-03-24 Price Changed $85,000 NWIA
- 2025-01-09 Listed $95,000 NWIA
- 2019-06-20 Sold (Public Records) $18,000 Public Records
Property tax history
+9.7%/yrLatest (2025): $938 · +4.0% YoY. Source: county tax records.
Cash-flow waterfall
monthlySold comps — $/sqft
last 12 mo · ≤1 miLoading sold comps…