481 Barger Hl · Kenova, WV
Flood risk 1/10 · Minimal
- FEMA flood zone
- X (unshaded)
- Chance of flooding over 30 yrs
- 0.0%
- Est. flood insurance / yr
- $507 – $1,088
Fire risk 4/10 · Minor
- Est. fire insurance / yr
- $787 – $1,461
Heat risk 4/10 · Minor
- Hot days now (above 101°F)
- 7 days/yr
- Hot days in 30 yrs
- 19 days/yr
Wind risk 2/10 · Minimal
- Chance of severe wind over 30 yrs
- 1.0%
Air-quality risk 2/10 · Minimal
- Unhealthy air days now
- 0 days/yr
- Unhealthy air days in 30 yrs
- 1 days/yr
Risk factors via First Street. Map © Google.
Why this score? — see what drove the C+ grade
The composite is a weighted blend of 9 inputs, each scored 0–100. Each bar is that input's sub-score; the figure is the points it added to the 100-point composite (weight × sub-score).
- Cash flow +24.1/30.0
- ARV discount +15.0/15.0
- DSCR +7.8/10.0
- 1% rule +6.3/10.0
- Livability +4.2/5.0
- Schools +2.6/10.0
- Rent growth +2.5/5.0
- Condition / age +2.5/5.0
- Appreciation +0.0/10.0
$129,900
🖨 Deal sheet 📄 Offer letter ✓ Due diligence
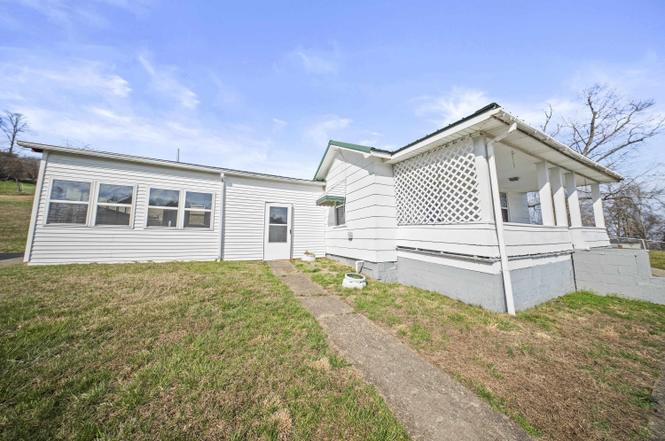
Listing remarks
Fully Furnished Dual-Home Engine on 1.39 Acres – 2 Houses, 1 Low-Stress Investment! Unlock a rare, high-upside opportunity with this expansive 1.39-acre property featuring two independent 2-bedroom, 1-bathroom homes. Perfectly positioned for the savvy investor, this property is being sold fully furnished with all appliances included, making it a true "plug-and-play" asset. Located just minutes from the I-64 corridor, the Huntington Tri-State Airport, and the Marathon Petroleum refinery, the location is a magnet for a steady stream of skilled contractors, corporate commuters, and long-term residents. The value-add potential here is unmatched: take advantage of the current ma
Key facts
- 1.39 acres
- 1.29 acre lot
- Garage
Tags
Neighborhood map
What this means for you Summary
Snapshot
- This is a 4-bed/2.0-bath single-family listed at $130k.
Deal economics
- At list price, monthly cash flow is $257 ($3k/yr) — positive.
- The deal already cash-flows at list — no discount required.
- Meets the 1% rule at list price ($1k rent vs $130k).
- Recommended offer: $126k (3.0% below list) — sets the bar for market timing.
Location & tenants
- Location reads 84/100 on livability (#6 in WV, #796 nationally) — a professional / high-income tenant draw. Strengths: crime A+, commute A+, cost of living A+; Watch: employment D-.
- Wayne County Schools (rural): math 25% / reading 38% proficiency, ranked #25 of 55 in WV (top 46%) — families likely to look elsewhere, expect single-tenant / working-renter base with shorter leases.
- Zoned schools: Ceredo-Kenova Elementary (math 37% / reading 45%, grade F, #107 of 377 statewide, top 28%, 635 students, 0% FRL); Ceredo-Kenova Middle School (math 17% / reading 34%, grade F, #75 of 109 statewide, top 73%, 262 students, 0% FRL); Spring Valley High School (math 17% / reading 47%, grade F, #55 of 110 statewide, top 59%, 910 students, 0% FRL) — zoned schools average 0% FRL vs 46% district-wide (46 pts lower); this property's tenant base skews higher-income than the district average.
- Market conditions: 76 active listings in the ZIP; 67 units permitted in Wayne County in 2024 (0 in 5+ unit buildings).
Forward outlook
- Local home prices are declining (-3.0%/yr); year-one equity from $898 of loan paydown is wiped out by about $4k of value loss. Plan a longer hold.
- Wayne County population projected at -22% by 2050 — secular population decline; favor cash flow + early exit over multi-decade hold.
Negotiation context
- It's been on market 33 days — a 3% lower offer ($126k) is reasonable based on typical stale-listing flexibility.
Risks & watch-outs
- Watch-outs: built in 1945 — expect roof / HVAC / electrical / plumbing capex.
Questions for the listing agent
- It's been on market 33 days. Have you received any prior offers? Is the seller open to a 3% concession, seller financing, or rate buy-down credit?
- Built in 1945 — when were the roof, HVAC, electrical panel, plumbing, and water heater last replaced?
- Is there a deadline driving the sale (1031 exchange, divorce, estate, relocation)? That informs how much negotiation room exists.
- Schools are F-rated, which usually means shorter tenancies and higher turnover. Who's the typical renter profile here, and what's been the actual vacancy rate?
- What's the average days-on-market for RENTAL listings here right now (not sales)? A rising rental-DOM trend means longer vacancies and softer asking-rent achievability than the comps imply.
- What's the recent tenant-quality profile in this submarket — average credit score on applications, eviction rate, late-payment / NSF rate, and stable-employment percentage? A property-management company in the area should have these aggregated.
- How much new for-sale + rental construction is in the pipeline within 1–3 miles? Heavy new supply typically softens prices + rents 12–24 months out; constrained supply supports both.
Investment metrics
- 1% rule
- 1.13% ✓
- Cap rate
- 8.67%
- Cash-on-cash
- 8.47%
- DSCR
- 1.38
- GRM
- 7.4
CMA / ARV
- ARV (on-the-fly)
- $184,704
- Comps found
- 9
Show comp detail 9 sales within ~0.75 mi
| Address | Dist | Beds/Ba | Sqft | Sold | Price | $/sf | Match |
|---|---|---|---|---|---|---|---|
| 1114 Chestnut St | 0.69mi | 4/2.0 | 1,936 (+1%) | 6mo | $232,000 | $120 | 62 |
| 844 Barger Hill Rd | 0.31mi | 3/2.0 (-1) | 1,706 (-11%) | 0mo | $275,000 | $161 | 61 |
| 10 N Oakview Dr | 0.21mi | 4/1.5 | 1,711 (-11%) | 11mo | $165,000 | $96 | 61 |
| 1613 Maple St | 0.45mi | 3/2.0 (-1) | 1,711 (-11%) | 0mo | $72,500 | $42 | 55 |
| 1013 Pine Street St | 0.71mi | 4/1.5 | 2,036 (+6%) | 9mo | $140,000 | $69 | 47 |
| 1816 Poplar St | 0.72mi | 4/2.0 | 2,123 (+10%) | 16mo | $215,000 | $101 | 36 |
| 1821 Pine St | 0.66mi | 3/2.5 (-1) | 1,679 (-13%) | 12mo | $225,000 | $134 | 31 |
| 505 17th St | 0.68mi | 3/1.5 (-1) | 2,136 (+11%) | 17mo | $152,000 | $71 | 29 |
| 1710 Poplar St | 0.69mi | 3/1.5 (-1) | 1,656 (-14%) | 14mo | $125,500 | $76 | 26 |
Match score weights: distance 35% · size 25% · config 20% · recency 20%. Top-matched comps best support the ARV.
Projected returns pro-forma
-3.0% appreciation · 3.0% rent growth · sell at horizon
- IRR
- -3.4%
- Equity multiple
- 0.87×
- Total profit
- $-4,672
- Equity at exit
- $19,369
- IRR
- 6.3%
- Equity multiple
- 1.47×
- Total profit
- $17,081
- Equity at exit
- $11,231
Cash invested: $36,372 (down + closing). Projections, not guarantees.
Landlord ↔ Tenant lean methodology
- Overall (STATE)
- 83 Strongly Landlord-Friendly
- State West Virginia
- 83 Strongly Landlord-Friendly · R+22
- County
- — inherits STATE
- City
- — inherits STATE
ZIP-level market 25704
- Home prices YoY
- -13.7%
- Active inventory
- 76
- Price-to-rent
- 7.4×
Monthly cashflow live
- Estimated rent
- $1,461 medium interval (Pro) →
- Mortgage (P&I)
- −$681
- Tax est. 1.5%
- −$162 /mo · $1,948/yr
- Insurance
- −$54
- HOA
- −$0
- Vacancy / Maint / Mgmt
- −$307
- Net cashflow
- $257
Break-even live
UW: 25.0% down · 7.5% · 30yr · 1.5% tax · 5.0% vac · 8.0% maint · 8.0% mgmt
Financing live
Cash to close
- Down payment
- $32,475
- Closing costs
- $3,897
- Reserves months
- —
- Total cash needed
- —
Loan-product check · same deal, 3 products live
Conventional
25% down · 7.5% · 30yr
- Down + closing
- —
- Monthly P&I
- —
- Monthly cashflow
- —
- DSCR
- —
- Eligible?
- —
Personal DTI + credit; lowest rate.
DSCR
20% down · 8.5% · 30yr
- Down + closing
- —
- Monthly P&I
- —
- Monthly cashflow
- —
- DSCR
- —
- Eligible?
- —
No personal income docs; deal must DSCR.
Hard money
10% down · 12.0% · 12mo
- Down + closing
- —
- Monthly P&I
- —
- Monthly cashflow
- —
- DSCR
- —
- Eligible?
- —
Short-term bridge; refi at stabilization.
Listing history 2 events
-
2026-04-10status Pending
-
2026-03-09$129,900 Active
ⓘ Source: listings_history table (triggers on properties + properties_extension) + one-shot
backfill from property_details.listing_events for pre-trigger history.
Climate risk First Street
- Flood 1/10 Low FEMA zone X (unshaded) · 0% chance over 30 yrs
- Wildfire 4/10 Moderate
- Heat 4/10 Moderate 7 d/yr ≥101°F today · 19 d/yr by 30 yrs out
- Wind 2/10 Low 100% chance of damaging wind over 30 yrs
- Air quality 2/10 Low 0 unhealthy d/yr today · 1 by 30 yrs out
Nearby sold comps map
Loading sold comps map…
Walkable amenities ~0.75 mi
Loading nearby amenities…
Taxation est. · year 1
- Rental income
- $17,537
- − Mortgage interest
- −$7,276
- − Property taxes
- −$1,948
- − Insurance
- −$650
- − Repairs & maintenance
- −$1,403
- − Management
- −$1,403
- − Depreciation
- −$3,779
- Taxable income
- $1,077
- Est. tax owed @ 24.0%
- −$259
- After-tax cash flow
- $2,823/yr
For passive investors: Depreciation is non-cash, so a rental often shows a tax loss while cash-flowing — sheltering income. Rental losses are passive: they offset passive income freely, and up to $25,000/yr can offset ordinary (W-2) income if you actively participate and your MAGI is under $100k (phasing out to $0 by $150k); unused losses carry forward. On sale, claimed depreciation is recaptured at up to 25%, and gains may owe capital-gains tax (a 1031 exchange can defer both). Figures are a year-1 estimate at your 24.0% rate — not tax advice; consult a CPA.
Schools (NCES district)
- District
- Wayne County Schools
- NCES district ID
- 5401500
- Math proficiency
- 25% ▼ -15.00%
- Reading proficiency
- 38% ▼ -10.00%
- Median HH income
- $36,283
- Composite
- 26.08/100
- National rank
- #7297
- State rank
- #25 of 55 in WV
Livability — Kenova
- Score
- 84/100
- State rank
- #6
- US rank
- #796
Category grades
Schools grade is shown separately in the Schools card above.
Census & demographics
- City population
- 25,795
- Population (ZIP)
- 14,413
Population outlook (Wayne County) Hauer SSP2
- Today (2025)
- 38,267 people
- By 2030
- 36,578 · -4.4%
- By 2040
- 33,034 · -13.7%
- By 2050
- 29,671 · -22.5%
- By 2075
- 22,901 · -40.2%
- By 2100
- 17,421 · -54.5%
Race, ethnicity, and origin ACS 2023
- Neighborhood character
- Predominantly White (93%)
- Race & ethnicity
- White 93% Two or more races 5% Black 2%
- Common ancestry
- Italian 3% Serbian 2% Slovak 2%
- Foreign-born
- 1% · Canada
- Languages at home
- 99% English-only · French/Haitian/Cajun 1%
Political lean MEDSL · Wayne
- 2024 margin
- Solid R (+53.4) · D 22.4% · R 75.8% · Other 1.8%
- 2008→2024 swing
- -35.1pp toward R · 2008: -18.2pp · 2024: -53.4pp
- All cycles
- 2024: R+53.4 2020: R+50.1 2016: R+51.3 2012: R+27.0 2008: R+18.2
Not yet ingested
- Civics
- —
Market trends
- HPI YoY
- ▼ -32.21%
- Current HPI
- 202.1322
- Rent YoY
- —
- Metro
- —
- State GDP YoY
- —
- F500 in state
- 0
Price history
2 events — show timeline
- 2026-04-10 Pending — HBRMLS
- 2026-03-09 Listed $129,900 HBRMLS
Cash-flow waterfall
monthlySold comps — $/sqft
last 12 mo · ≤1 miLoading sold comps…