879 Jordan Rd · Autryville, NC
Flood risk 1/10 · Minimal
- FEMA flood zone
- X (unshaded)
- Chance of flooding over 30 yrs
- 0.0%
- Est. flood insurance / yr
- $507 – $1,088
Fire risk 4/10 · Minor
- Est. fire insurance / yr
- $906 – $1,684
Heat risk 7/10 · Major
- Hot days now (above 106°F)
- 7 days/yr
- Hot days in 30 yrs
- 16 days/yr
Wind risk 7/10 · Major
- Chance of severe wind over 30 yrs
- 78.0%
Air-quality risk 1/10 · Minimal
- Unhealthy air days now
- 0 days/yr
- Unhealthy air days in 30 yrs
- 0 days/yr
Risk factors via First Street. Map © Google.
Why this score? — see what drove the B grade
The composite is a weighted blend of 9 inputs, each scored 0–100. Each bar is that input's sub-score; the figure is the points it added to the 100-point composite (weight × sub-score).
- Cash flow +30.0/30.0
- 1% rule +10.0/10.0
- DSCR +10.0/10.0
- ARV discount +7.5/15.0
- Appreciation +6.1/10.0
- Schools +3.4/10.0
- Livability +2.9/5.0
- Rent growth +2.5/5.0
- Condition / age +2.5/5.0
$85,000
🖨 Deal sheet 📄 Offer letter ✓ Due diligence
Listing remarks
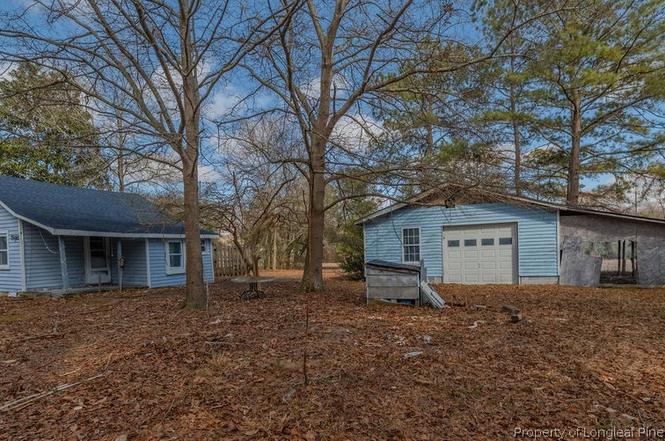
Situated on . 73 acres directly beside the primary residence at 851 Jordan Rd, this 2-bedroom, 1-bath home offers an excellent opportunity and is being sold together with the neighboring property 851 Jordan Rd 4bd, 4 bath, 3730 sqft MLS #758463 , creating a rare multi-property setup. The home features a functional layout and its own private setting, making it ideal for a variety of uses such as a mother-in-law suite, guest house, private home office, or potential rental property. The property also includes a detached garage, offering additional flexibility for storage, workshop space, hobbies, or other multi-use needs. With its own parcel of land, this home provides separation and privacy w
Key facts
- Income potential
- Private setting
- Parcel of land
Tags
Property features AI
Exterior
- Parking: Detached garage (1 covered garage space)
- Utilities: Water from spring and well; Septic system with holding tank
- Home design: Single-family residence; One story
- Construction: Aluminum siding
- Exterior features: Approximately 0.73-acre lot
Interior
- Flooring: Carpet; Vinyl
- Bathrooms: One full bathroom
- Heating & cooling: Central electric air conditioning
- Interior features: Carpet and vinyl flooring; No fireplace; Four total rooms; No basement
Neighborhood map
What this means for you Summary
Snapshot
- This is a 2-bed/1.0-bath other listed at $85k.
Deal economics
- At list price, monthly cash flow is $547 ($7k/yr) — positive.
- The deal already cash-flows at list — no discount required.
- Meets the 1% rule at list price ($1k rent vs $85k).
- Recommended offer: $77k (9.0% below list) — sets the bar for market timing.
Location & tenants
- Location reads 57/100 on livability (#592 in NC) — a working-class tenant base; expect higher turnover. Strengths: cost of living A+, housing B; Watch: schools C-, crime F, amenities F.
- Sampson County Schools (rural): math 40% / reading 41% proficiency, ranked #114 of 178 in NC (top 64%) — families likely to look elsewhere, expect single-tenant / working-renter base with shorter leases; 74% free/reduced lunch — lower-income household profile, screen leases tightly.
- Market conditions: 43 active listings in the ZIP; 189 units permitted in Sampson County in 2024 (0 in 5+ unit buildings).
Forward outlook
- In year one you build about $2k of equity ($588 loan paydown + $2k appreciation (2.2% local appreciation)).
- Sampson County population projected to shrink 5% by 2050 — rents likely to lag national; underwrite the cash flow, not the appreciation.
- At projected returns (2.2% appreciation + 3.0% rent growth), your $24k cash investment doubles in ~3 years — after that, you're playing with house money.
Negotiation context
- It's been on market 97 days — a 9% lower offer ($77k) is reasonable based on typical stale-listing flexibility.
- 2 sale attempts; this cycle's ask has dropped $15k (15%) from the opening price — seller is motivated, your offer sets the floor, not the list.
Risks & watch-outs
- Climate carrying-cost: major wind risk, 78% chance of damaging wind over 30y; extreme-heat days projected 7→16/yr by 2055 (HVAC capex compounding) — expect insurance premiums to compound above CPI over the hold.
Questions for the listing agent
- It's been on market 97 days. Have you received any prior offers? Is the seller open to a 9% concession, seller financing, or rate buy-down credit?
- Built in 1965 — when were the roof, HVAC, electrical panel, plumbing, and water heater last replaced?
- Why hasn't it sold? Are there any deal-killer items the seller is aware of (foundation, flood, title, zoning, code violations)?
- Is there a deadline driving the sale (1031 exchange, divorce, estate, relocation)? That informs how much negotiation room exists.
- Crime grade is F in this area — have there been break-ins, vandalism, or insurance claims at this property in the last 3 years? What carrier currently insures it and at what premium?
- What's the average days-on-market for RENTAL listings here right now (not sales)? A rising rental-DOM trend means longer vacancies and softer asking-rent achievability than the comps imply.
- What's the recent tenant-quality profile in this submarket — average credit score on applications, eviction rate, late-payment / NSF rate, and stable-employment percentage? A property-management company in the area should have these aggregated.
- How much new for-sale + rental construction is in the pipeline within 1–3 miles? Heavy new supply typically softens prices + rents 12–24 months out; constrained supply supports both.
Investment metrics
- 1% rule
- 1.59% ✓
- Cap rate
- 14.02%
- Cash-on-cash
- 27.59%
- DSCR
- 2.23
- GRM
- 5.3
CMA / ARV
No comps found within radius.
Projected returns pro-forma
2.21% appreciation · 3.0% rent growth · sell at horizon
- IRR
- 32.1%
- Equity multiple
- 2.75×
- Total profit
- $41,564
- Equity at exit
- $34,488
- IRR
- 33.2%
- Equity multiple
- 5.35×
- Total profit
- $103,608
- Equity at exit
- $50,412
Cash invested: $23,800 (down + closing). Projections, not guarantees.
Landlord ↔ Tenant lean methodology
- Overall (STATE)
- 85 Strongly Landlord-Friendly
- State North Carolina
- 85 Strongly Landlord-Friendly · R+3
- County
- — inherits STATE
- City
- — inherits STATE
ZIP-level market 28318
- Home prices YoY
- 0.8%
- Active inventory
- 43
- Price-to-rent
- 5.3×
Monthly cashflow live
- Estimated rent
- $1,349 medium interval (Pro) →
- Mortgage (P&I)
- −$446
- Tax from tax record
- −$37 /mo · $444/yr
- Insurance
- −$35
- HOA
- −$0
- Vacancy / Maint / Mgmt
- −$283
- Net cashflow
- $547
Break-even live
UW: 25.0% down · 7.5% · 30yr · 1.5% tax · 5.0% vac · 8.0% maint · 8.0% mgmt
Financing live
Cash to close
- Down payment
- $21,250
- Closing costs
- $2,550
- Reserves months
- —
- Total cash needed
- —
Loan-product check · same deal, 3 products live
Conventional
25% down · 7.5% · 30yr
- Down + closing
- —
- Monthly P&I
- —
- Monthly cashflow
- —
- DSCR
- —
- Eligible?
- —
Personal DTI + credit; lowest rate.
DSCR
20% down · 8.5% · 30yr
- Down + closing
- —
- Monthly P&I
- —
- Monthly cashflow
- —
- DSCR
- —
- Eligible?
- —
No personal income docs; deal must DSCR.
Hard money
10% down · 12.0% · 12mo
- Down + closing
- —
- Monthly P&I
- —
- Monthly cashflow
- —
- DSCR
- —
- Eligible?
- —
Short-term bridge; refi at stabilization.
Listing history 21 events
-
2026-06-18days on market $85,000 Active 97 DOM
-
2026-06-17days on market $85,000 Active 96 DOM
-
2026-06-16days on market $85,000 Active 95 DOM
-
2026-06-15days on market $85,000 Active 94 DOM
-
2026-06-14days on market $85,000 Active 92 DOM
-
2026-06-13days on market $85,000 Active 91 DOM
-
2026-06-10days on market $85,000 Active 89 DOM
-
2026-06-09days on market $85,000 Active 88 DOM
-
2026-06-08days on market $85,000 Active 87 DOM
-
2026-06-07days on market $85,000 Active 86 DOM
-
2026-06-05days on market $85,000 Active 83 DOM
-
2026-06-03days on market $85,000 Active 82 DOM
-
2026-06-02days on market $85,000 Active 81 DOM
-
2026-06-01days on market $85,000 Active 80 DOM
-
2026-05-31days on market $85,000 Active 79 DOM
-
2026-05-30days on market $85,000 Active 78 DOM
-
2026-04-15price $85,000
-
2026-03-31price $92,500
-
2026-03-31status Active
-
2026-03-23status Pending
-
2026-03-03$100,000 Active
ⓘ Source: listings_history table (triggers on properties + properties_extension) + one-shot
backfill from property_details.listing_events for pre-trigger history.
Tax reassessment forecast NC · Resets to sale price
- Current annual tax
- $444 · $37/mo
- Projected year-2 tax
- $697 · $58/mo
- Expected delta
- +$253/yr (+$21/mo · 57.0%)
ⓘ Screening estimate from a state-policy table — verify with the county assessor before closing.
Climate risk First Street
- Flood 1/10 Low FEMA zone X (unshaded) · 0% chance over 30 yrs
- Wildfire 4/10 Moderate
- Heat 7/10 Severe 7 d/yr ≥106°F today · 16 d/yr by 30 yrs out
- Wind 7/10 Severe 78% chance of damaging wind over 30 yrs
- Air quality 1/10 Low 0 unhealthy d/yr today · 0 by 30 yrs out
Nearby sold comps map
Loading sold comps map…
Walkable amenities ~0.75 mi
Loading nearby amenities…
Taxation est. · year 1
- Rental income
- $16,183
- − Mortgage interest
- −$4,761
- − Property taxes
- −$444
- − Insurance
- −$425
- − Repairs & maintenance
- −$1,295
- − Management
- −$1,295
- − Depreciation
- −$2,473
- Taxable income
- $5,491
- Est. tax owed @ 24.0%
- −$1,318
- After-tax cash flow
- $5,249/yr
For passive investors: Depreciation is non-cash, so a rental often shows a tax loss while cash-flowing — sheltering income. Rental losses are passive: they offset passive income freely, and up to $25,000/yr can offset ordinary (W-2) income if you actively participate and your MAGI is under $100k (phasing out to $0 by $150k); unused losses carry forward. On sale, claimed depreciation is recaptured at up to 25%, and gains may owe capital-gains tax (a 1031 exchange can defer both). Figures are a year-1 estimate at your 24.0% rate — not tax advice; consult a CPA.
Schools (NCES district)
- District
- Sampson County Schools
- NCES district ID
- 3704140
- Math proficiency
- 40% ▼ -6.00%
- Reading proficiency
- 41% ▼ -6.00%
- Median HH income
- $37,391
- Composite
- 33.71/100
- National rank
- #5379
- State rank
- #114 of 178 in NC
Livability — Autryville
- Score
- 57/100
- State rank
- #592
- US rank
- #21630
Category grades
Schools grade is shown separately in the Schools card above.
Census & demographics
- Population (ZIP)
- 4,303
Population outlook (Sampson County) Hauer SSP2
- Today (2025)
- 63,499 people
- By 2030
- 62,970 · -0.8%
- By 2040
- 61,609 · -3.0%
- By 2050
- 60,462 · -4.8%
- By 2075
- 60,108 · -5.3%
- By 2100
- 62,120 · -2.2%
Race, ethnicity, and origin ACS 2023
- Neighborhood character
- Predominantly White (69%)
- Race & ethnicity
- White 69% Black 12% Hispanic / Latino 12% Two or more races 2% Asian 2% Native American 1%
- Hispanic origin (detail)
- Mexican 9%
- Common ancestry
- Slovak 2% Serbian 1% Italian 1%
- Foreign-born
- 4% · Canada, China
- Languages at home
- 92% English-only · Spanish 5% Korean 2% Chinese 1%
Political lean MEDSL · Sampson
- 2024 margin
- Strong R (+29.8) · D 34.8% · R 64.6%
- 2008→2024 swing
- -21.3pp toward R · 2008: -8.4pp · 2024: -29.8pp
- All cycles
- 2024: R+29.8 2020: R+22.5 2016: R+16.7 2012: R+11.0 2008: R+8.4
Not yet ingested
- Civics
- —
Market trends
- HPI YoY
- ▲ 2.21%
- Current HPI
- 263.6889
- Rent YoY
- —
- Metro
- —
- State GDP YoY
- ▲ 3.28%
- F500 in state
- 26
Industry mix (Fortune 500 HQ in NC)
| Industry | F500 HQs | Revenue |
|---|---|---|
| Financial Services | 2 | $213B |
|
||
| Retail | 2 | $95B |
|
||
| Industrial Conglomerate | 1 | $38B |
|
||
| Metals / Steel | 1 | $35B |
|
||
| Utilities | 1 | $30B |
|
||
| Industrial Machinery | 1 | $19B |
|
||
Price history
-15.0% since first listed5 events — show timeline
- 2026-04-15 Price Changed $85,000 LPRMLS
- 2026-03-31 Price Changed $92,500 LPRMLS
- 2026-03-31 Relisted — LPRMLS
- 2026-03-23 Pending — LPRMLS
- 2026-03-03 Listed $100,000 LPRMLS
Property tax history
+6.3%/yrLatest (2025): $444 · +10.6% YoY. Source: county tax records.
Cash-flow waterfall
monthlySold comps — $/sqft
last 12 mo · ≤1 miLoading sold comps…