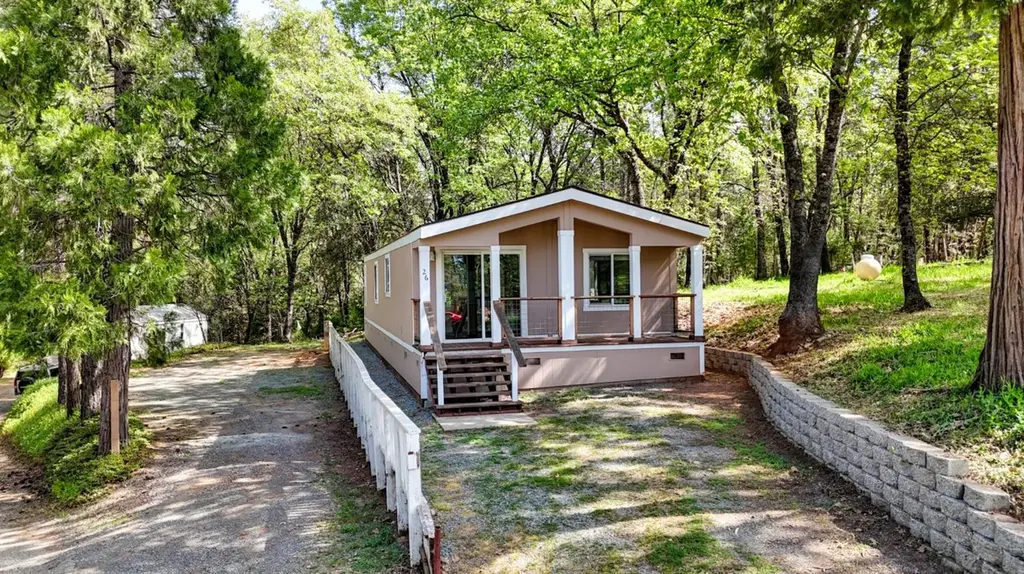
245 Railroad Flat Rd #26 · Rail Road Flat, CA
Flood risk 1/10 · Minimal
- FEMA flood zone
- X (unshaded)
- Chance of flooding over 30 yrs
- 0.0%
- Est. flood insurance / yr
- $507 – $1,088
Fire risk 9/10 · Severe
- Est. fire insurance / yr
- $659 – $1,223
Heat risk 5/10 · Moderate
- Hot days now (above 96°F)
- 7 days/yr
- Hot days in 30 yrs
- 16 days/yr
Wind risk 1/10 · Minimal
- Chance of severe wind over 30 yrs
- —
Air-quality risk 10/10 · Severe
- Unhealthy air days now
- 28 days/yr
- Unhealthy air days in 30 yrs
- 33 days/yr
Risk factors via First Street. Map © Google.
Why this score? — see what drove the B grade
The composite is a weighted blend of 9 inputs, each scored 0–100. Each bar is that input's sub-score; the figure is the points it added to the 100-point composite (weight × sub-score).
- Cash flow +30.0/30.0
- 1% rule +10.0/10.0
- DSCR +10.0/10.0
- ARV discount +7.5/15.0
- Appreciation +5.2/10.0
- Rent growth +2.5/5.0
- Condition / age +2.5/5.0
- Livability +2.4/5.0
- Schools +2.0/10.0
$70,000
🖨 Deal sheet (PDF) 📄 Offer letter ✓ Due diligence
Listing remarks
With private financing available for only $20,000 down, this 2-bedroom, 2-bathroom double-wide mobile home offers an accessible path to homeownership with a monthly home payment of $650 and $500 for space rent. The interior features a spacious open-concept living area with vaulted ceilings and rich, dark wood-style flooring that flows throughout. The kitchen is fully equipped with included appliances and features ample oak cabinetry and a convenient breakfast bar that overlooks the main living space. For added convenience, dedicated laundry hookups are available in-unit. Large windows and sliding glass doors flood the home with natural light and offer peaceful views of the surrounding pines
Key facts
- Ample oak cabinetry
- Vaulted ceilings
- Breakfast bar
Tags
Neighborhood map
What this means for you Summary
Snapshot
- This is a 2-bed/2.0-bath manufactured listed at $70k.
Deal economics
- At list price, monthly cash flow is $461 ($6k/yr) — positive.
- The deal already cash-flows at list — no discount required.
- Meets the 1% rule at list price ($1k rent vs $70k).
- Recommended offer: $68k (3.0% below list) — sets the bar for market timing.
- Cap rate 14.2% vs local median 1.8% in Rail Road Flat — top-decile yield for the area; either an underpriced asset or a hidden risk that comps aren't pricing in. Stress-test before assuming the spread holds.
Location & tenants
- Location reads 48/100 on livability (#1,208 in CA) — a working-class tenant base; expect higher turnover. Watch: schools F, crime F, amenities F.
- Calaveras Unified (rural): math 16% / reading 28% proficiency, ranked #436 of 517 in CA (top 84%) — low school quality limits family demand, transient renter base, plan for 1-2y turnover.
- Market conditions: 56 active listings in the ZIP; 77 units permitted in Calaveras County in 2024 (0 in 5+ unit buildings).
Forward outlook
- In year one you build about $708 of equity ($484 loan paydown + $224 appreciation (0.3% local appreciation)).
- Calaveras County population projected at -18% by 2050 — secular population decline; favor cash flow + early exit over multi-decade hold.
- At projected returns (0.3% appreciation + 3.0% rent growth), your $20k cash investment doubles in ~3 years — after that, you're playing with house money.
Negotiation context
- It's been on market 43 days — a 3% lower offer ($68k) is reasonable based on typical stale-listing flexibility.
Risks & watch-outs
- Climate carrying-cost: severe wildfire risk; extreme-heat days projected 7→16/yr by 2055 (HVAC capex compounding) — expect insurance premiums to compound above CPI over the hold.
Questions for the listing agent
- It's been on market 43 days. Have you received any prior offers? Is the seller open to a 3% concession, seller financing, or rate buy-down credit?
- Is there a deadline driving the sale (1031 exchange, divorce, estate, relocation)? That informs how much negotiation room exists.
- Schools are F-rated, which usually means shorter tenancies and higher turnover. Who's the typical renter profile here, and what's been the actual vacancy rate?
- Crime grade is F in this area — have there been break-ins, vandalism, or insurance claims at this property in the last 3 years? What carrier currently insures it and at what premium?
- What's the average days-on-market for RENTAL listings here right now (not sales)? A rising rental-DOM trend means longer vacancies and softer asking-rent achievability than the comps imply.
- What's the recent tenant-quality profile in this submarket — average credit score on applications, eviction rate, late-payment / NSF rate, and stable-employment percentage? A property-management company in the area should have these aggregated.
- How much new for-sale + rental construction is in the pipeline within 1–3 miles? Heavy new supply typically softens prices + rents 12–24 months out; constrained supply supports both.
Investment metrics
- 1% rule
- 1.62% ✓
- Cap rate
- 14.19%
- Cash-on-cash
- 28.21%
- DSCR
- 2.26
- GRM
- 5.1
CMA / ARV
No comps found within radius.
Projected returns pro-forma
0.32% appreciation · 3.0% rent growth · sell at horizon
- IRR
- 29.2%
- Equity multiple
- 2.45×
- Total profit
- $28,343
- Equity at exit
- $21,453
- IRR
- 32.5%
- Equity multiple
- 4.71×
- Total profit
- $72,811
- Equity at exit
- $26,705
Cash invested: $19,600 (down + closing). Projections, not guarantees.
Landlord ↔ Tenant lean methodology
- Overall (STATE)
- 18 Strongly Tenant-Friendly
- State California
- 18 Strongly Tenant-Friendly · D+13
- County
- — inherits STATE
- City
- — inherits STATE
ZIP-level market 95245
- Home prices YoY
- 0.2%
- Active inventory
- 56
- Price-to-rent
- 5.1×
Monthly cashflow live
- Estimated rent
- $1,134 medium interval (Pro) →
- Mortgage (P&I)
- −$367
- Tax from tax record
- −$39 /mo · $467/yr
- Insurance
- −$29
- HOA
- −$0
- Vacancy / Maint / Mgmt
- −$238
- Net cashflow
- $461
Break-even live
Sensitivity live
| Price | -10% $500 | -5% $481 | +0% $461 | +5% $441 | +10% $421 |
|---|---|---|---|---|---|
| Rent | -10% $371 | -5% $416 | +0% $461 | +5% $506 | +10% $550 |
| Rate | -1.0pp $496 | -0.5pp $479 | base $461 | +0.5pp $443 | +1.0pp $424 |
UW: 25.0% down · 7.5% · 30yr · 1.5% tax · 5.0% vac · 8.0% maint · 8.0% mgmt
Financing live
Cash to close
- Down payment
- $17,500
- Closing costs
- $2,100
- Reserves months
- —
- Total cash needed
- —
Loan-product check · same deal, 3 products live
Conventional
25% down · 7.5% · 30yr
- Down + closing
- —
- Monthly P&I
- —
- Monthly cashflow
- —
- DSCR
- —
- Eligible?
- —
Personal DTI + credit; lowest rate.
DSCR
20% down · 8.5% · 30yr
- Down + closing
- —
- Monthly P&I
- —
- Monthly cashflow
- —
- DSCR
- —
- Eligible?
- —
No personal income docs; deal must DSCR.
Hard money
10% down · 12.0% · 12mo
- Down + closing
- —
- Monthly P&I
- —
- Monthly cashflow
- —
- DSCR
- —
- Eligible?
- —
Short-term bridge; refi at stabilization.
Tax reassessment forecast CA · Resets to sale price
- Current annual tax
- $467 · $39/mo
- Projected year-2 tax
- $532 · $44/mo
- Expected delta
- +$65/yr (+$5/mo · 13.8%)
ⓘ Screening estimate from a state-policy table — verify with the county assessor before closing.
Climate risk First Street
- Flood 1/10 Low FEMA zone X (unshaded) · 0% chance over 30 yrs
- Wildfire 9/10 Extreme
- Heat 5/10 Major 7 d/yr ≥96°F today · 16 d/yr by 30 yrs out
- Wind 1/10 Low
- Air quality 10/10 Extreme 28 unhealthy d/yr today · 33 by 30 yrs out
Nearby sold comps map
Loading sold comps map…
Walkable amenities ~0.75 mi
Loading nearby amenities…
Taxation est. · year 1
- Rental income
- $13,609
- − Mortgage interest
- −$3,921
- − Property taxes
- −$467
- − Insurance
- −$350
- − Repairs & maintenance
- −$1,089
- − Management
- −$1,089
- − Depreciation
- −$2,036
- Taxable income
- $4,657
- Est. tax owed @ 24.0%
- −$1,118
- After-tax cash flow
- $4,411/yr
For passive investors: Depreciation is non-cash, so a rental often shows a tax loss while cash-flowing — sheltering income. Rental losses are passive: they offset passive income freely, and up to $25,000/yr can offset ordinary (W-2) income if you actively participate and your MAGI is under $100k (phasing out to $0 by $150k); unused losses carry forward. On sale, claimed depreciation is recaptured at up to 25%, and gains may owe capital-gains tax (a 1031 exchange can defer both). Figures are a year-1 estimate at your 24.0% rate — not tax advice; consult a CPA.
Schools (NCES district)
- District
- Calaveras Unified
- NCES district ID
- 0606870
- Math proficiency
- 16% ▼ -10.00%
- Reading proficiency
- 28% ▼ -8.00%
- Median HH income
- $55,559
- Composite
- 20.06/100
- National rank
- #8654
- State rank
- #436 of 517 in CA
Livability — Rail Road Flat
- Score
- 48/100
- State rank
- #1208
- US rank
- #26119
Category grades
Schools grade is shown separately in the Schools card above.
Census & demographics
- Census place
- Rail Road Flat, CA
- Population (ZIP)
- 3,227
Population outlook (Calaveras County) Hauer SSP2
- Today (2025)
- 43,163 people
- By 2030
- 41,703 · -3.4%
- By 2040
- 38,202 · -11.5%
- By 2050
- 35,385 · -18.0%
- By 2075
- 30,807 · -28.6%
- By 2100
- 25,755 · -40.3%
Race, ethnicity, and origin ACS 2023
- Neighborhood character
- Predominantly White (73%)
- Race & ethnicity
- White 73% Hispanic / Latino 14% Two or more races 10% Black 6% Asian 3% Native American 2%
- Hispanic origin (detail)
- Mexican 11%
- Common ancestry
- Scotch-Irish 4% Lithuanian 2% Portuguese 1%
- Foreign-born
- 5% · Canada
- Languages at home
- 91% English-only · Spanish 4% Other Asian/Pacific 2% Tagalog/Filipino 1%
Political lean MEDSL · Calaveras
- 2024 margin
- Strong R (+28.1) · D 34.7% · R 62.8% · Other 2.5%
- 2008→2024 swing
- -15.2pp toward R · 2008: -13.0pp · 2024: -28.1pp
- All cycles
- 2024: R+28.1 2020: R+23.8 2016: R+23.9 2012: R+17.0 2008: R+13.0
Not yet ingested
- Civics
- —
Market trends
- HPI YoY
- ▲ 0.32%
- Current HPI
- 159.2644
- Rent YoY
- —
- Metro
- —
- State GDP YoY
- ▲ 3.21%
- F500 in state
- 116
Industry mix (Fortune 500 HQ in CA)
| Industry | F500 HQs | Revenue |
|---|---|---|
| Technology | 27 | $1,492B |
|
||
| Financial Services | 3 | $174B |
|
||
| Retail | 3 | $44B |
|
||
| Insurance | 3 | $26B |
|
||
| Media / Entertainment | 2 | $115B |
|
||
| Pharmaceuticals / Biotech | 2 | $62B |
|
||
Property tax history
+0.5%/yrLatest (2019): $467 · +2.8% YoY. Source: county tax records.
Cash-flow waterfall
monthlySold comps — $/sqft
last 12 mo · ≤1 miLoading sold comps…