 🏷️ Likely Rental
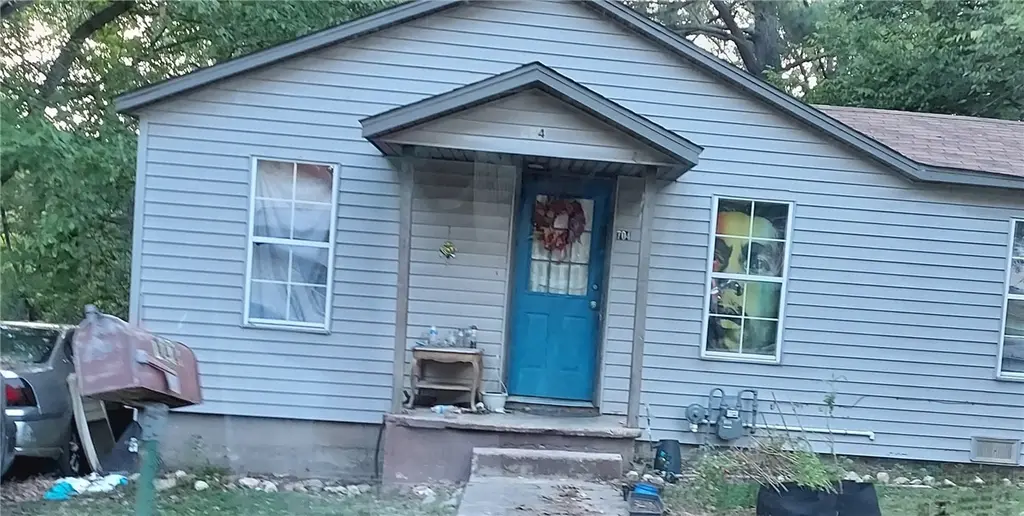
704 S Ash St · Harrison, AR
Flood risk 1/10 · Minimal
- FEMA flood zone
- X (unshaded)
- Chance of flooding over 30 yrs
- 0.0%
- Est. flood insurance / yr
- $507 – $1,088
Fire risk 3/10 · Minor
- Est. fire insurance / yr
- $1,499 – $2,785
Heat risk 4/10 · Minor
- Hot days now (above 104°F)
- 7 days/yr
- Hot days in 30 yrs
- 20 days/yr
Wind risk 2/10 · Minimal
- Chance of severe wind over 30 yrs
- 2.0%
Air-quality risk 1/10 · Minimal
- Unhealthy air days now
- 0 days/yr
- Unhealthy air days in 30 yrs
- 0 days/yr
Risk factors via First Street. Map © Google.
Why this score? — see what drove the B- grade
The composite is a weighted blend of 9 inputs, each scored 0–100. Each bar is that input's sub-score; the figure is the points it added to the 100-point composite (weight × sub-score).
- Cash flow +24.4/30.0
- ARV discount +15.0/15.0
- DSCR +7.9/10.0
- 1% rule +5.3/10.0
- Schools +4.5/10.0
- Appreciation +4.0/10.0
- Livability +3.5/5.0
- Rent growth +2.5/5.0
- Condition / age +2.5/5.0
$71,020
🖨 Deal sheet 📄 Offer letter ✓ Due diligence
Listing remarks
This little house could be just what you are looking for. Needs some TLC and vision but location is convenient to all Harrison has to offer. Very close to school. As Is Where Is. Tenant works please respect their privacy. Buyer to verify all utilities and numbers. Information from public record.
Key facts
- 9,147 sq ft lot
- Listed 5 days
Property features AI
Finance
- HOA & community: Monthly association fee; Near schools
Exterior
- Utilities: Public water available; Private sewer; Sewer available; Water available
- Home design: Single-story; Age unspecified
- Construction: Vinyl siding; Asphalt shingle roof; Crawlspace foundation
- Exterior features: Gravel driveway; City lot in a subdivision; Paved public road frontage
Interior
- Flooring: Vinyl
- Bathrooms: 1 full bathroom
- Heating & cooling: Electric cooling
- Interior features: Vinyl flooring; No additional interior features listed
- Laundry & utility: No hot water (appliance noted)
Neighborhood map
What this means for you Summary
Snapshot
- This is a 2-bed/1.0-bath single-family listed at $71k.
Deal economics
- At list price, monthly cash flow is $144 ($2k/yr) — positive.
- The deal already cash-flows at list — no discount required.
- Meets the 1% rule at list price ($735 rent vs $71k).
- Cap rate 8.7% vs local median 3.0% in Harrison — top-decile yield for the area; either an underpriced asset or a hidden risk that comps aren't pricing in. Stress-test before assuming the spread holds.
Location & tenants
- Location reads 70/100 on livability (#52 in AR) — a middle-class / working-renter tenant base. Strengths: cost of living A+, housing A+, health & safety A+; Watch: amenities F, commute F, employment F.
- Harrison School District (town): math 53% / reading 54% proficiency, ranked #11 of 238 in AR (top 5%) — acceptable for families but not a draw, mixed tenant base, ~2y average lease.
- Market conditions: 437 active listings in the ZIP; 2 comparable units currently listed for rent nearby; 92 units permitted in Boone County in 2024 (72 in 5+ unit buildings).
Forward outlook
- Local home prices are declining (-1.9%/yr); year-one equity from $491 of loan paydown is wiped out by about $1k of value loss. Plan a longer hold.
- Boone County population projected to shrink 8% by 2050 — rents likely to lag national; underwrite the cash flow, not the appreciation.
- At projected returns (-1.9% appreciation + 3.0% rent growth), your $20k cash investment doubles in ~10 years — after that, you're playing with house money.
Negotiation context
- Only 5 days on market — expect competitive offers; lowballing is unlikely to land.
- Current owner paid $60k; 18% above their basis — modest negotiation headroom, anchor on the comps not their cost.
Questions for the listing agent
- Is there a deadline driving the sale (1031 exchange, divorce, estate, relocation)? That informs how much negotiation room exists.
- What's the average days-on-market for RENTAL listings here right now (not sales)? A rising rental-DOM trend means longer vacancies and softer asking-rent achievability than the comps imply.
- What's the recent tenant-quality profile in this submarket — average credit score on applications, eviction rate, late-payment / NSF rate, and stable-employment percentage? A property-management company in the area should have these aggregated.
- How much new for-sale + rental construction is in the pipeline within 1–3 miles? Heavy new supply typically softens prices + rents 12–24 months out; constrained supply supports both.
Investment metrics
- 1% rule
- 1.03% ✓
- Cap rate
- 8.72%
- Cash-on-cash
- 8.67%
- DSCR
- 1.39
- GRM
- 8.1
CMA / ARV
- ARV (on-the-fly)
- $107,120
- Comps found
- 11
Show comp detail 11 sales within ~0.75 mi
| Address | Dist | Beds/Ba | Sqft | Sold | Price | $/sf | Match |
|---|---|---|---|---|---|---|---|
| 704 S Ash St | 0.00mi | 2/1.0 | 824 (0%) | 0mo | $72,655 | $88 | 100 |
| 703 Ash St | 0.02mi | 2/1.0 | 808 (-2%) | 2mo | $124,000 | $153 | 94 |
| 715 Sycamore St | 0.20mi | 2/1.0 | 854 (+4%) | 5mo | $141,500 | $166 | 81 |
| 909 S Ash St | 0.20mi | 2/1.0 | 798 (-3%) | 19mo | $122,000 | $153 | 70 |
| 217 E Rogers | 0.30mi | 2/1.0 | 816 (-1%) | 22mo | $85,000 | $104 | 66 |
| 514 Gordon Ave | 0.07mi | 2/1.0 | 924 (+12%) | 19mo | $120,000 | $130 | 61 |
| 623 S Sycamore | 0.21mi | 1/1.0 (-1) | 777 (-6%) | 20mo | $97,500 | $125 | 60 |
| 501 E Milam Ave | 0.37mi | 1/1.0 (-1) | 764 (-7%) | 14mo | $45,000 | $59 | 54 |
| 416 Walnut St | 0.41mi | 3/1.0 (+1) | 912 (+11%) | 14mo | $72,500 | $79 | 46 |
| 304 Glines Ct | 0.68mi | 3/2.0 (+1) | 946 (+15%) | 7mo | $149,900 | $158 | 29 |
| 308 Glines Ct | 0.71mi | 3/2.0 (+1) | 924 (+12%) | 18mo | $156,000 | $169 | 23 |
Match score weights: distance 35% · size 25% · config 20% · recency 20%. Top-matched comps best support the ARV.
Projected returns pro-forma
-1.92% appreciation · 3.0% rent growth · sell at horizon
- IRR
- 1.1%
- Equity multiple
- 1.04×
- Total profit
- $871
- Equity at exit
- $14,050
- IRR
- 8.9%
- Equity multiple
- 1.77×
- Total profit
- $15,362
- Equity at exit
- $12,252
Cash invested: $19,886 (down + closing). Projections, not guarantees.
Landlord ↔ Tenant lean methodology
- Overall (STATE)
- 92 Strongly Landlord-Friendly
- State Arkansas
- 92 Strongly Landlord-Friendly · R+14
- County
- — inherits STATE
- City
- — inherits STATE
ZIP-level market 72601
- Home prices YoY
- -0.8%
- Active inventory
- 437
- Price-to-rent
- 8.1×
Monthly cashflow live
- Estimated rent
- $735 medium interval (Pro) →
- Mortgage (P&I)
- −$372
- Tax from tax record
- −$35 /mo · $416/yr
- Insurance
- −$30
- HOA
- −$0
- Vacancy / Maint / Mgmt
- −$154
- Net cashflow
- $144
Break-even live
UW: 25.0% down · 7.5% · 30yr · 1.5% tax · 5.0% vac · 8.0% maint · 8.0% mgmt
Financing live
Cash to close
- Down payment
- $17,755
- Closing costs
- $2,131
- Reserves months
- —
- Total cash needed
- —
Loan-product check · same deal, 3 products live
Conventional
25% down · 7.5% · 30yr
- Down + closing
- —
- Monthly P&I
- —
- Monthly cashflow
- —
- DSCR
- —
- Eligible?
- —
Personal DTI + credit; lowest rate.
DSCR
20% down · 8.5% · 30yr
- Down + closing
- —
- Monthly P&I
- —
- Monthly cashflow
- —
- DSCR
- —
- Eligible?
- —
No personal income docs; deal must DSCR.
Hard money
10% down · 12.0% · 12mo
- Down + closing
- —
- Monthly P&I
- —
- Monthly cashflow
- —
- DSCR
- —
- Eligible?
- —
Short-term bridge; refi at stabilization.
Rent comps 2 comps
| Address | Beds | Baths | Sqft | Rent | $/sqft | DOM | Units | Dist |
|---|---|---|---|---|---|---|---|---|
| 851 State Highway 123 Harrison, AR | 1.0–2.0 | 1.0–2.0 | 721 | $725 | $1.00 | 43d | 21 | 0.89mi |
| 1101 N Cherry St Unit A Harrison, AR | 2.0 | 1.0 | 1000 | $750 | $0.75 | 43d | 1 | 1.36mi |
Listing history 4 events
-
2026-05-12status Pending
-
2026-05-07$71,020 Active
-
2007-11-14soldstatus $60,000
-
2005-01-10soldstatus $43,100
ⓘ Source: listings_history table (triggers on properties + properties_extension) + one-shot
backfill from property_details.listing_events for pre-trigger history.
Tax reassessment forecast AR · Resets to sale price
- Current annual tax
- $416 · $35/mo
- Projected year-2 tax
- $455 · $38/mo
- Expected delta
- +$39/yr (+$3/mo · 9.4%)
ⓘ Screening estimate from a state-policy table — verify with the county assessor before closing.
Climate risk First Street
- Flood 1/10 Low FEMA zone X (unshaded) · 0% chance over 30 yrs
- Wildfire 3/10 Moderate
- Heat 4/10 Moderate 7 d/yr ≥104°F today · 20 d/yr by 30 yrs out
- Wind 2/10 Low 2% chance of damaging wind over 30 yrs
- Air quality 1/10 Low 0 unhealthy d/yr today · 0 by 30 yrs out
Nearby sold comps map
Loading sold comps map…
Walkable amenities ~0.75 mi
Loading nearby amenities…
Taxation est. · year 1
- Rental income
- $8,815
- − Mortgage interest
- −$3,978
- − Property taxes
- −$416
- − Insurance
- −$355
- − Repairs & maintenance
- −$705
- − Management
- −$705
- − Depreciation
- −$2,066
- Taxable income
- $589
- Est. tax owed @ 24.0%
- −$141
- After-tax cash flow
- $1,582/yr
For passive investors: Depreciation is non-cash, so a rental often shows a tax loss while cash-flowing — sheltering income. Rental losses are passive: they offset passive income freely, and up to $25,000/yr can offset ordinary (W-2) income if you actively participate and your MAGI is under $100k (phasing out to $0 by $150k); unused losses carry forward. On sale, claimed depreciation is recaptured at up to 25%, and gains may owe capital-gains tax (a 1031 exchange can defer both). Figures are a year-1 estimate at your 24.0% rate — not tax advice; consult a CPA.
Schools (NCES district)
- District
- Harrison School District
- NCES district ID
- 0507380
- Math proficiency
- 53% ▼ -9.00%
- Reading proficiency
- 54% ▼ -6.00%
- Median HH income
- $37,726
- Composite
- 44.51/100
- National rank
- #2796
- State rank
- #11 of 238 in AR
Livability — Harrison
- Score
- 70/100
- State rank
- #52
- US rank
- #7654
Category grades
Schools grade is shown separately in the Schools card above.
Census & demographics
- Census place
- Harrison, AR
- Population (ZIP)
- 30,180
Population outlook (Boone County) Hauer SSP2
- Today (2025)
- 37,238 people
- By 2030
- 36,808 · -1.2%
- By 2040
- 35,597 · -4.4%
- By 2050
- 34,197 · -8.2%
- By 2075
- 30,503 · -18.1%
- By 2100
- 25,797 · -30.7%
Race, ethnicity, and origin ACS 2023
- Neighborhood character
- Predominantly White (93%)
- Race & ethnicity
- White 93% Two or more races 4% Hispanic / Latino 3%
- Common ancestry
- Lithuanian 3% Slovak 2% Serbian 2%
- Foreign-born
- 1% · Canada
- Languages at home
- 97% English-only · Spanish 2%
Political lean MEDSL · Boone
- 2024 margin
- Solid R (+65.0) · D 16.7% · R 81.6% · Other 1.7%
- 2008→2024 swing
- -25.3pp toward R · 2008: -39.7pp · 2024: -65.0pp
- All cycles
- 2024: R+65.0 2020: R+61.9 2016: R+58.5 2012: R+48.0 2008: R+39.7
Not yet ingested
- Civics
- —
Market trends
- HPI YoY
- ▼ -1.92%
- Current HPI
- 247.043
- Rent YoY
- —
- Metro
- —
- State GDP YoY
- ▲ 3.80%
- F500 in state
- 10
Industry mix (Fortune 500 HQ in AR)
| Industry | F500 HQs | Revenue |
|---|---|---|
| Retail | 1 | $681B |
|
||
| Food / Agriculture | 1 | $53B |
|
||
| Retail / Energy | 1 | $22B |
|
||
| Transportation / Logistics | 1 | $12B |
|
||
| Energy | 1 | $4B |
|
||
Price history
+64.8% since first listed4 events — show timeline
- 2026-05-12 Pending — NWARMLS
- 2026-05-07 Listed $71,020 NWARMLS
- 2007-11-14 Sold (Public Records) $60,000 Public Records
- 2005-01-10 Sold (Public Records) $43,100 Public Records
Property tax history
+2.8%/yrLatest (2025): $416 · +0.0% YoY. Source: county tax records.
Cash-flow waterfall
monthlySold comps — $/sqft
last 12 mo · ≤1 miLoading sold comps…