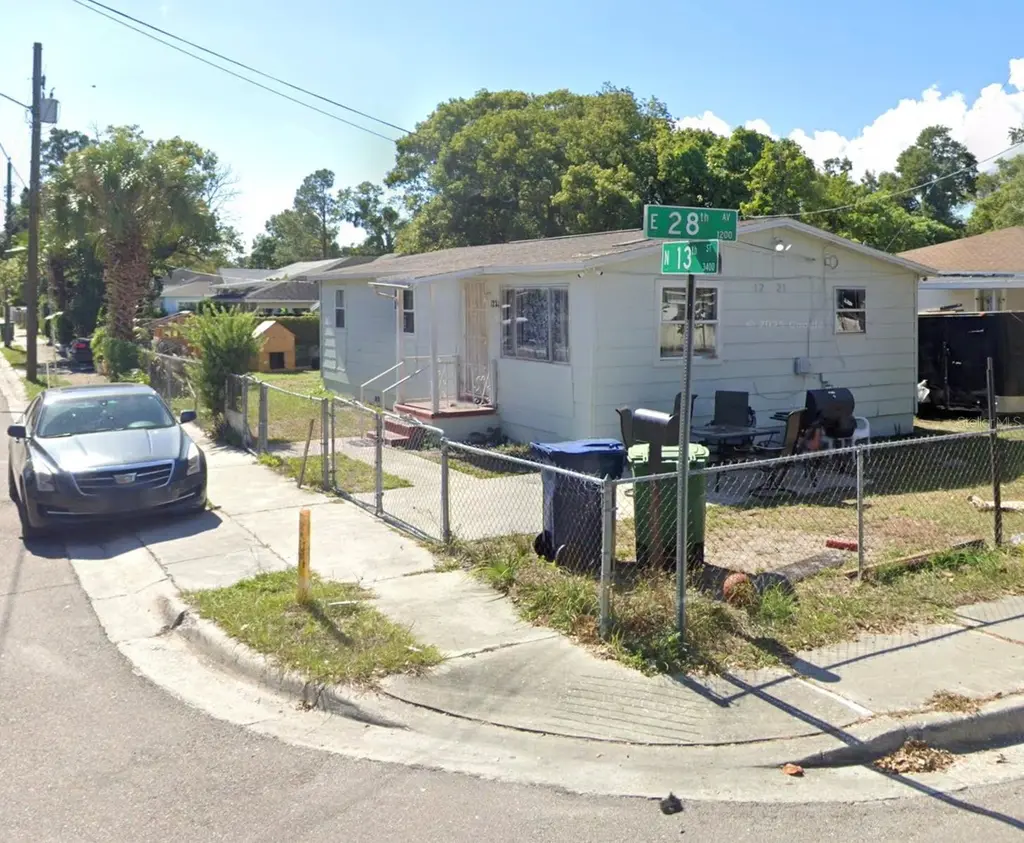
1221 E 28th Ave · Tampa, FL
Flood risk 1/10 · Minimal
- FEMA flood zone
- X (unshaded)
- Chance of flooding over 30 yrs
- 0.0%
- Est. flood insurance / yr
- $507 – $1,088
Fire risk 1/10 · Minimal
- Est. fire insurance / yr
- $947 – $1,759
Heat risk 10/10 · Severe
- Hot days now (above 107°F)
- 7 days/yr
- Hot days in 30 yrs
- 25 days/yr
Wind risk 9/10 · Severe
- Chance of severe wind over 30 yrs
- 99.0%
Air-quality risk 3/10 · Minor
- Unhealthy air days now
- 3 days/yr
- Unhealthy air days in 30 yrs
- 4 days/yr
Risk factors via First Street. Map © Google.
Why this score? — see what drove the C+ grade
The composite is a weighted blend of 9 inputs, each scored 0–100. Each bar is that input's sub-score; the figure is the points it added to the 100-point composite (weight × sub-score).
- Cash flow +20.5/30.0
- Appreciation +10.0/10.0
- ARV discount +7.5/15.0
- DSCR +6.5/10.0
- 1% rule +5.1/10.0
- Schools +4.2/10.0
- Livability +4.0/5.0
- Rent growth +2.6/5.0
- Condition / age +2.5/5.0
$185,000
🖨 Deal sheet (PDF) 📄 Offer letter ✓ Due diligence
Listing remarks
Welcome to this charming corner-lot home situated on a spacious lot in one of Tampa’s fastest-growing redevelopment areas. This property features upgraded granite countertops, select stainless steel kitchen appliances, extended outdoor space, and a flexible layout full of potential. Currently occupied by a month-to-month tenant, giving the next owner flexibility to continue renting, renovate, Airbnb, or move in. Conveniently located just minutes from Downtown Tampa, Riverwalk, Ybor City, the Gasworx development, the University of Tampa, and major highways including I-4 and I-275. With no HOA, no CDD, and no flood zone, this property presents an excellent opportunity for investors or o
Key facts
- No cdd
- Flexible layout
- Corner-lot
Tags
Property features AI
Finance
- Other: Zoned RS-50; No CDD; Not homesteaded; Unfurnished; No lease restrictions; Universal property ID available
Exterior
- Utilities: Public water; Public sewer; Cable available; Broadband/high-speed internet available; Electricity available; Sewer connected; Water available
- Home design: Single family residence; Residential property; One story; Faces north; Entry level: One
- Construction: Frame construction; Shingle roof; Pillar/post/pier and slab foundation; Built on lot of approximately 0.11 acres (49 x 95)
- Exterior features: Private mailbox; Sidewalk
Interior
- Kitchen: Convection oven; Refrigerator
- Bedrooms: 2 bedrooms
- Flooring: Tile
- Bathrooms: 1 full bathroom
- Heating & cooling: Central heating (electric); Central air conditioning
- Interior features: Ceiling fans; Stone counters; Thermostat
- Laundry & utility: Laundry inside; Laundry outside
Neighborhood map
What this means for you Summary
Snapshot
- This is a 2-bed/1.0-bath single-family listed at $185k.
Deal economics
- At list price, monthly cash flow is $244 ($3k/yr) — positive.
- The deal already cash-flows at list — no discount required.
- Meets the 1% rule at list price ($2k rent vs $185k).
- Recommended offer: $182k (1.5% below list) — sets the bar for market timing.
Location & tenants
- Location reads 79/100 on livability (#142 in FL, #2,135 nationally) — a middle-class / working-renter tenant base. Strengths: commute A+, housing A+, health & safety A+; Watch: crime D+.
- Hillsborough (suburban): math 47% / reading 50% proficiency, ranked #41 of 73 in FL (top 56%) — families likely to look elsewhere, expect single-tenant / working-renter base with shorter leases.
- Zoned schools: Potter Elementary School (math 32% / reading 22%, grade F, #1,969 of 2,144 statewide, top 94%, 472 students, 89% FRL); Mclane Middle School (math 20% / reading 20%, grade F, #558 of 571 statewide, top 98%, 817 students, 74% FRL); Middleton High School (math 23% / reading 51%, grade F, #340 of 667 statewide, top 52%, 1,511 students, 57% FRL) — zoned schools average 74% FRL vs 52% district-wide (22 pts higher); higher-poverty schools than district average — tighter screening recommended.
- Zoned-school proficiency averages 28% at this address vs 48% district-wide (-20 pts) — the specific schools serving this property underperform the Hillsborough average; the district grade overstates school quality for this exact location.
- Market conditions: Rents flat; 190 active listings in the ZIP; 40 comparable units currently listed for rent nearby; rentals at typical pace (median 22d on market — plan ~3-4 weeks tenant-placement turnaround); lower-income renter base — watch delinquency; 9,053 units permitted in Hillsborough County in 2024 (4,555 in 5+ unit buildings).
- At $1,868/mo this rent would consume 61% of the median local household income ($37k/yr) (locally 1374% of renters already pay >50% of income on rent) — very limited rent-growth headroom before tenants either downsize or default.
Forward outlook
- In year one you build about $20k of equity ($1k loan paydown + $18k appreciation (10.0% local appreciation)).
- Hillsborough County population projected at +37% by 2050 — long-run rental-demand tailwind backs the buy-and-hold thesis.
- At projected returns (10.0% appreciation + 0.6% rent growth), your $52k cash investment doubles in ~3 years — after that, you're playing with house money.
- By year 2, paydown + projected appreciation supports a ~$32k cash-out refi (75% LTV) — recoverable capital for the next deal without selling this one.
Negotiation context
- It's been on market 20 days — a 2% lower offer ($182k) is reasonable based on typical stale-listing flexibility.
- Current owner paid $22k; list at $185k implies a 741% gain — meaningful room to come down on a strong offer.
Risks & watch-outs
- Climate carrying-cost: severe wind risk, 99% chance of damaging wind over 30y; extreme-heat days projected 7→25/yr by 2055 (HVAC capex compounding) — expect insurance premiums to compound above CPI over the hold.
Questions for the listing agent
- Built in 1972 — when were the roof, HVAC, electrical panel, plumbing, and water heater last replaced?
- Is there a deadline driving the sale (1031 exchange, divorce, estate, relocation)? That informs how much negotiation room exists.
- Crime grade is D in this area — have there been break-ins, vandalism, or insurance claims at this property in the last 3 years? What carrier currently insures it and at what premium?
- What's the average days-on-market for RENTAL listings here right now (not sales)? A rising rental-DOM trend means longer vacancies and softer asking-rent achievability than the comps imply.
- What's the recent tenant-quality profile in this submarket — average credit score on applications, eviction rate, late-payment / NSF rate, and stable-employment percentage? A property-management company in the area should have these aggregated.
- How much new for-sale + rental construction is in the pipeline within 1–3 miles? Heavy new supply typically softens prices + rents 12–24 months out; constrained supply supports both.
Investment metrics
- 1% rule
- 1.01% ✓
- Cap rate
- 7.88%
- Cash-on-cash
- 5.66%
- DSCR
- 1.25
- GRM
- 8.3
CMA / ARV
No comps found within radius.
Projected returns pro-forma
10.0% appreciation · 0.58% rent growth · sell at horizon
- IRR
- 27.5%
- Equity multiple
- 3.16×
- Total profit
- $111,880
- Equity at exit
- $166,663
- IRR
- 23.3%
- Equity multiple
- 6.97×
- Total profit
- $309,074
- Equity at exit
- $359,414
Cash invested: $51,800 (down + closing). Projections, not guarantees.
Landlord ↔ Tenant lean methodology
- Overall (STATE)
- 87 Strongly Landlord-Friendly
- State Florida
- 87 Strongly Landlord-Friendly · R+3
- County
- — inherits STATE
- City
- — inherits STATE
ZIP-level market 33605
- Home prices YoY
- 3.7%
- Rents YoY
- 0.6%
- Active inventory
- 190
- Price-to-rent
- 8.3×
Monthly cashflow live
- Estimated rent
- $1,868 high interval (Pro) →
- Mortgage (P&I)
- −$970
- Tax from tax record
- −$184 /mo · $2,210/yr
- Insurance
- −$77
- HOA
- −$0
- Vacancy / Maint / Mgmt
- −$392
- Net cashflow
- $244
Break-even live
Sensitivity live
| Price | -10% $349 | -5% $297 | +0% $244 | +5% $192 | +10% $140 |
|---|---|---|---|---|---|
| Rent | -10% $97 | -5% $171 | +0% $244 | +5% $318 | +10% $392 |
| Rate | -1.0pp $338 | -0.5pp $291 | base $244 | +0.5pp $196 | +1.0pp $148 |
UW: 25.0% down · 7.5% · 30yr · 1.5% tax · 5.0% vac · 8.0% maint · 8.0% mgmt
Financing live
Cash to close
- Down payment
- $46,250
- Closing costs
- $5,550
- Reserves months
- —
- Total cash needed
- —
Loan-product check · same deal, 3 products live
Conventional
25% down · 7.5% · 30yr
- Down + closing
- —
- Monthly P&I
- —
- Monthly cashflow
- —
- DSCR
- —
- Eligible?
- —
Personal DTI + credit; lowest rate.
DSCR
20% down · 8.5% · 30yr
- Down + closing
- —
- Monthly P&I
- —
- Monthly cashflow
- —
- DSCR
- —
- Eligible?
- —
No personal income docs; deal must DSCR.
Hard money
10% down · 12.0% · 12mo
- Down + closing
- —
- Monthly P&I
- —
- Monthly cashflow
- —
- DSCR
- —
- Eligible?
- —
Short-term bridge; refi at stabilization.
Rent comps 40 comps
| Address | Beds | Baths | Sqft | Rent | $/sqft | DOM | Units | Dist |
|---|---|---|---|---|---|---|---|---|
| 3411 N 13th St Tampa, FL | 3.0 | 2.0 | 978 | $1,895 | $1.94 | 26d | 1 | 0.06mi |
| 1105 E 28th Ave Tampa, FL | 3.0 | 1.0 | 744 | $1,525 | $2.05 | 6d | 1 | 0.09mi |
| 3511 Cone Ct Tampa, FL | 3.0 | 2.0 | 1256 | $2,200 | $1.75 | 6d | 1 | 0.16mi |
| 1212 E 25th Ave Tampa, FL | 2.0 | 1.0 | 1035 | $1,490 | $1.44 | 21d | 1 | 0.18mi |
| 1006 E 26th Ave Tampa, FL | 2.0 | 1.0 | 1000 | $1,630 | $1.63 | 6d | 1 | 0.21mi |
| 1305 E Louise Ave Tampa, FL | 3.0 | 2.0 | 1384 | $2,700 | $1.95 | 26d | 1 | 0.23mi |
| 3519 N 10th St Tampa, FL | 3.0 | 2.0 | 1200 | $1,850 | $1.54 | 19d | 1 | 0.23mi |
| 1515 E 31st Ave Tampa, FL | 2.0 | 1.0 | 914 | $1,500 | $1.64 | 6d | 1 | 0.31mi |
| 1605 E 29th Ave Tampa, FL | 3.0 | 1.0 | 870 | $1,800 | $2.07 | 22d | 1 | 0.34mi |
| 1302 E 21st Ave Tampa, FL | 1.0–2.0 | 1.0–2.0 | 800 | $1,408 | $1.76 | 1d | 8 | 0.36mi |
| 3021 Sanchez St Tampa, FL | 3.0 | 1.0 | 1300 | $2,195 | $1.69 | 26d | 1 | 0.36mi |
| 803 E Lake Ave Unit C 3 Tampa, FL | 2.0 | 1.0 | 700 | $995 | $1.42 | 0d | 1 | 0.38mi |
| 1003 E 22nd Ave Tampa, FL | 2.0 | 1.0 | 1062 | $1,639 | $1.54 | 6d | 1 | 0.38mi |
| 1504 E 33rd Ave Tampa, FL | 3.0 | 2.0 | 1108 | $2,900 | $2.62 | 26d | 1 | 0.39mi |
| 709 E James St Tampa, FL | 2.0 | 1.0 | 768 | $1,695 | $2.21 | 14d | 1 | 0.39mi |
| 809 E Baker St Unit A Tampa, FL | 3.0 | 1.0 | 1083 | $2,200 | $2.03 | 26d | 1 | 0.40mi |
| 3005 Sanchez St Unit 5 Tampa, FL | 2.0 | 1.0 | 750 | $1,050 | $1.40 | 1d | 1 | 0.42mi |
| 3005 Sanchez St Unit 5 Tampa, FL | 2.0 | 1.0 | 750 | $1,050 | $1.40 | 4d | 1 | 0.42mi |
| 912 E Saint Clair St Tampa, FL | 2.0 | 1.0 | 1000 | $1,900 | $1.90 | 26d | 1 | 0.46mi |
| 2907 N 15th St Unit D Tampa, FL | 3.0 | 2.0 | 888 | $1,850 | $2.08 | 6d | 1 | 0.51mi |
| 1211 E 18th Ave Unit 2 Tampa, FL | 2.0 | 1.0 | 725 | $1,700 | $2.34 | 0d | 1 | 0.53mi |
| 4207 N 13th St Unit A Tampa, FL | 2.0 | 2.0 | 832 | $2,150 | $2.58 | 26d | 1 | 0.55mi |
| 2909 N 17th St Tampa, FL | 2.0 | 1.0 | 750 | $1,350 | $1.80 | 23d | 1 | 0.58mi |
| 2810 N 16th St Tampa, FL | 2.0 | 1.0 | 1066 | $2,550 | $2.39 | 14d | 1 | 0.58mi |
| 1602 E North Bay St Tampa, FL | 3.0 | 2.0 | 1200 | $2,100 | $1.75 | 26d | 1 | 0.59mi |
| 1607 E 18th Ave Tampa, FL | 2.0 | 1.0 | 869 | $2,600 | $2.99 | 14d | 1 | 0.62mi |
| 1807 E 20th Ave Tampa, FL | 3.0 | 2.0 | 1131 | $2,900 | $2.56 | 26d | 1 | 0.63mi |
| 1221 E Columbus Dr Tampa, FL | 2.0 | 1.0 | 1000 | $1,499 | $1.50 | 26d | 1 | 0.64mi |
| 1301 E Columbus Dr Unit 1 Tampa, FL | 1.0 | 1.0 | 750 | $1,995 | $2.66 | 26d | 1 | 0.65mi |
| 1003 E Columbus Dr Tampa, FL | 2.0 | 1.0 | 1160 | $1,795 | $1.55 | 3d | 1 | 0.66mi |
| 411 E Adalee St Tampa, FL | 3.0 | 1.0 | 1200 | $2,500 | $2.08 | 26d | 1 | 0.67mi |
| 807 E Genesee St Unit 1/2 Tampa, FL | 3.0 | 2.0 | 1414 | $2,400 | $1.70 | 23d | 1 | 0.67mi |
| 807 E Genesee St Tampa, FL | 3.0 | 2.0 | 1414 | $2,400 | $1.70 | 21d | 1 | 0.68mi |
| 1003 E 15th Ave Tampa, FL | 1.0 | 1.0 | 750 | $1,275 | $1.70 | 26d | 1 | 0.70mi |
| 1301 E Cayuga St Tampa, FL | 3.0 | 1.5 | 1216 | $2,200 | $1.81 | 26d | 1 | 0.72mi |
| 2205 Chipco St Tampa, FL | 2.0 | 1.0 | 1100 | $1,600 | $1.45 | 26d | 1 | 0.72mi |
| 1716 E Columbus Dr Unit A Tampa, FL | 2.0 | 1.0 | 924 | $1,800 | $1.95 | 26d | 1 | 0.73mi |
| 2108 E 22nd Ave Tampa, FL | 3.0 | 3.0 | 1308 | $2,100 | $1.61 | 5d | 1 | 0.73mi |
| 2108 E 22nd Ave Tampa, FL | 3.0 | 3.0 | 1308 | $2,100 | $1.61 | 6d | 1 | 0.73mi |
| 1709 E Chelsea St Unit F Tampa, FL | 2.0 | 1.0 | 1041 | $1,625 | $1.56 | 25d | 1 | 0.74mi |
Listing history 14 events
-
2026-06-21days on market $185,000 Active 20 DOM
-
2026-06-18days on market $185,000 Active 17 DOM
-
2026-06-17days on market $185,000 Active 16 DOM
-
2026-06-16days on market $185,000 Active 15 DOM
-
2026-06-15days on market $185,000 Active 14 DOM
-
2026-06-13days on market $185,000 Active 12 DOM
-
2026-06-13days on market $185,000 Active 11 DOM
-
2026-06-09days on market $185,000 Active 8 DOM
-
2026-06-08days on market $185,000 Active 7 DOM
-
2026-06-07days on market $185,000 Active 6 DOM
-
2026-06-04days on market $185,000 Active 3 DOM
-
2026-06-03days on market $185,000 Active 2 DOM
-
2026-06-02remarks 693-char remark
-
2026-06-02$185,000 Active 1 DOM
ⓘ Source: listings_history table (triggers on properties + properties_extension) + one-shot
backfill from property_details.listing_events for pre-trigger history.
Tax reassessment forecast FL · Resets to sale price
- Current annual tax
- $2,210 · $184/mo
- Projected year-2 tax
- $2,210 · $184/mo
- Expected delta
- $0/yr ($0/mo · 0.0%)
ⓘ Screening estimate from a state-policy table — verify with the county assessor before closing.
Climate risk First Street
- Flood 1/10 Low FEMA zone X (unshaded) · 0% chance over 30 yrs
- Wildfire 1/10 Low
- Heat 10/10 Extreme 7 d/yr ≥107°F today · 25 d/yr by 30 yrs out
- Wind 9/10 Extreme 99% chance of damaging wind over 30 yrs
- Air quality 3/10 Moderate 3 unhealthy d/yr today · 4 by 30 yrs out
Nearby sold comps map
Loading sold comps map…
Walkable amenities ~0.75 mi
Loading nearby amenities…
Taxation est. · year 1
- Rental income
- $22,418
- − Mortgage interest
- −$10,363
- − Property taxes
- −$2,210
- − Insurance
- −$925
- − Repairs & maintenance
- −$1,793
- − Management
- −$1,793
- − Depreciation
- −$5,382
- Taxable loss
- −$49
- Est. tax savings @ 24.0%
- +$12
- After-tax cash flow
- $2,945/yr
For passive investors: Depreciation is non-cash, so a rental often shows a tax loss while cash-flowing — sheltering income. Rental losses are passive: they offset passive income freely, and up to $25,000/yr can offset ordinary (W-2) income if you actively participate and your MAGI is under $100k (phasing out to $0 by $150k); unused losses carry forward. On sale, claimed depreciation is recaptured at up to 25%, and gains may owe capital-gains tax (a 1031 exchange can defer both). Figures are a year-1 estimate at your 24.0% rate — not tax advice; consult a CPA.
Schools (NCES district)
- District
- Hillsborough
- NCES district ID
- 1200870
- Math proficiency
- 47% ▼ -8.00%
- Reading proficiency
- 50% ▼ -4.00%
- Median HH income
- $50,622
- Composite
- 41.6/100
- National rank
- #3435
- State rank
- #41 of 73 in FL
Livability — Tampa
- Score
- 79/100
- State rank
- #142
- US rank
- #2135
Category grades
Schools grade is shown separately in the Schools card above.
Census & demographics
- Census place
- Tampa, FL
- County
- Hillsborough County · 1,540,968 people
- City population
- 523,346
- Metro
- Tampa-St. Petersburg-Clearwater, FL
- Population (ZIP)
- 16,030
- Household income
- $36,975
- Rent vs Own
- Severe rent burden
- 1374.0
Population outlook (Hillsborough County) Hauer SSP2
- Today (2025)
- 1,607,022 people
- By 2030
- 1,733,968 · +7.9%
- By 2040
- 1,979,565 · +23.2%
- By 2050
- 2,203,427 · +37.1%
- By 2075
- 2,667,893 · +66.0%
- By 2100
- 2,891,558 · +79.9%
Race, ethnicity, and origin ACS 2023
- Neighborhood character
- Diverse neighborhood (Simpson 0.66)
- Race & ethnicity
- Black 48% Hispanic / Latino 28% Two or more races 18% White 17% Asian 1%
- Hispanic origin (detail)
- Mexican 6% Puerto Rican 8% Cuban 6% Dominican 1%
- Common ancestry
- Hispanic 2% Romanian 1% Lithuanian 1%
- Foreign-born
- 17% · Canada, Vietnam, Jamaica
- Languages at home
- 72% English-only · Spanish 24% French/Haitian/Cajun 3% Other Asian/Pacific 1%
Political lean MEDSL · Hillsborough
- 2024 margin
- Toss-up / Even · D 47.8% · R 50.9% · Other 1.3%
- 2008→2024 swing
- -10.2pp toward R · 2008: 7.1pp · 2024: -3.1pp
- All cycles
- 2024: R+3.1 2020: D+6.9 2016: D+6.8 2012: D+6.7 2008: D+7.1
Not yet ingested
- Civics
- —
Market trends
- HPI YoY
- ▲ 17.43%
- Current HPI
- 494.1871
- Rent YoY
- ▲ 0.58%
- Metro
- Tampa-St. Petersburg-Clearwater, FL
- State GDP YoY
- ▲ 3.28%
- F500 in state
- 36
Industry mix (Fortune 500 HQ in FL)
| Industry | F500 HQs | Revenue |
|---|---|---|
| Industrial Technology | 2 | $29B |
|
||
| Insurance | 2 | $17B |
|
||
| Retail | 1 | $60B |
|
||
| Technology Distribution | 1 | $58B |
|
||
| Homebuilding | 1 | $35B |
|
||
| Technology Manufacturing | 1 | $35B |
|
||
Price history
+740.9% since first listed2 events — show timeline
- 2026-06-02 Listed $185,000 Stellar MLS as Distributed by MLS Grid
- 1998-07-28 Sold (Public Records) $22,000 Public Records
Property tax history
+10.5%/yrLatest (2025): $2,210 · +11.5% YoY. Source: county tax records.
Cash-flow waterfall
monthlySold comps — $/sqft
last 12 mo · ≤1 miLoading sold comps…