 Duplex
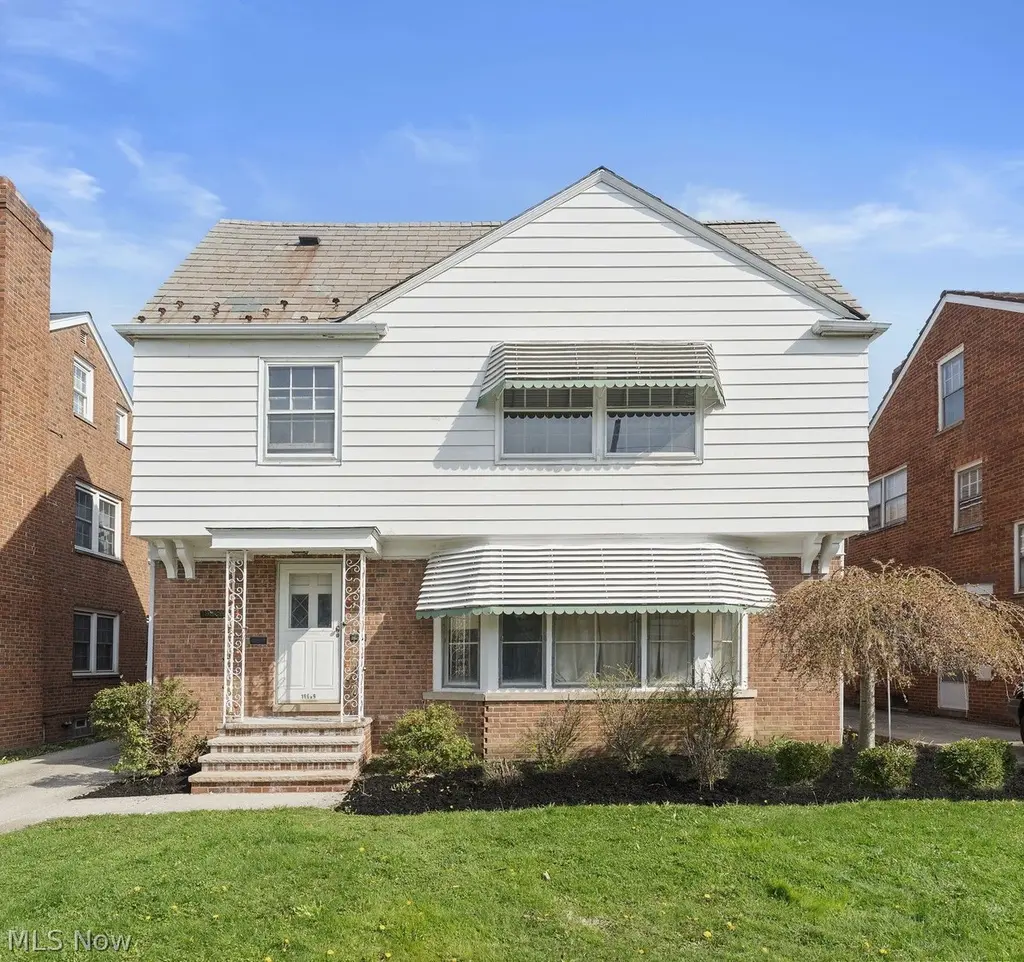
19829 Winslow Rd · Shaker Heights, OH
Flood risk 1/10 · Minimal
- FEMA flood zone
- X (unshaded)
- Chance of flooding over 30 yrs
- 0.0%
- Est. flood insurance / yr
- $473 – $860
Fire risk 1/10 · Minimal
- Est. fire insurance / yr
- $713 – $1,323
Heat risk 2/10 · Minimal
- Hot days now (above 95°F)
- 7 days/yr
- Hot days in 30 yrs
- 17 days/yr
Wind risk 1/10 · Minimal
- Chance of severe wind over 30 yrs
- —
Air-quality risk 3/10 · Minor
- Unhealthy air days now
- 2 days/yr
- Unhealthy air days in 30 yrs
- 5 days/yr
Risk factors via First Street. Map © Google.
Why this score? — see what drove the C- grade
The composite is a weighted blend of 9 inputs, each scored 0–100. Each bar is that input's sub-score; the figure is the points it added to the 100-point composite (weight × sub-score).
- Cash flow +18.4/30.0
- ARV discount +7.3/15.0
- 1% rule +6.2/10.0
- DSCR +5.8/10.0
- Schools +5.0/10.0
- Livability +4.5/5.0
- Rent growth +2.8/5.0
- Condition / age +2.5/5.0
- Appreciation +0.0/10.0
$329,000
🖨 Deal sheet 📄 Offer letter ✓ Due diligence
Multi-family units
County records classify this as Multi-Family (2-4 Unit). Listing-text estimate: 2 units. confirmed
Listing remarks
PRIME LOCATION. Just one block from the Van Aken District’s shops and restaurants, and the RTA Blue Line at Farnsleigh Station. This income-producing duplex offers convenient access to Cleveland’s top hospital campuses, John Carroll and Case Western Reserve. The property is also located within the highly-rated Shaker Heights School District. Each unit offers beautiful hardwood floors, an open-concept layout, a kitchen with newer appliances, three bedrooms, two full bathrooms, a three-season room, private laundry, and garage parking. Both units are currently leased through 6/30/2026. Out of respect for the tenants' privacy, showings will be honored upon acceptance of a written pu
Key facts
- Three season room
- Open concept layout
- 5,837 sq ft lot
Tags
Neighborhood map
What this means for you Summary
Snapshot
- This is a 2 × 3-bed/2.0-bath units multifamily listed at $329k.
Deal economics
- At list price, monthly cash flow is $309 ($4k/yr) — positive. Per door: $154/mo.
- The deal already cash-flows at list — no discount required.
- Meets the 1% rule at list price ($4k rent vs $329k).
- Recommended offer: $324k (1.5% below list) — sets the bar for market timing.
- Cap rate 7.4% vs local median 2.5% in Shaker Heights — top-decile yield for the area; either an underpriced asset or a hidden risk that comps aren't pricing in. Stress-test before assuming the spread holds.
Location & tenants
- Location reads 89/100 on livability (#15 in OH, #134 nationally) — a professional / high-income tenant draw. Strengths: schools A+, crime A+, commute A+; Watch: amenities F.
- Shaker Heights City (suburban): math 50% / reading 63% proficiency, ranked #309 of 656 in OH (top 47%) — acceptable for families but not a draw, mixed tenant base, ~2y average lease.
- Market conditions: Rents rising (+1.1%/yr); 177 active listings in the ZIP; 1 comparable units currently listed for rent nearby; solid renter incomes; 1,441 units permitted in Cuyahoga County in 2024 (700 in 5+ unit buildings).
- This rent runs 44% of the median local income ($101k/yr) — at the standard rent-burdened threshold; future hikes will face affordability resistance.
Forward outlook
- Local home prices are declining (-3.0%/yr); year-one equity from $2k of loan paydown is wiped out by about $10k of value loss. Plan a longer hold.
- Cuyahoga County population projected to shrink 8% by 2050 — rents likely to lag national; underwrite the cash flow, not the appreciation.
Negotiation context
- It's been on market 19 days — a 2% lower offer ($324k) is reasonable based on typical stale-listing flexibility.
- 2 sale attempts with the ask held roughly flat each time — persistent listings suggest the price (not the market) is what's stuck; bring a comps-based counter.
- Current owner paid $134k; list at $329k implies a 146% gain — meaningful room to come down on a strong offer.
Risks & watch-outs
- Watch-outs: property tax is 2.7% of price; built in 1950 — expect roof / HVAC / electrical / plumbing capex.
Questions for the listing agent
- Can we see the unit-by-unit rent roll, current vacancy, and any below-market leases? What's the average tenancy length?
- What capital expenditures (roof, boiler, parking lot, exteriors) have been made in the last 5 years, and what's planned in the next 2?
- Built in 1950 — when were the roof, HVAC, electrical panel, plumbing, and water heater last replaced?
- Property tax is high relative to price — has the assessment been appealed recently, and will the sale trigger a re-assessment?
- Is there a deadline driving the sale (1031 exchange, divorce, estate, relocation)? That informs how much negotiation room exists.
- Schools are A-rated — typically a magnet for longer-tenancy family renters. What's the average tenant stay here, and is there a school-zone premium baked into asking?
- What's the average days-on-market for RENTAL listings here right now (not sales)? A rising rental-DOM trend means longer vacancies and softer asking-rent achievability than the comps imply.
- What's the recent tenant-quality profile in this submarket — average credit score on applications, eviction rate, late-payment / NSF rate, and stable-employment percentage? A property-management company in the area should have these aggregated.
- How much new apartment / multifamily construction is in the pipeline within 1–3 miles? Heavy new supply (>2% of stock underway) typically softens rents 12–24 months out; light construction supports rent growth.
Investment metrics
- 1% rule
- 1.12% ✓
- Cap rate
- 7.42%
- Cash-on-cash
- 4.02%
- DSCR
- 1.18
- GRM
- 7.5
CMA / ARV
- ARV (on-the-fly)
- $327,290
- Comps found
- 12
Show comp detail 12 sales within ~0.75 mi
| Address | Dist | Beds/Ba | Sqft | Sold | Price | $/sf | Match |
|---|---|---|---|---|---|---|---|
| 19829 Winslow Rd | 0.00mi | 6/4.0 | 2,846 (0%) | 1mo | $319,000 | $112 | 99 |
| 19406 Chagrin Blvd | 0.18mi | 6/4.0 | 2,942 (+3%) | 2mo | $352,000 | $120 | 85 |
| 19229 Winslow Rd | 0.18mi | 6/3.0 | 3,037 (+7%) | 7mo | $390,000 | $128 | 70 |
| 19239 Winslow Rd | 0.17mi | 6/2.0 | 2,656 (-7%) | 5mo | $217,000 | $82 | 68 |
| 3653 Winchell Rd | 0.56mi | 7/3.5 (+1) | 2,695 (-5%) | 4mo | $292,000 | $108 | 54 |
| 18424 Newell Rd | 0.54mi | 6/3.0 | 2,688 (-6%) | 9mo | $310,000 | $115 | 54 |
| 18423 Winslow Rd | 0.53mi | 6/3.0 | 2,975 (+4%) | 13mo | $326,000 | $110 | 53 |
| 18520 Winslow Rd | 0.47mi | 6/2.0 | 2,542 (-11%) | 2mo | $331,600 | $130 | 51 |
| 18427 Winslow Rd | 0.52mi | 6/3.0 | 2,424 (-15%) | 1mo | $334,000 | $138 | 46 |
| 18405 Newell Rd | 0.56mi | 7/3.5 (+1) | 3,094 (+9%) | 11mo | $310,000 | $100 | 43 |
| 18412 Winslow Rd | 0.55mi | 6/3.0 | 2,497 (-12%) | 12mo | $295,000 | $118 | 40 |
| 17928 Winslow Rd | 0.70mi | 7/3.0 (+1) | 3,150 (+11%) | 3mo | $336,500 | $107 | 38 |
Match score weights: distance 35% · size 25% · config 20% · recency 20%. Top-matched comps best support the ARV.
Projected returns pro-forma
-3.0% appreciation · 1.15% rent growth · sell at horizon
- IRR
- -12.3%
- Equity multiple
- 0.56×
- Total profit
- $-40,096
- Equity at exit
- $49,055
- IRR
- -6.5%
- Equity multiple
- 0.62×
- Total profit
- $-35,101
- Equity at exit
- $28,446
Cash invested: $92,120 (down + closing). Projections, not guarantees.
Landlord ↔ Tenant lean methodology
- Overall (STATE)
- 73 Landlord-Friendly
- State Ohio
- 73 Landlord-Friendly · R+6
- County
- — inherits STATE
- City
- — inherits STATE
ZIP-level market 44122
- Rents YoY
- 1.1%
- Active inventory
- 177
- Price-to-rent
- 14.9×
Monthly cashflow live
- Estimated rent
- $3,674 high interval (Pro) →
- Mortgage (P&I)
- −$1,725
- Tax from tax record
- −$731 /mo · $8,773/yr
- Insurance
- −$137
- HOA
- −$0
- Vacancy / Maint / Mgmt
- −$772
- Net cashflow
- $309
Break-even live
2-unit breakdown (identical units grouped — click to expand)
| Units | Beds | Baths | Est. rent |
|---|---|---|---|
| 2× units | 3 | 2 | $3,674 |
| #1 | 3 | 2 | $1,837 |
| #2 | 3 | 2 | $1,837 |
| Total (2 units) | $3,674 | ||
UW: 25.0% down · 7.5% · 30yr · 1.5% tax · 5.0% vac · 8.0% maint · 8.0% mgmt
Financing live
Cash to close
- Down payment
- $82,250
- Closing costs
- $9,870
- Reserves months
- —
- Total cash needed
- —
Loan-product check · same deal, 3 products live
Conventional
25% down · 7.5% · 30yr
- Down + closing
- —
- Monthly P&I
- —
- Monthly cashflow
- —
- DSCR
- —
- Eligible?
- —
Personal DTI + credit; lowest rate.
DSCR
20% down · 8.5% · 30yr
- Down + closing
- —
- Monthly P&I
- —
- Monthly cashflow
- —
- DSCR
- —
- Eligible?
- —
No personal income docs; deal must DSCR.
Hard money
10% down · 12.0% · 12mo
- Down + closing
- —
- Monthly P&I
- —
- Monthly cashflow
- —
- DSCR
- —
- Eligible?
- —
Short-term bridge; refi at stabilization.
Rent comps 1 comps
| Address | Beds | Baths | Sqft | Rent | $/sqft | DOM | Units | Dist |
|---|---|---|---|---|---|---|---|---|
| 2975 Claremont Rd Shaker Heights, OH | 5.0 | 3.0 | 3241 | $3,200 | $0.99 | 11d | 1 | 0.77mi |
Listing history 6 events
-
2026-05-05status Pending
-
2026-04-27historical Contingent
-
2026-04-14$329,000 Active
-
2025-04-25historical $1,500
-
2025-04-11$1,500
-
2020-11-30soldstatus $133,500
ⓘ Source: listings_history table (triggers on properties + properties_extension) + one-shot
backfill from property_details.listing_events for pre-trigger history.
Tax reassessment forecast OH · Partial reset (capped growth)
- Current annual tax
- $8,773 · $731/mo
- Projected year-2 tax
- $8,773 · $731/mo
- Expected delta
- $0/yr ($0/mo · 0.0%)
ⓘ Screening estimate from a state-policy table — verify with the county assessor before closing.
Climate risk First Street
- Flood 1/10 Low FEMA zone X (unshaded) · 0% chance over 30 yrs
- Wildfire 1/10 Low
- Heat 2/10 Low 7 d/yr ≥95°F today · 17 d/yr by 30 yrs out
- Wind 1/10 Low
- Air quality 3/10 Moderate 2 unhealthy d/yr today · 5 by 30 yrs out
Nearby sold comps map
Loading sold comps map…
Walkable amenities ~0.75 mi
Loading nearby amenities…
Taxation est. · year 1
- Rental income
- $44,088
- − Mortgage interest
- −$18,429
- − Property taxes
- −$8,773
- − Insurance
- −$1,645
- − Repairs & maintenance
- −$3,527
- − Management
- −$3,527
- − Depreciation
- −$9,571
- Taxable loss
- −$1,384
- Est. tax savings @ 24.0%
- +$332
- After-tax cash flow
- $4,040/yr
For passive investors: Depreciation is non-cash, so a rental often shows a tax loss while cash-flowing — sheltering income. Rental losses are passive: they offset passive income freely, and up to $25,000/yr can offset ordinary (W-2) income if you actively participate and your MAGI is under $100k (phasing out to $0 by $150k); unused losses carry forward. On sale, claimed depreciation is recaptured at up to 25%, and gains may owe capital-gains tax (a 1031 exchange can defer both). Figures are a year-1 estimate at your 24.0% rate — not tax advice; consult a CPA.
Schools (NCES district)
- District
- Shaker Heights City
- NCES district ID
- 3904475
- Math proficiency
- 50% ▼ -16.00%
- Reading proficiency
- 63% ▼ -6.00%
- Median HH income
- $69,421
- Composite
- 49.98/100
- National rank
- #1928
- State rank
- #309 of 656 in OH
Livability — Shaker Heights
- Score
- 89/100
- State rank
- #15
- US rank
- #134
Category grades
Schools grade is shown separately in the Schools card above.
Census & demographics
- Census place
- Shaker Heights, OH
- County
- Cuyahoga County · 1,090,369 people
- City population
- 69,880
- Metro
- Cleveland-Elyria, OH
- Population (ZIP)
- 36,678
- Household income
- $101,230
- Rent vs Own
- Severe rent burden
- 1294.0
Population outlook (Cuyahoga County) Hauer SSP2
- Today (2025)
- 1,244,621 people
- By 2030
- 1,230,093 · -1.2%
- By 2040
- 1,189,108 · -4.5%
- By 2050
- 1,145,706 · -7.9%
- By 2075
- 1,076,557 · -13.5%
- By 2100
- 978,987 · -21.3%
Race, ethnicity, and origin ACS 2023
- Neighborhood character
- Diverse neighborhood (Simpson 0.59)
- Race & ethnicity
- White 56% Black 29% Asian 6% Two or more races 6% Hispanic / Latino 3%
- Common ancestry
- Romanian 6% Scotch-Irish 5% Italian 2%
- Foreign-born
- 12% · Canada, China
- Languages at home
- 85% English-only · Spanish 3% Other Indo-European 3% Chinese 2%
Political lean MEDSL · Cuyahoga
- 2024 margin
- Solid D (+31.5) · D 65.4% · R 33.9%
- 2008→2024 swing
- -7.4pp toward R · 2008: 38.9pp · 2024: 31.5pp
- All cycles
- 2024: D+31.5 2020: D+34.1 2016: D+35.0 2012: D+38.7 2008: D+38.9
Not yet ingested
- Civics
- —
Market trends
- HPI YoY
- ▼ -268.81%
- Current HPI
- 200.5087
- Rent YoY
- ▲ 1.15%
- Metro
- Cleveland-Elyria, OH
- State GDP YoY
- ▲ 1.98%
- F500 in state
- 48
Industry mix (Fortune 500 HQ in OH)
| Industry | F500 HQs | Revenue |
|---|---|---|
| Insurance | 3 | $145B |
|
||
| Industrial Machinery | 3 | $49B |
|
||
| Financial Services | 3 | $24B |
|
||
| Consumer Goods | 2 | $93B |
|
||
| Aerospace / Defense | 2 | $47B |
|
||
| Utilities | 2 | $33B |
|
||
Price history
+146.4% since first listed6 events — show timeline
- 2026-05-05 Pending — MLSNOW
- 2026-04-27 Contingent — MLSNOW
- 2026-04-14 Listed $329,000 MLSNOW
- 2025-04-25 Rental Removed $1,500 RENTALBEAST
- 2025-04-11 Listed for Rent $1,500 RENTALBEAST
- 2020-11-30 Sold (Public Records) $133,500 Public Records
Property tax history
+4.2%/yrLatest (2025): $8,773 · +13.4% YoY. Source: county tax records.
Cash-flow waterfall
monthlySold comps — $/sqft
last 12 mo · ≤1 miLoading sold comps…