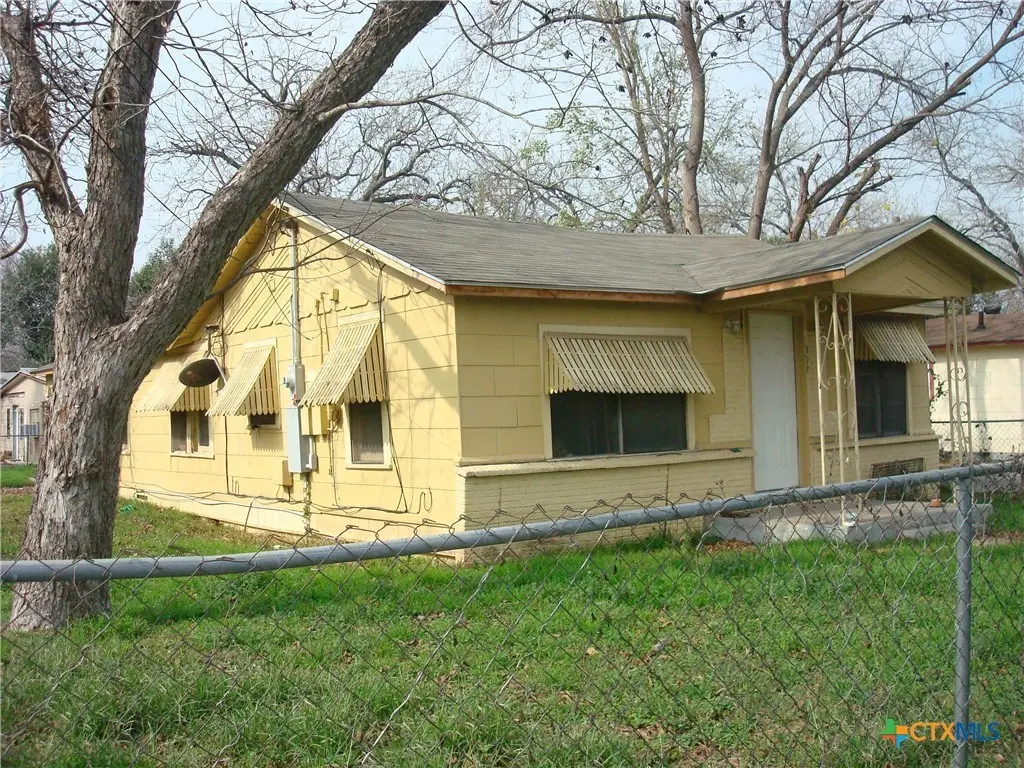
802 Campbell St · Seguin, TX
Flood risk 1/10 · Minimal
- FEMA flood zone
- X (unshaded)
- Chance of flooding over 30 yrs
- 0.0%
- Est. flood insurance / yr
- $507 – $1,088
Fire risk 1/10 · Minimal
- Est. fire insurance / yr
- $1,222 – $2,270
Heat risk 8/10 · Major
- Hot days now (above 108°F)
- 7 days/yr
- Hot days in 30 yrs
- 22 days/yr
Wind risk 8/10 · Major
- Chance of severe wind over 30 yrs
- 80.0%
Air-quality risk 1/10 · Minimal
- Unhealthy air days now
- 0 days/yr
- Unhealthy air days in 30 yrs
- 0 days/yr
Risk factors via First Street. Map © Google.
Why this score? — see what drove the B- grade
The composite is a weighted blend of 9 inputs, each scored 0–100. Each bar is that input's sub-score; the figure is the points it added to the 100-point composite (weight × sub-score).
- Cash flow +26.9/30.0
- ARV discount +15.0/15.0
- DSCR +9.3/10.0
- 1% rule +6.8/10.0
- Livability +3.3/5.0
- Rent growth +3.0/5.0
- Condition / age +2.5/5.0
- Schools +2.4/10.0
- Appreciation +0.0/10.0
$122,500
🖨 Deal sheet 📄 Offer letter ✓ Due diligence
Listing remarks MLS
Partially remodeled. New vinyl plank flooring and freshly painted throughout! Situated on a chain link fenced corner lot with mature trees & within walking distance to Ball Elementary School, the 47 Acre Park West and TLU. Partially remodeled and being sold in its present AS IS condition. A great opportunity for the DIY person.
Key facts
- Mature trees
- 5,227 sq ft lot
- Parking
Tags
Neighborhood map
What this means for you Summary
Snapshot
- This is a 3-bed/1.0-bath single-family listed at $122k.
Deal economics
- At list price, monthly cash flow is $340 ($4k/yr) — positive.
- The deal already cash-flows at list — no discount required.
- Meets the 1% rule at list price ($1k rent vs $122k).
- Recommended offer: $108k (12.0% below list) — sets the bar for market timing.
- Cap rate 9.6% vs local median 3.7% in Seguin — top-decile yield for the area; either an underpriced asset or a hidden risk that comps aren't pricing in. Stress-test before assuming the spread holds.
Location & tenants
- Location reads 66/100 on livability (#592 in TX) — a middle-class / working-renter tenant base. Strengths: cost of living A+, housing A+; Watch: employment D, schools F, amenities F.
- Seguin ISD (town): math 26% / reading 30% proficiency, ranked #663 of 826 in TX (top 80%) — low school quality limits family demand, transient renter base, plan for 1-2y turnover; 63% free/reduced lunch — lower-income household profile, screen leases tightly.
- Market conditions: Rents rising (+2.0%/yr); 1342 active listings in the ZIP; 34 comparable units currently listed for rent nearby; rentals at typical pace (median 22d on market — plan ~3-4 weeks tenant-placement turnaround); 2,064 units permitted in Guadalupe County in 2024 (133 in 5+ unit buildings).
Forward outlook
- Local home prices are declining (-3.0%/yr); year-one equity from $847 of loan paydown is wiped out by about $4k of value loss. Plan a longer hold.
- Guadalupe County population projected at +61% by 2050 — long-run rental-demand tailwind backs the buy-and-hold thesis.
Negotiation context
- It's been on market 161 days — a 12% lower offer ($108k) is reasonable based on typical stale-listing flexibility.
Risks & watch-outs
- Watch-outs: built in 1953 — expect roof / HVAC / electrical / plumbing capex.
- Climate carrying-cost: severe wind risk, 80% chance of damaging wind over 30y; extreme-heat days projected 7→22/yr by 2055 (HVAC capex compounding) — expect insurance premiums to compound above CPI over the hold.
Questions for the listing agent
- It's been on market 161 days. Have you received any prior offers? Is the seller open to a 12% concession, seller financing, or rate buy-down credit?
- Built in 1953 — when were the roof, HVAC, electrical panel, plumbing, and water heater last replaced?
- Why hasn't it sold? Are there any deal-killer items the seller is aware of (foundation, flood, title, zoning, code violations)?
- Is there a deadline driving the sale (1031 exchange, divorce, estate, relocation)? That informs how much negotiation room exists.
- Schools are F-rated, which usually means shorter tenancies and higher turnover. Who's the typical renter profile here, and what's been the actual vacancy rate?
- What's the average days-on-market for RENTAL listings here right now (not sales)? A rising rental-DOM trend means longer vacancies and softer asking-rent achievability than the comps imply.
- What's the recent tenant-quality profile in this submarket — average credit score on applications, eviction rate, late-payment / NSF rate, and stable-employment percentage? A property-management company in the area should have these aggregated.
- How much new for-sale + rental construction is in the pipeline within 1–3 miles? Heavy new supply typically softens prices + rents 12–24 months out; constrained supply supports both.
Investment metrics
- 1% rule
- 1.18% ✓
- Cap rate
- 9.63%
- Cash-on-cash
- 11.91%
- DSCR
- 1.53
- GRM
- 7.1
CMA / ARV
- ARV (median comp)
- $169,036
- List price
- $122,500
- Delta
- -27.53%
- Verdict
- UNDERPRICED
- Comps
- 20 within 1.0 mi
Show comp detail 12 sales within ~0.75 mi
| Address | Dist | Beds/Ba | Sqft | Sold | Price | $/sf | Match |
|---|---|---|---|---|---|---|---|
| 608 San Antonio | 0.23mi | 3/1.0 | 1,116 (+1%) | 4mo | $159,500 | $143 | 84 |
| 767 Taylor Ave | 0.37mi | 3/1.0 | 1,084 (-2%) | 4mo | $169,000 | $156 | 77 |
| 934 Campbell St | 0.16mi | 3/2.0 | 1,090 (-1%) | 16mo | $239,990 | $220 | 73 |
| 805 Jones Ave | 0.19mi | 3/2.0 | 1,189 (+8%) | 14mo | $235,900 | $198 | 63 |
| 705 4th St | 0.24mi | 2/1.0 (-1) | 1,196 (+8%) | 13mo | $92,000 | $77 | 59 |
| 212 Duggan St | 0.63mi | 2/1.0 (-1) | 1,106 (+0%) | 7mo | $175,900 | $159 | 59 |
| 701 W Kingsbury St | 0.33mi | 3/2.0 | 1,050 (-5%) | 16mo | $156,999 | $150 | 59 |
| 426 Vaughan Ave | 0.41mi | 2/1.0 (-1) | 992 (-10%) | 4mo | $70,000 | $71 | 56 |
| 702 Baker | 0.53mi | 3/1.0 | 1,202 (+9%) | 8mo | $168,500 | $140 | 54 |
| 1416 Sixth St | 0.43mi | 3/2.0 | 1,189 (+8%) | 12mo | $229,500 | $193 | 53 |
| 413 Vickers Ave | 0.47mi | 3/1.5 | 960 (-13%) | 5mo | $199,000 | $207 | 50 |
| 974 Baker | 0.64mi | 2/1.0 (-1) | 1,268 (+15%) | 14mo | $199,999 | $158 | 28 |
Match score weights: distance 35% · size 25% · config 20% · recency 20%. Top-matched comps best support the ARV.
Projected returns pro-forma
-3.0% appreciation · 2.04% rent growth · sell at horizon
- IRR
- 0.3%
- Equity multiple
- 1.01×
- Total profit
- $436
- Equity at exit
- $18,265
- IRR
- 9.0%
- Equity multiple
- 1.66×
- Total profit
- $22,706
- Equity at exit
- $10,592
Cash invested: $34,300 (down + closing). Projections, not guarantees.
Landlord ↔ Tenant lean methodology
- Overall (STATE)
- 87 Strongly Landlord-Friendly
- State Texas
- 87 Strongly Landlord-Friendly · R+5
- County
- — inherits STATE
- City
- — inherits STATE
ZIP-level market 78155
- Rents YoY
- 2.0%
- Active inventory
- 1342
- Price-to-rent
- 7.1×
Monthly cashflow live
- Estimated rent
- $1,441 high interval (Pro) →
- Mortgage (P&I)
- −$642
- Tax from tax record
- −$105 /mo · $1,254/yr
- Insurance
- −$51
- HOA
- −$0
- Vacancy / Maint / Mgmt
- −$303
- Net cashflow
- $340
Break-even live
UW: 25.0% down · 7.5% · 30yr · 1.5% tax · 5.0% vac · 8.0% maint · 8.0% mgmt
Financing live
Cash to close
- Down payment
- $30,625
- Closing costs
- $3,675
- Reserves months
- —
- Total cash needed
- —
Loan-product check · same deal, 3 products live
Conventional
25% down · 7.5% · 30yr
- Down + closing
- —
- Monthly P&I
- —
- Monthly cashflow
- —
- DSCR
- —
- Eligible?
- —
Personal DTI + credit; lowest rate.
DSCR
20% down · 8.5% · 30yr
- Down + closing
- —
- Monthly P&I
- —
- Monthly cashflow
- —
- DSCR
- —
- Eligible?
- —
No personal income docs; deal must DSCR.
Hard money
10% down · 12.0% · 12mo
- Down + closing
- —
- Monthly P&I
- —
- Monthly cashflow
- —
- DSCR
- —
- Eligible?
- —
Short-term bridge; refi at stabilization.
Rent comps 34 comps
| Address | Beds | Baths | Sqft | Rent | $/sqft | DOM | Units | Dist |
|---|---|---|---|---|---|---|---|---|
| 906 San Antonio Ave Seguin, TX | 2.0 | 1.0 | 1020 | $1,100 | $1.08 | 43d | 1 | 0.12mi |
| 917 8th St Seguin, TX | 3.0 | 2.0 | 1298 | $1,375 | $1.06 | 4d | 1 | 0.13mi |
| 508 Pitts St Seguin, TX | 3.0 | 1.0 | 973 | $1,275 | $1.31 | 12d | 1 | 0.32mi |
| 1331 Hidalgo St Seguin, TX | 3.0 | 2.0 | 1298 | $1,364 | $1.05 | 21d | 1 | 0.46mi |
| 404 W Walnut St Seguin, TX | 2.0 | 1.0 | 996 | $1,550 | $1.56 | 43d | 1 | 0.50mi |
| 772 Mitchell Ave Seguin, TX | 3.0 | 2.0 | 1298 | $1,560 | $1.20 | 4d | 1 | 0.71mi |
| 201 E Kingsbury St Seguin, TX | 2.0 | 1.0 | 856 | $1,095 | $1.28 | 23d | 1 | 0.75mi |
| 201 E Kingsbury St Seguin, TX | 2.0 | 1.0 | 856 | $1,095 | $1.28 | 14d | 1 | 0.75mi |
| 809 Leissner St Seguin, TX | 2.0 | 1.0 | 1020 | $1,175 | $1.15 | 23d | 1 | 0.82mi |
| 1701 N Guadalupe St Seguin, TX | 3.0 | 2.0 | 1028 | $1,464 | $1.42 | 4d | 1 | 0.84mi |
| 402 Trefger St Seguin, TX | 3.0 | 2.0 | 1096 | $1,395 | $1.27 | 23d | 1 | 0.88mi |
| 415 Hudson St Seguin, TX | 3.0 | 2.0 | 1076 | $1,345 | $1.25 | 14d | 1 | 0.93mi |
| 1601 Hays St Seguin, TX | 3.0 | 2.0 | 1090 | $1,275 | $1.17 | 4d | 1 | 0.95mi |
| 450 Wallace St Seguin, TX | 3.0 | 2.0 | 1392 | $1,700 | $1.22 | 43d | 1 | 0.96mi |
| 502 Hudson St Seguin, TX | 3.0 | 2.0 | 1076 | $1,345 | $1.25 | 20d | 1 | 0.98mi |
| 502 Hudson St Seguin, TX | 3.0 | 2.0 | 1076 | $1,345 | $1.25 | 21d | 1 | 0.98mi |
| 527 Elley St Seguin, TX | 3.0 | 3.0 | 1090 | $1,325 | $1.22 | 23d | 1 | 1.01mi |
| 516 Hudson St Seguin, TX | 3.0 | 2.0 | 1150 | $1,450 | $1.26 | 43d | 1 | 1.01mi |
| 223 W Baxter St Seguin, TX | 3.0 | 2.0 | 1298 | $1,664 | $1.28 | 1d | 1 | 1.03mi |
| 726 E Humphreys St Seguin, TX | 3.0 | 2.0 | 1248 | $1,500 | $1.20 | 23d | 1 | 1.07mi |
| 714 S River St Unit B Seguin, TX | 3.0 | 1.0 | 936 | $1,285 | $1.37 | 23d | 1 | 1.09mi |
| 227 Lopez St Seguin, TX | 3.0 | 2.0 | 1298 | $1,249 | $0.96 | 12d | 1 | 1.18mi |
| 222 Garcia St Seguin, TX | 3.0 | 2.0 | 1298 | $1,215 | $0.94 | 1d | 1 | 1.19mi |
| 228 Garcia St Seguin, TX | 3.0 | 2.0 | 1298 | $1,275 | $0.98 | 4d | 1 | 1.19mi |
| 219 Garcia St Seguin, TX | 3.0 | 2.0 | 1298 | $1,449 | $1.12 | 4d | 1 | 1.21mi |
| 908 Pecan St Seguin, TX | 3.0 | 1.0 | 924 | $1,300 | $1.41 | 16d | 1 | 1.26mi |
| 526 E Baxter St Seguin, TX | 3.0 | 2.0 | 1255 | $1,350 | $1.08 | 23d | 1 | 1.30mi |
| 324 Mar Hill St Seguin, TX | 3.0 | 2.5 | 1236 | $1,395 | $1.13 | 16d | 1 | 1.32mi |
| 968 E Cedar St Unit 1 Seguin, TX | 2.0 | 1.0 | 856 | $995 | $1.16 | 43d | 1 | 1.34mi |
| 2551 N Guadalupe St Unit 3108 Seguin, TX | 4.0 | 2.0 | 1263 | $1,449 | $1.15 | 23d | 1 | 1.44mi |
| 2551 N Guadalupe St Seguin, TX | 1.0–4.0 | 1.0–2.0 | 955 | $1,278 | $1.34 | 19d | 5 | 1.44mi |
| 2551 N Guadalupe St Unit 2111 Seguin, TX | 2.0 | 2.0 | 847 | $1,125 | $1.33 | 43d | 1 | 1.44mi |
| 2551 N Guadalupe St Unit 4106 Seguin, TX | 3.0 | 2.0 | 1084 | $1,300 | $1.20 | 43d | 1 | 1.44mi |
| 2551 N Guadalupe St Unit 1308 Seguin, TX | 4.0 | 2.0 | 1263 | $1,449 | $1.15 | 43d | 1 | 1.44mi |
Listing history 17 events
-
2026-06-18days on market $122,500 Active 161 DOM
-
2026-06-17days on market $122,500 Active 160 DOM
-
2026-06-16days on market $122,500 Active 159 DOM
-
2026-06-13remarks 345-char remark
-
2026-06-13pricedays on market $122,500 Active 156 DOM
-
2026-06-09days on market $129,000 Active 152 DOM
-
2026-06-08days on market $129,000 Active 151 DOM
-
2026-06-07days on market $129,000 Active 150 DOM
-
2026-06-04days on market $129,000 Active 147 DOM
-
2026-06-03days on market $129,000 Active 146 DOM
-
2026-06-02days on market $129,000 Active 145 DOM
-
2026-06-01days on market $129,000 Active 144 DOM
-
2026-05-31days on market $129,000 Active 143 DOM
-
2026-04-12price $129,000 335-char remark
Show marketing remark (335 chars)
Partially remodeled. New vinyl plank flooring and freshly painted throughout! Situated on a chain link fenced corner lot with mature trees & within walking distance to Ball Elementary School, the 47 Acre Park West and TLU. Partially remodeled and being sold in its present AS IS condition. A great opportunity for the DIY person.
-
2026-01-07$135,500 Active 335-char remark
Show marketing remark (335 chars)
Partially remodeled. New vinyl plank flooring and freshly painted throughout! Situated on a chain link fenced corner lot with mature trees & within walking distance to Ball Elementary School, the 47 Acre Park West and TLU. Partially remodeled and being sold in its present AS IS condition. A great opportunity for the DIY person.
-
2025-09-26soldstatus
-
2025-09-26soldstatus
ⓘ Source: listings_history table (triggers on properties + properties_extension) + one-shot
backfill from property_details.listing_events for pre-trigger history.
Tax reassessment forecast TX · Resets to sale price
- Current annual tax
- $1,254 · $105/mo
- Projected year-2 tax
- $2,242 · $187/mo
- Expected delta
- +$988/yr (+$82/mo · 78.7%)
ⓘ Screening estimate from a state-policy table — verify with the county assessor before closing.
Climate risk First Street
- Flood 1/10 Low FEMA zone X (unshaded) · 0% chance over 30 yrs
- Wildfire 1/10 Low
- Heat 8/10 Severe 7 d/yr ≥108°F today · 22 d/yr by 30 yrs out
- Wind 8/10 Severe 80% chance of damaging wind over 30 yrs
- Air quality 1/10 Low 0 unhealthy d/yr today · 0 by 30 yrs out
Nearby sold comps map
Loading sold comps map…
Walkable amenities ~0.75 mi
Loading nearby amenities…
Taxation est. · year 1
- Rental income
- $17,290
- − Mortgage interest
- −$6,862
- − Property taxes
- −$1,254
- − Insurance
- −$612
- − Repairs & maintenance
- −$1,383
- − Management
- −$1,383
- − Depreciation
- −$3,564
- Taxable income
- $2,231
- Est. tax owed @ 24.0%
- −$536
- After-tax cash flow
- $3,548/yr
For passive investors: Depreciation is non-cash, so a rental often shows a tax loss while cash-flowing — sheltering income. Rental losses are passive: they offset passive income freely, and up to $25,000/yr can offset ordinary (W-2) income if you actively participate and your MAGI is under $100k (phasing out to $0 by $150k); unused losses carry forward. On sale, claimed depreciation is recaptured at up to 25%, and gains may owe capital-gains tax (a 1031 exchange can defer both). Figures are a year-1 estimate at your 24.0% rate — not tax advice; consult a CPA.
Schools (NCES district)
- District
- Seguin ISD
- NCES district ID
- 4839690
- Math proficiency
- 26% ▼ -8.00%
- Reading proficiency
- 30% ▼ -5.00%
- Median HH income
- $46,210
- Composite
- 24.17/100
- National rank
- #7738
- State rank
- #663 of 826 in TX
Livability — Seguin
- Score
- 66/100
- State rank
- #592
- US rank
- #11298
Category grades
Schools grade is shown separately in the Schools card above.
Census & demographics
- Census place
- Seguin, TX
- County
- Guadalupe County · 147,291 people
- City population
- 55,600
- Metro
- San Antonio-New Braunfels, TX
- Population (ZIP)
- 55,600
- Household income
- $71,039
- Rent vs Own
- Severe rent burden
- 1053.0
Population outlook (Guadalupe County) Hauer SSP2
- Today (2025)
- 196,854 people
- By 2030
- 220,210 · +11.9%
- By 2040
- 268,004 · +36.1%
- By 2050
- 316,333 · +60.7%
- By 2075
- 434,747 · +120.8%
- By 2100
- 520,447 · +164.4%
Race, ethnicity, and origin ACS 2023
- Neighborhood character
- Diverse neighborhood (Simpson 0.58)
- Race & ethnicity
- Hispanic / Latino 49% White 43% Two or more races 26% Black 5%
- Hispanic origin (detail)
- Mexican 41%
- Common ancestry
- Lithuanian 2% Slovak 1% Romanian 1%
- Foreign-born
- 8% · Canada
- Languages at home
- 74% English-only · Spanish 24% German/W. Germanic 1%
Political lean MEDSL · Guadalupe
- 2024 margin
- Strong R (+29.5) · D 34.8% · R 64.3%
- 2008→2024 swing
- +1.5pp toward D · 2008: -31.0pp · 2024: -29.5pp
- All cycles
- 2024: R+29.5 2020: R+24.2 2016: R+31.8 2012: R+35.1 2008: R+31.0
Not yet ingested
- Civics
- —
Market trends
- HPI YoY
- ▼ -147.43%
- Current HPI
- 160.5435
- Rent YoY
- ▲ 2.04%
- Metro
- San Antonio-New Braunfels, TX
- State GDP YoY
- ▲ 3.95%
- F500 in state
- 110
Industry mix (Fortune 500 HQ in TX)
| Industry | F500 HQs | Revenue |
|---|---|---|
| Energy | 16 | $1,198B |
|
||
| Technology | 5 | $198B |
|
||
| Engineering / Construction | 4 | $72B |
|
||
| Energy Services | 3 | $60B |
|
||
| Utilities | 3 | $41B |
|
||
| Healthcare | 2 | $330B |
|
||
Price history
-4.8% since first listed4 events — show timeline
- 2026-04-12 Price Changed $129,000 CTXMLS
- 2026-01-07 Listed $135,500 CTXMLS
- 2025-09-26 Sold (Public Records) — Public Records
- 2025-09-26 Sold (Public Records) — Public Records
Property tax history
-2.1%/yrLatest (2026): $1,254 · -27.0% YoY. Source: county tax records.
Cash-flow waterfall
monthlySold comps — $/sqft
last 12 mo · ≤1 miLoading sold comps…