 🌊 Lakefront
111 Crappie Lane Ln · Guntown, MS
Flood risk 1/10 · Minimal
- FEMA flood zone
- X (unshaded)
- Chance of flooding over 30 yrs
- 0.0%
- Est. flood insurance / yr
- $507 – $1,088
Fire risk 4/10 · Minor
- Est. fire insurance / yr
- $1,241 – $2,305
Heat risk 6/10 · Moderate
- Hot days now (above 108°F)
- 7 days/yr
- Hot days in 30 yrs
- 19 days/yr
Wind risk 5/10 · Moderate
- Chance of severe wind over 30 yrs
- 26.0%
Air-quality risk 1/10 · Minimal
- Unhealthy air days now
- 0 days/yr
- Unhealthy air days in 30 yrs
- 0 days/yr
Risk factors via First Street. Map © Google.
Why this score? — see what drove the D+ grade
The composite is a weighted blend of 9 inputs, each scored 0–100. Each bar is that input's sub-score; the figure is the points it added to the 100-point composite (weight × sub-score).
- Cash flow +15.3/30.0
- ARV discount +15.0/15.0
- DSCR +4.7/10.0
- 1% rule +3.6/10.0
- Livability +3.3/5.0
- Schools +3.0/10.0
- Rent growth +2.5/5.0
- Condition / age +2.5/5.0
- Appreciation +0.0/10.0
$139,900
🖨 Deal sheet (PDF) 📄 Offer letter ✓ Due diligence
Listing remarks
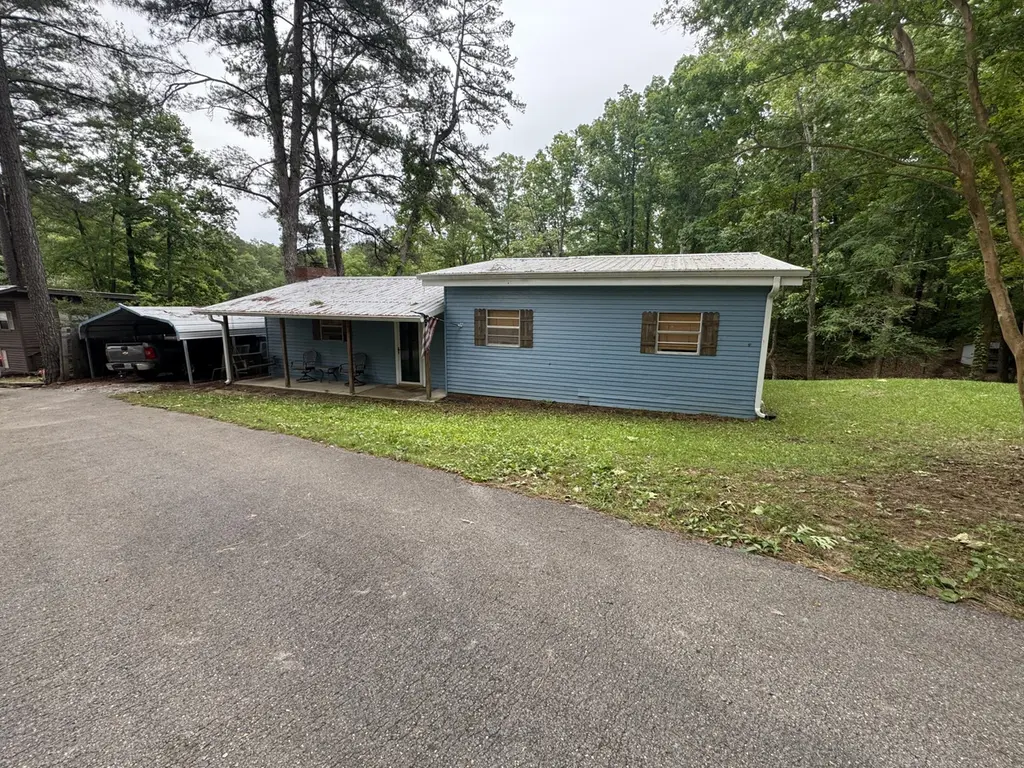
Enjoy beautiful water views from this charming cabin on Sportsman's Lake. This inviting getaway offers a stunning porch view overlooking the lake and shoreline perfect for fishing, relaxing, or launching a kayak. Inside, the cabin features an open floor plan, a metal roof, and vinyl siding, creating a low-maintenance exterior that lets you spend more time enjoying the lake and less time on upkeep. Whether you're looking for a weekend retreat or a peaceful full-time residence, this cabin delivers the ideal blend of comfort, simplicity, and lakeside living. Home is to be sold fully furnished.
Key facts
- Open floor plan
- Water views
- Metal roof
Tags
Property features AI
Finance
- HOA & community: Homeowners association with an annual fee of $200 (about $16.67/month)
Exterior
- Parking: Detached carport
- Home design: Single family residence; Residential property
- Exterior features: Metal roof; On the waterfront; Lot dimensions approximately 115 x 77
Interior
- Kitchen: Range, Refrigerator, Microwave
- Bathrooms: 1 full bathroom
- Heating & cooling: Has heating (type: Other); Has cooling (type: Other)
- Interior features: Range, Refrigerator, Microwave; 5 total rooms
Neighborhood map
What this means for you Summary
Snapshot
- This is a 2-bed/1.0-bath single-family listed at $140k.
Deal economics
- At list price, monthly cash flow is $50 ($602/yr) — positive.
- The deal already cash-flows at list — no discount required.
- To meet the 1% rule (rent ≥ 1% of price), the offer needs to be $121k (13.7% below list).
- Recommended offer: $121k (13.7% below list) — sets the bar for 1% rule.
Location & tenants
- Location reads 66/100 on livability (#98 in MS) — a middle-class / working-renter tenant base. Strengths: crime A+, cost of living A+, housing A+; Watch: schools D+, amenities F, commute F.
- Lee County School District (rural): math 37% / reading 35% proficiency, ranked #51 of 130 in MS (top 39%) — families likely to look elsewhere, expect single-tenant / working-renter base with shorter leases.
- Market conditions: 53 active listings in the ZIP; 154 units permitted in Lee County in 2024 (24 in 5+ unit buildings).
Forward outlook
- Local home prices are declining (-3.0%/yr); year-one equity from $967 of loan paydown is wiped out by about $4k of value loss. Plan a longer hold.
- Lee County population projected at +6% by 2050 — modest demand growth; plan on rents tracking national, not racing it.
Negotiation context
- It's been on market 40 days — a 3% lower offer ($136k) is reasonable based on typical stale-listing flexibility.
- 2 sale attempts; this cycle's ask has dropped $10k (7%) from the opening price — seller is motivated, your offer sets the floor, not the list.
- Current owner paid $35k; list at $140k implies a 300% gain — meaningful room to come down on a strong offer.
Risks & watch-outs
- Climate carrying-cost: moderate wind risk, 26% chance of damaging wind over 30y; extreme-heat days projected 7→19/yr by 2055 (HVAC capex compounding) — expect insurance premiums to compound above CPI over the hold.
Questions for the listing agent
- It's been on market 40 days. Have you received any prior offers? Is the seller open to a 14% concession, seller financing, or rate buy-down credit?
- Built in 1967 — when were the roof, HVAC, electrical panel, plumbing, and water heater last replaced?
- What does the HOA fee cover, when was the last increase, and are there any pending special assessments or reserve-fund shortfalls?
- Is there a deadline driving the sale (1031 exchange, divorce, estate, relocation)? That informs how much negotiation room exists.
- Schools are D-rated, which usually means shorter tenancies and higher turnover. Who's the typical renter profile here, and what's been the actual vacancy rate?
- The area grade is low — what's the realistic commute time and amenity access for the typical tenant pool here? Any planned neighborhood developments (good or bad) we should know about?
- This sits on a lake — are riparian / water-frontage rights deeded with the parcel? Any dock permits, shoreline easements, or HOA water-use restrictions?
- What's the documented flood / surge / shoreline-erosion history here (FEMA AND non-FEMA — e.g., storm surge, creek backup, septic-field saturation)?
- Any water-quality or seasonal algae-bloom issues that affect tenant satisfaction or short-term-rental demand?
- What's the average days-on-market for RENTAL listings here right now (not sales)? A rising rental-DOM trend means longer vacancies and softer asking-rent achievability than the comps imply.
- What's the recent tenant-quality profile in this submarket — average credit score on applications, eviction rate, late-payment / NSF rate, and stable-employment percentage? A property-management company in the area should have these aggregated.
- How much new for-sale + rental construction is in the pipeline within 1–3 miles? Heavy new supply typically softens prices + rents 12–24 months out; constrained supply supports both.
Investment metrics
- 1% rule
- 0.86% ✗
- Cap rate
- 6.72%
- Cash-on-cash
- 1.54%
- DSCR
- 1.07
- GRM
- 9.7
CMA / ARV
- ARV (median comp)
- $171,711
- List price
- $139,900
- Delta
- -18.53%
- Verdict
- UNDERPRICED
- Comps
- 20 within 2.0 mi
Projected returns pro-forma
-3.0% appreciation · 3.0% rent growth · sell at horizon
- IRR
- -13.9%
- Equity multiple
- 0.50×
- Total profit
- $-19,495
- Equity at exit
- $20,860
- IRR
- -5.1%
- Equity multiple
- 0.67×
- Total profit
- $-12,946
- Equity at exit
- $12,096
Cash invested: $39,172 (down + closing). Projections, not guarantees.
Landlord ↔ Tenant lean methodology
- Overall (STATE)
- 90 Strongly Landlord-Friendly
- State Mississippi
- 90 Strongly Landlord-Friendly · R+11
- County
- — inherits STATE
- City
- — inherits STATE
ZIP-level market 38849
- Home prices YoY
- -8.5%
- Active inventory
- 53
- Price-to-rent
- 9.7×
Monthly cashflow live
- Estimated rent
- $1,207 medium interval (Pro) →
- Mortgage (P&I)
- −$734
- Tax from tax record
- −$94 /mo · $1,130/yr
- Insurance
- −$58
- HOA
- −$17
- Vacancy / Maint / Mgmt
- −$253
- Net cashflow
- $50
Break-even live
Sensitivity live
| Price | -10% $129 | -5% $90 | +0% $50 | +5% $11 | +10% $-29 |
|---|---|---|---|---|---|
| Rent | -10% $-45 | -5% $3 | +0% $50 | +5% $98 | +10% $146 |
| Rate | -1.0pp $121 | -0.5pp $86 | base $50 | +0.5pp $14 | +1.0pp $-23 |
UW: 25.0% down · 7.5% · 30yr · 1.5% tax · 5.0% vac · 8.0% maint · 8.0% mgmt
Financing live
Cash to close
- Down payment
- $34,975
- Closing costs
- $4,197
- Reserves months
- —
- Total cash needed
- —
Loan-product check · same deal, 3 products live
Conventional
25% down · 7.5% · 30yr
- Down + closing
- —
- Monthly P&I
- —
- Monthly cashflow
- —
- DSCR
- —
- Eligible?
- —
Personal DTI + credit; lowest rate.
DSCR
20% down · 8.5% · 30yr
- Down + closing
- —
- Monthly P&I
- —
- Monthly cashflow
- —
- DSCR
- —
- Eligible?
- —
No personal income docs; deal must DSCR.
Hard money
10% down · 12.0% · 12mo
- Down + closing
- —
- Monthly P&I
- —
- Monthly cashflow
- —
- DSCR
- —
- Eligible?
- —
Short-term bridge; refi at stabilization.
HOA detail
- Monthly dues
- $17 · $204/yr
- Likely covers
- water
Listing history 16 events
-
2026-06-19days on market $139,900 Active 40 DOM
-
2026-06-18days on market $139,900 Active 39 DOM
-
2026-06-17days on market $139,900 Active 38 DOM
-
2026-06-16days on market $139,900 Active 37 DOM
-
2026-06-15days on market $139,900 Active 36 DOM
-
2026-06-14days on market $139,900 Active 34 DOM
-
2026-06-12statusdays on market $139,900 Active 33 DOM
-
2026-06-03status $139,900 Pending 32 DOM
-
2026-06-02days on market $139,900 Active 32 DOM
-
2026-06-01remarks 615-char remark
-
2026-06-01days on market $139,900 Active 31 DOM
-
2026-05-31days on market $139,900 Active 30 DOM
-
2026-05-30days on market $139,900 Active 29 DOM
-
2026-05-01$149,900 Active 597-char remark
-
2020-11-06soldstatus $35,000
-
2008-10-28soldstatus $36,000
ⓘ Source: listings_history table (triggers on properties + properties_extension) + one-shot
backfill from property_details.listing_events for pre-trigger history.
Tax reassessment forecast MS · Resets to sale price
- Current annual tax
- $1,130 · $94/mo
- Projected year-2 tax
- $1,130 · $94/mo
- Expected delta
- $0/yr ($0/mo · 0.0%)
ⓘ Screening estimate from a state-policy table — verify with the county assessor before closing.
Climate risk First Street
- Flood 1/10 Low FEMA zone X (unshaded) · 0% chance over 30 yrs
- Wildfire 4/10 Moderate
- Heat 6/10 Major 7 d/yr ≥108°F today · 19 d/yr by 30 yrs out
- Wind 5/10 Major 26% chance of damaging wind over 30 yrs
- Air quality 1/10 Low 0 unhealthy d/yr today · 0 by 30 yrs out
Nearby sold comps map
Loading sold comps map…
Walkable amenities ~0.75 mi
Loading nearby amenities…
Taxation est. · year 1
- Rental income
- $14,481
- − Mortgage interest
- −$7,837
- − Property taxes
- −$1,130
- − Insurance
- −$700
- − Repairs & maintenance
- −$1,158
- − Management
- −$1,158
- − HOA
- −$204
- − Depreciation
- −$4,070
- Taxable loss
- −$1,776
- Est. tax savings @ 24.0%
- +$426
- After-tax cash flow
- $1,028/yr
For passive investors: Depreciation is non-cash, so a rental often shows a tax loss while cash-flowing — sheltering income. Rental losses are passive: they offset passive income freely, and up to $25,000/yr can offset ordinary (W-2) income if you actively participate and your MAGI is under $100k (phasing out to $0 by $150k); unused losses carry forward. On sale, claimed depreciation is recaptured at up to 25%, and gains may owe capital-gains tax (a 1031 exchange can defer both). Figures are a year-1 estimate at your 24.0% rate — not tax advice; consult a CPA.
Schools (NCES district)
- District
- Lee County School District
- NCES district ID
- 2802550
- Math proficiency
- 37% ▼ -11.00%
- Reading proficiency
- 35% ▼ -6.00%
- Median HH income
- $41,435
- Composite
- 30.38/100
- National rank
- #6253
- State rank
- #51 of 130 in MS
Livability — Guntown
- Score
- 66/100
- State rank
- #98
- US rank
- #12145
Category grades
Schools grade is shown separately in the Schools card above.
Census & demographics
- Population (ZIP)
- 5,874
Population outlook (Lee County) Hauer SSP2
- Today (2025)
- 90,253 people
- By 2030
- 92,125 · +2.1%
- By 2040
- 94,914 · +5.2%
- By 2050
- 95,841 · +6.2%
- By 2075
- 94,189 · +4.4%
- By 2100
- 83,736 · -7.2%
Race, ethnicity, and origin ACS 2023
- Neighborhood character
- Predominantly White (81%)
- Race & ethnicity
- White 81% Black 14% Two or more races 4% Hispanic / Latino 3%
- Common ancestry
- Slovak 2% Italian 1% Lithuanian 1%
- Foreign-born
- 0% · Canada
- Languages at home
- 97% English-only · Spanish 2% German/W. Germanic 1%
Political lean MEDSL · Lee
- 2024 margin
- Solid R (+38.8) · D 30.0% · R 68.9% · Other 1.1%
- 2008→2024 swing
- -8.3pp toward R · 2008: -30.5pp · 2024: -38.8pp
- All cycles
- 2024: R+38.8 2020: R+32.5 2016: R+37.7 2012: R+29.0 2008: R+30.5
Not yet ingested
- Civics
- —
Market trends
- HPI YoY
- ▼ -15.64%
- Current HPI
- 168.9667
- Rent YoY
- —
- Metro
- —
- State GDP YoY
- —
- F500 in state
- 0
Price history
+288.6% since first listed6 events — show timeline
- 2026-06-11 Relisted — NEMSBD
- 2026-06-02 Pending — NEMSBD
- 2026-05-29 Price Changed $139,900 NEMSBD
- 2026-05-01 Listed $149,900 NEMSBD
- 2020-11-06 Sold (Public Records) $35,000 Public Records
- 2008-10-28 Sold (Public Records) $36,000 Public Records
Property tax history
+2.7%/yrLatest (2025): $1,130 · +1.3% YoY. Source: county tax records.
Cash-flow waterfall
monthlySold comps — $/sqft
last 12 mo · ≤1 miLoading sold comps…