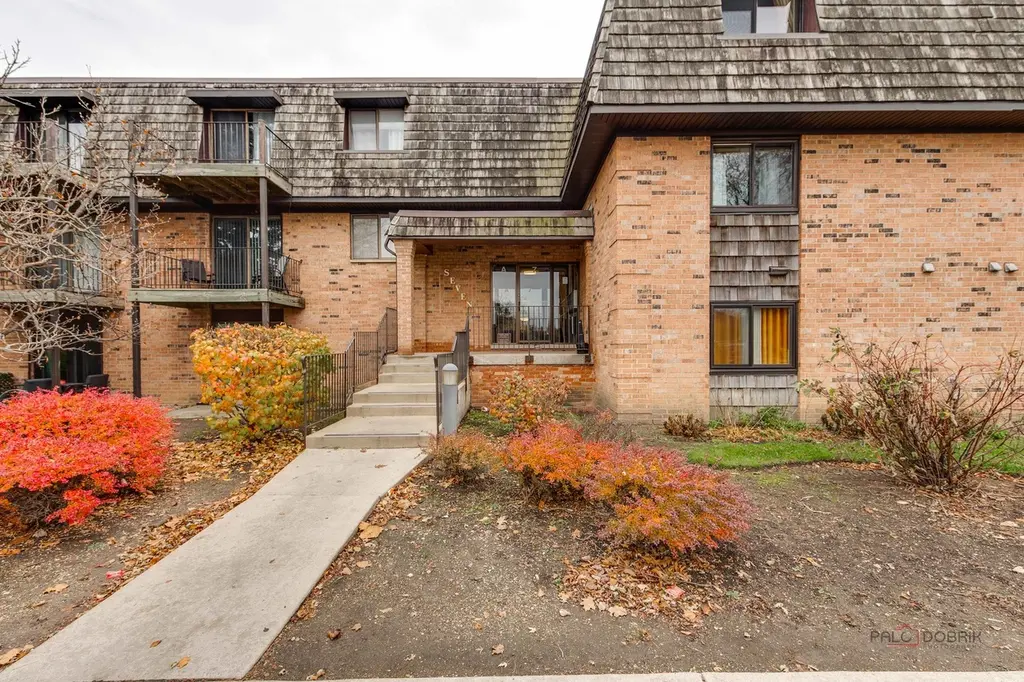
7 Oak Creek Dr #3703 · Buffalo Grove, IL
Flood risk 1/10 · Minimal
- FEMA flood zone
- X (unshaded)
- Chance of flooding over 30 yrs
- 0.0%
- Est. flood insurance / yr
- $507 – $1,088
Fire risk 1/10 · Minimal
- Est. fire insurance / yr
- $804 – $1,492
Heat risk 2/10 · Minimal
- Hot days now (above 99°F)
- 7 days/yr
- Hot days in 30 yrs
- 14 days/yr
Wind risk 2/10 · Minimal
- Chance of severe wind over 30 yrs
- —
Air-quality risk 3/10 · Minor
- Unhealthy air days now
- 3 days/yr
- Unhealthy air days in 30 yrs
- 4 days/yr
Risk factors via First Street. Map © Google.
Why this score? — see what drove the C- grade
The composite is a weighted blend of 9 inputs, each scored 0–100. Each bar is that input's sub-score; the figure is the points it added to the 100-point composite (weight × sub-score).
- Cash flow +19.7/30.0
- ARV discount +7.5/15.0
- DSCR +6.2/10.0
- 1% rule +5.8/10.0
- Schools +3.9/10.0
- Livability +3.9/5.0
- Rent growth +3.3/5.0
- Condition / age +2.5/5.0
- Appreciation +0.0/10.0
$215,900
🖨 Deal sheet 📄 Offer letter ✓ Due diligence
Listing remarks
Welcome to your new home! This spacious 2-bedroom, 2-bath condo sits proudly on the top floor, ensuring peace and quiet with no neighbors above. Imagine the ease of walking to the nearby restaurants, grocery store, or park - everything you need is just steps away. On-site, enjoy a big playground and a sparkling pool for sunny afternoons. It's the perfect blend of comfort, convenience, and community.
Key facts
- Big playground
- Top floor
- Grocery store
Tags
Property features AI
Finance
- Other: Parcel number: 03043000281173; Directions: Near Dundee Rd and Buffalo Grove Rd intersection
- HOA & community: Monthly association fee $546; Association fee covers heat, water, gas, parking, insurance, pool, lawn care, garbage (scavenger), and snow removal; Community amenities include coin laundry and storage; Pets not allowed
Exterior
- Parking: Two parking spaces; Parking included in association
- Security: Security door locks
- Utilities: Lake Michigan water; Public sewer
- Home design: Attached single condo; Entry level: 3rd floor; Condo ownership
- Construction: Brick construction; Estimated living area; Built approximately 41–50 years ago; Not rebuilt or rehabbed; Not built before 1978
- Exterior features: Common lot/grounds; Pool; Park; Lawn care and snow removal provided
Interior
- Kitchen: Kitchen on main level (16 x 8)
- Bedrooms: Master bedroom on main level (16 x 14); Second bedroom on main level (12 x 14); Two additional bedrooms
- Flooring: Wood laminate flooring in living room
- Bathrooms: Two full bathrooms
- Heating & cooling: Natural gas heating; Central air conditioning
- Interior features: Five total rooms; School bus service available
- Laundry & utility: Laundry room
Neighborhood map
What this means for you Summary
Snapshot
- This is a 2-bed/2.0-bath condo listed at $216k.
Deal economics
- At list price, monthly cash flow is $252 ($3k/yr) — positive.
- The deal already cash-flows at list — no discount required.
- Meets the 1% rule at list price ($2k rent vs $216k).
- Cap rate 7.7% vs local median 3.3% in Buffalo Grove — top-decile yield for the area; either an underpriced asset or a hidden risk that comps aren't pricing in. Stress-test before assuming the spread holds.
Location & tenants
- Location reads 77/100 on livability (#163 in IL, #3,025 nationally) — a middle-class / working-renter tenant base. Strengths: crime A+, employment A+, housing A+; Watch: amenities C-, health & safety C-, commute F.
- Township Hsd 214 (suburban): math 42% / reading 45% proficiency, ranked #103 of 620 in IL (top 17%) — families likely to look elsewhere, expect single-tenant / working-renter base with shorter leases.
- Zoned schools: Buffalo Grove High School (math 46% / reading 44%, grade D-, #59 of 693 statewide, top 9%, 1,959 students, 0% FRL).
- Market conditions: Rents rising (+3.3%/yr); 100 active listings in the ZIP; 35 comparable units currently listed for rent nearby; rentals leasing fast (median 1d on market — plan ~1-2 weeks tenant-placement turnaround); high-income renter base; 6,272 units permitted in Cook County in 2024 (4,658 in 5+ unit buildings).
Forward outlook
- Local home prices are declining (-3.0%/yr); year-one equity from $1k of loan paydown is wiped out by about $6k of value loss. Plan a longer hold.
Negotiation context
- Only 8 days on market — expect competitive offers; lowballing is unlikely to land.
- 9 sale attempts with the ask held roughly flat each time — persistent listings suggest the price (not the market) is what's stuck; bring a comps-based counter.
- Current owner paid $129k; list at $216k implies a 67% gain — meaningful room to come down on a strong offer.
Questions for the listing agent
- Built in 1979 — when were the roof, HVAC, electrical panel, plumbing, and water heater last replaced?
- Any open or pending special assessments — roof, HVAC, plumbing, elevator, façade? What's the per-unit balance and payoff schedule, and is the seller paying it off at close or rolling it to the buyer?
- Is there a deadline driving the sale (1031 exchange, divorce, estate, relocation)? That informs how much negotiation room exists.
- Schools are A-rated — typically a magnet for longer-tenancy family renters. What's the average tenant stay here, and is there a school-zone premium baked into asking?
- What's the average days-on-market for RENTAL listings here right now (not sales)? A rising rental-DOM trend means longer vacancies and softer asking-rent achievability than the comps imply.
- What's the recent tenant-quality profile in this submarket — average credit score on applications, eviction rate, late-payment / NSF rate, and stable-employment percentage? A property-management company in the area should have these aggregated.
- How much new apartment / multifamily construction is in the pipeline within 1–3 miles? Heavy new supply (>2% of stock underway) typically softens rents 12–24 months out; light construction supports rent growth.
Investment metrics
- 1% rule
- 1.08% ✓
- Cap rate
- 7.69%
- Cash-on-cash
- 5.00%
- DSCR
- 1.22
- GRM
- 7.7
CMA / ARV
No comps found within radius.
Projected returns pro-forma
-3.0% appreciation · 3.27% rent growth · sell at horizon
- IRR
- -8.2%
- Equity multiple
- 0.70×
- Total profit
- $-18,208
- Equity at exit
- $32,191
- IRR
- 1.8%
- Equity multiple
- 1.13×
- Total profit
- $7,804
- Equity at exit
- $18,667
Cash invested: $60,452 (down + closing). Projections, not guarantees.
Landlord ↔ Tenant lean methodology
- Overall (STATE)
- 43 Moderately Tenant-Leaning
- State Illinois
- 43 Moderately Tenant-Leaning · D+7
- County
- — inherits STATE
- City
- — inherits STATE
ZIP-level market 60089
- Rents YoY
- 3.3%
- Active inventory
- 100
- Price-to-rent
- 7.7×
Monthly cashflow live
- Estimated rent
- $2,327 high interval (Pro) →
- Mortgage (P&I)
- −$1,132
- Tax from tax record
- −$364 /mo · $4,367/yr
- Insurance
- −$90
- HOA
- −$0
- Vacancy / Maint / Mgmt
- −$489
- Net cashflow
- $252
Break-even live
UW: 25.0% down · 7.5% · 30yr · 1.5% tax · 5.0% vac · 8.0% maint · 8.0% mgmt
Financing live
Cash to close
- Down payment
- $53,975
- Closing costs
- $6,477
- Reserves months
- —
- Total cash needed
- —
Loan-product check · same deal, 3 products live
Conventional
25% down · 7.5% · 30yr
- Down + closing
- —
- Monthly P&I
- —
- Monthly cashflow
- —
- DSCR
- —
- Eligible?
- —
Personal DTI + credit; lowest rate.
DSCR
20% down · 8.5% · 30yr
- Down + closing
- —
- Monthly P&I
- —
- Monthly cashflow
- —
- DSCR
- —
- Eligible?
- —
No personal income docs; deal must DSCR.
Hard money
10% down · 12.0% · 12mo
- Down + closing
- —
- Monthly P&I
- —
- Monthly cashflow
- —
- DSCR
- —
- Eligible?
- —
Short-term bridge; refi at stabilization.
Rent comps 35 comps
| Address | Beds | Baths | Sqft | Rent | $/sqft | DOM | Units | Dist |
|---|---|---|---|---|---|---|---|---|
| 12 Oak Creek Dr #1213 Buffalo Grove, IL | 2.0 | 2.0 | 1150 | $2,300 | $2.00 | 1d | 1 | 0.08mi |
| 1533 Baldwin Ct Wheeling, IL | 1.0–2.0 | 1.0–1.5 | 850 | $2,565 | $3.02 | 1d | 16 | 0.44mi |
| 621 Hapsfield Ln #202 Buffalo Grove, IL | 2.0 | 2.0 | 1000 | $1,850 | $1.85 | 12d | 1 | 0.49mi |
| 621 Hapsfield Ln #202 Buffalo Grove, IL | 2.0 | 2.0 | 1000 | $1,850 | $1.85 | 5d | 1 | 0.49mi |
| 851 Miller Ln #208 Buffalo Grove, IL | 2.0 | 2.0 | 1150 | $1,850 | $1.61 | 1d | 1 | 0.79mi |
| 70 Buffalo Grove Rd Buffalo Grove, IL | 1.0–2.0 | 1.0–2.0 | 850 | $1,950 | $2.29 | 1d | 18 | 0.80mi |
| 1700 Hopi Trl Wheeling, IL | 3.0 | 2.5 | 1500 | $2,450 | $1.63 | 1d | 1 | 0.80mi |
| 446 Irvine Ct Wheeling, IL | 3.0 | 1.5 | 1700 | $2,800 | $1.65 | 24d | 1 | 0.85mi |
| 450 Manda Ln Wheeling, IL | 1.0–2.0 | 1.0–2.0 | 806 | $1,962 | $2.43 | 1d | 38 | 0.91mi |
| 3400 N Old Arlington Heights Rd Unit 202 Arlington Heights, IL | 2.0 | 2.0 | 1600 | $2,800 | $1.75 | 1d | 1 | 0.96mi |
| 3420 N Old Arlington Heights Rd #203 Arlington Heights, IL | 2.0 | 2.0 | 1300 | $2,600 | $2.00 | 1d | 1 | 0.97mi |
| 3420 N Old Arlington Heights Rd Arlington Heights, IL | 2.0 | 2.0 | 1650 | $2,650 | $1.61 | 20d | 1 | 0.97mi |
| 525 Commanche Trl Wheeling, IL | 3.0 | 1.5 | 1335 | $2,700 | $2.02 | 1d | 1 | 0.97mi |
| 3420 N Old Arlington Heights Rd Unit 208 Arlington Heights, IL | 2.0 | 2.0 | 1600 | $2,750 | $1.72 | 1d | 1 | 0.97mi |
| 1572 Teal Ln Wheeling, IL | 1.0–2.0 | 1.0–2.0 | 900 | $2,160 | $2.40 | 1d | 23 | 1.03mi |
| 2734 N Buffalo Grove Rd Arlington Heights, IL | 1.0–3.0 | 1.0–2.0 | 956 | $2,342 | $2.45 | 1d | 10 | 1.06mi |
| 1168 Middlebury Ln Unit A1 Wheeling, IL | 3.0 | 2.0 | 1200 | $2,700 | $2.25 | 11d | 1 | 1.07mi |
| 1542 Heather Ct Unit A2 Wheeling, IL | 3.0 | 2.0 | 1300 | $2,400 | $1.85 | 16d | 1 | 1.15mi |
| 576 Greystone Ln Unit C2 Wheeling, IL | 2.0 | 1.0 | 1200 | $2,400 | $2.00 | 12d | 1 | 1.15mi |
| 255 N Buffalo Grove Rd Buffalo Grove, IL | 2.0 | 2.0 | 1150 | $1,675 | $1.46 | 24d | 1 | 1.15mi |
| 1180 Northbury Ln Wheeling, IL | 3.0 | 2.0 | 1305 | $2,650 | $2.03 | 1d | 1 | 1.18mi |
| 1182 Northbury Ln Unit D2 Wheeling, IL | 2.0 | 2.0 | 1200 | $2,095 | $1.75 | 1d | 1 | 1.18mi |
| 1106 Wildberry Ct Unit B1 Wheeling, IL | 2.0 | 2.0 | 1100 | $2,500 | $2.27 | 10d | 1 | 1.18mi |
| 1106 Wildberry Ct Unit B1 Wheeling, IL | 2.0 | 2.0 | 1100 | $2,350 | $2.14 | 2d | 1 | 1.18mi |
| 313 W Happfield Dr Arlington Heights, IL | 1.0–2.0 | 1.0–2.0 | 835 | $2,277 | $2.73 | 1d | 18 | 1.21mi |
| 614 Le Parc Cir Unit 22-2 Buffalo Grove, IL | 2.0 | 1.0 | 1239 | $2,200 | $1.78 | 24d | 1 | 1.29mi |
| 733 Plum Tree Ct Unit C2 Wheeling, IL | 2.0 | 1.0 | 1100 | $2,150 | $1.95 | 1d | 1 | 1.32mi |
| 272 Le Parc Cir Buffalo Grove, IL | 3.0 | 2.5 | 1450 | $3,200 | $2.21 | 1d | 1 | 1.32mi |
| 939 S Fletcher Dr Wheeling, IL | 3.0 | 2.0 | 920 | $3,200 | $3.48 | 1d | 1 | 1.34mi |
| 869 Trace Dr Apt 201 Buffalo Grove, IL | 2.0 | 1.0 | 950 | $2,100 | $2.21 | 1d | 1 | 1.35mi |
| 362 Marion Ct Wheeling, IL | 3.0 | 2.0 | 1108 | $5,850 | $5.28 | 1d | 1 | 1.36mi |
| 850 Corey Ln Wheeling, IL | 1.0–2.0 | 1.0–1.5 | 900 | $2,099 | $2.33 | 1d | 21 | 1.36mi |
| 860 Trace Dr #8107 Buffalo Grove, IL | 2.0 | 1.0 | 950 | $2,100 | $2.21 | 1d | 1 | 1.37mi |
| 250 McHenry Rd Wheeling, IL | 1.0–3.0 | 1.0–2.0 | 1185 | $3,140 | $2.65 | 1d | 33 | 1.43mi |
| 1047 Auburn Ln Buffalo Grove, IL | 2.0 | 1.0 | 960 | $2,275 | $2.37 | 24d | 1 | 1.46mi |
HOA detail condo
- Monthly dues
- $0 · $0/yr
- Likely covers
- pool
- Assessments
- None detected in remarks — confirm with the listing agent.
Listing history 24 events
-
2026-05-21status Pending
-
2026-05-18status Active
-
2026-05-13status Pending
-
2026-05-08$215,900 Active
-
2026-05-08historical
-
2026-04-28Active
-
2026-04-28historical
-
2026-04-13Active
-
2026-04-13historical
-
2026-04-02Active
-
2026-04-02historical
-
2026-03-12Active
-
2026-03-12historical
-
2026-02-13price
-
2026-02-09status Active
-
2026-01-06historical Contingent - Continue to Show
-
2025-12-09Active
-
2025-12-09historical
-
2025-11-25Active
-
2002-02-27soldstatus $129,000
-
1998-03-06soldstatus $78,000
-
1993-09-10soldstatus $72,000
-
1991-05-06soldstatus $60,000
-
1983-07-12soldstatus $47,000
ⓘ Source: listings_history table (triggers on properties + properties_extension) + one-shot
backfill from property_details.listing_events for pre-trigger history.
Tax reassessment forecast IL · Partial reset (capped growth)
- Current annual tax
- $4,367 · $364/mo
- Projected year-2 tax
- $4,634 · $386/mo
- Expected delta
- +$267/yr (+$22/mo · 6.1%)
ⓘ Screening estimate from a state-policy table — verify with the county assessor before closing.
Climate risk First Street
- Flood 1/10 Low FEMA zone X (unshaded) · 0% chance over 30 yrs
- Wildfire 1/10 Low
- Heat 2/10 Low 7 d/yr ≥99°F today · 14 d/yr by 30 yrs out
- Wind 2/10 Low
- Air quality 3/10 Moderate 3 unhealthy d/yr today · 4 by 30 yrs out
Nearby sold comps map
Loading sold comps map…
Walkable amenities ~0.75 mi
Loading nearby amenities…
Taxation est. · year 1
- Rental income
- $27,920
- − Mortgage interest
- −$12,094
- − Property taxes
- −$4,367
- − Insurance
- −$1,080
- − Repairs & maintenance
- −$2,234
- − Management
- −$2,234
- − Depreciation
- −$6,281
- Taxable loss
- −$368
- Est. tax savings @ 24.0%
- +$88
- After-tax cash flow
- $3,112/yr
For passive investors: Depreciation is non-cash, so a rental often shows a tax loss while cash-flowing — sheltering income. Rental losses are passive: they offset passive income freely, and up to $25,000/yr can offset ordinary (W-2) income if you actively participate and your MAGI is under $100k (phasing out to $0 by $150k); unused losses carry forward. On sale, claimed depreciation is recaptured at up to 25%, and gains may owe capital-gains tax (a 1031 exchange can defer both). Figures are a year-1 estimate at your 24.0% rate — not tax advice; consult a CPA.
Schools (NCES district)
- District
- Township Hsd 214
- NCES district ID
- 1704170
- Math proficiency
- 42% ▼ -10.00%
- Reading proficiency
- 45% ▼ -4.00%
- Median HH income
- $68,267
- Composite
- 39.13/100
- National rank
- #4035
- State rank
- #103 of 620 in IL
Livability — Buffalo Grove
- Score
- 77/100
- State rank
- #163
- US rank
- #3025
Category grades
Schools grade is shown separately in the Schools card above.
Census & demographics
- Census place
- Buffalo Grove, IL
- County
- Lake County · 591,991 people
- City population
- 42,872
- Metro
- Chicago-Naperville-Elgin, IL-IN-WI
- Population (ZIP)
- 42,872
- Household income
- $129,401
- Rent vs Own
- Severe rent burden
- 478.0
Population outlook (Cook County) Hauer SSP2
- Today (2025)
- 5,347,519 people
- By 2030
- 5,357,703 · +0.2%
- By 2040
- 5,324,924 · -0.4%
- By 2050
- 5,230,762 · -2.2%
- By 2075
- 4,785,735 · -10.5%
- By 2100
- 4,188,836 · -21.7%
Race, ethnicity, and origin ACS 2023
- Neighborhood character
- Diverse neighborhood (Simpson 0.57)
- Race & ethnicity
- White 59% Asian 28% Hispanic / Latino 6% Black 4% Two or more races 4%
- Hispanic origin (detail)
- Mexican 4%
- Common ancestry
- Romanian 7% Scotch-Irish 6% Subsaharan African 4%
- Foreign-born
- 37% · South Korea, Canada, China
- Languages at home
- 54% English-only · Russian/Polish/Slavic 14% Other Indo-European 9% Other Asian/Pacific 7%
Political lean MEDSL · Cook
- 2024 margin
- Solid D (+42.0) · D 70.4% · R 28.4% · Other 1.2%
- 2008→2024 swing
- -11.4pp toward R · 2008: 53.4pp · 2024: 42.0pp
- All cycles
- 2024: D+42.0 2020: D+50.3 2016: D+53.0 2012: D+49.4 2008: D+53.4
Not yet ingested
- Civics
- —
Market trends
- HPI YoY
- ▼ -287.35%
- Current HPI
- 209.9751
- Rent YoY
- ▲ 3.27%
- Metro
- Chicago-Naperville-Elgin, IL-IN-WI
- State GDP YoY
- ▲ 1.59%
- F500 in state
- 60
Industry mix (Fortune 500 HQ in IL)
| Industry | F500 HQs | Revenue |
|---|---|---|
| Insurance | 4 | $201B |
|
||
| Consumer Goods | 4 | $87B |
|
||
| Industrial Machinery | 3 | $64B |
|
||
| Healthcare | 2 | $55B |
|
||
| Retail / Pharmacy | 1 | $148B |
|
||
| Agriculture / Food | 1 | $86B |
|
||
Price history
+359.4% since first listed24 events — show timeline
- 2026-05-21 Pending — MRED as Distributed by MLS Grid
- 2026-05-18 Relisted — MRED as Distributed by MLS Grid
- 2026-05-13 Pending — MRED as Distributed by MLS Grid
- 2026-05-08 Listing Removed — MRED as Distributed by MLS Grid
- 2026-05-08 Listed $215,900 MRED as Distributed by MLS Grid
- 2026-04-28 Listing Removed — MRED as Distributed by MLS Grid
- 2026-04-28 Listed — MRED as Distributed by MLS Grid
- 2026-04-13 Listing Removed — MRED as Distributed by MLS Grid
- 2026-04-13 Listed — MRED as Distributed by MLS Grid
- 2026-04-02 Listing Removed — MRED as Distributed by MLS Grid
- 2026-04-02 Listed — MRED as Distributed by MLS Grid
- 2026-03-12 Listing Removed — MRED as Distributed by MLS Grid
- 2026-03-12 Listed — MRED as Distributed by MLS Grid
- 2026-02-13 Price Changed — MRED as Distributed by MLS Grid
- 2026-02-09 Relisted — MRED as Distributed by MLS Grid
- 2026-01-06 Contingent — MRED as Distributed by MLS Grid
- 2025-12-09 Listing Removed — MRED as Distributed by MLS Grid
- 2025-12-09 Listed — MRED as Distributed by MLS Grid
- 2025-11-25 Listed — MRED as Distributed by MLS Grid
- 2002-02-27 Sold (Public Records) $129,000 Public Records
- 1998-03-06 Sold (Public Records) $78,000 Public Records
- 1993-09-10 Sold (Public Records) $72,000 Public Records
- 1991-05-06 Sold (Public Records) $60,000 Public Records
- 1983-07-12 Sold (Public Records) $47,000 Public Records
Property tax history
+2.9%/yrLatest (2023): $4,367 · +3.9% YoY. Source: county tax records.
Cash-flow waterfall
monthlySold comps — $/sqft
last 12 mo · ≤1 miLoading sold comps…