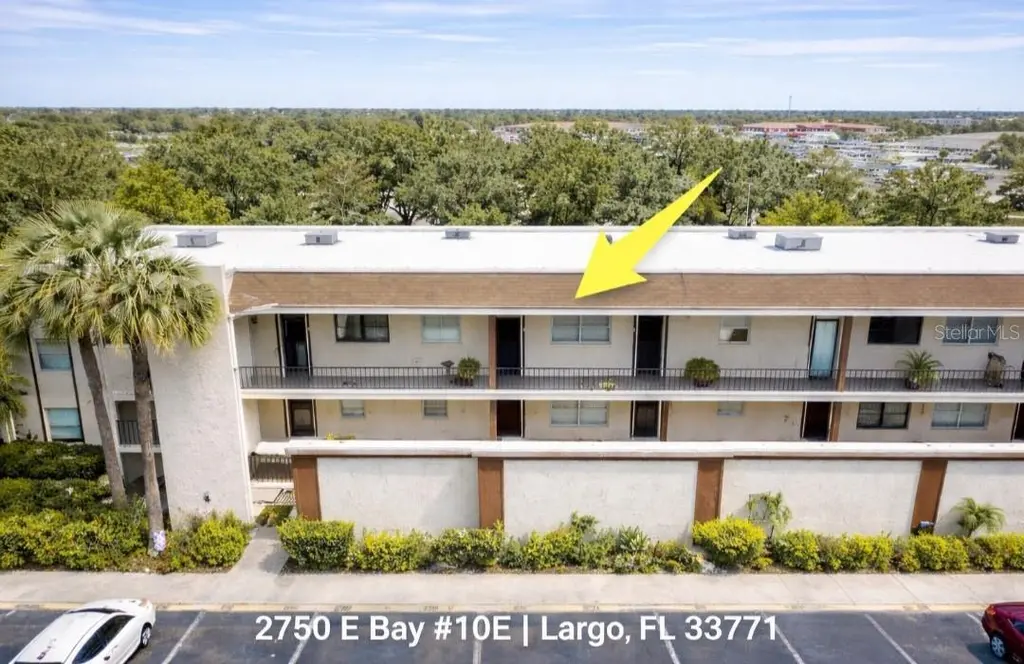
2750 E Bay Dr Unit 10E · Largo, FL
Flood risk 1/10 · Minimal
- FEMA flood zone
- X (unshaded)
- Chance of flooding over 30 yrs
- 0.0%
- Est. flood insurance / yr
- $507 – $1,088
Fire risk 1/10 · Minimal
- Est. fire insurance / yr
- $947 – $1,759
Heat risk 10/10 · Severe
- Hot days now (above 107°F)
- 7 days/yr
- Hot days in 30 yrs
- 26 days/yr
Wind risk 10/10 · Severe
- Chance of severe wind over 30 yrs
- 99.0%
Air-quality risk 3/10 · Minor
- Unhealthy air days now
- 2 days/yr
- Unhealthy air days in 30 yrs
- 3 days/yr
Risk factors via First Street. Map © Google.
Why this score? — see what drove the C- grade
The composite is a weighted blend of 9 inputs, each scored 0–100. Each bar is that input's sub-score; the figure is the points it added to the 100-point composite (weight × sub-score).
- Cash flow +16.2/30.0
- 1% rule +9.2/10.0
- ARV discount +7.5/15.0
- DSCR +5.0/10.0
- Schools +4.3/10.0
- Livability +4.1/5.0
- Condition / age +2.5/5.0
- Rent growth +2.2/5.0
- Appreciation +0.0/10.0
$119,000
🖨 Deal sheet (PDF) 📄 Offer letter ✓ Due diligence
Listing remarks
Move-in ready and fully updated condo located in the desirable Bay Palms Community in Largo. FULLY UPDATED! NO FLOOD ZONE, This remodeled condo offers a bright and open floor plan with a spacious living and dining area, updated flooring, and sliding glass doors that lead to an enclosed balcony overlooking peaceful garden views—perfect for enjoying Florida’s year-round sunshine. The BRAND-NEW KITCHEN features white cabinetry, Stainless Steel Appliances, NEW BACKSPLASH and a functional layout that opens to the main living space, NEW PLUMBING, NEW PAINT, NEW BATHROOM, AC UNIT IS 2019. The primary bedroom is spacious and has 2 closet space, and the bathroom has been tastefully updat
Key facts
- Clubhouse
- Screened balcony
- Private storage unit
Tags
Property features AI
Finance
- Other: Irrigation equipment installed; Storage unit included (storage noted near the unit); Located near golf course and public transit; within city limits; paved public road
- Financial info: Total monthly fees $453; total annual fees $5,436; Lease restrictions apply
- HOA & community: HOA managed by Jim Nobles Management/Richard Drago; Monthly condo fee of $453 (includes cable TV, common area taxes, pool, escrow reserves, insurance, structure and grounds maintenance); Association amenities: clubhouse, pool, laundry, shuffleboard court, recreation facilities, storage, wheelchair access, handicap modified access; Buyer/association approval required; Senior community; no pets allowed; Association recreation (lease) available
Exterior
- Parking: Guest parking available; Open parking; Oversized spaces; Reserved parking
- Utilities: Public water; Public sewer; Broadband/high-speed internet available; Cable connected; Electricity connected
- Home design: Condominium; Residential property; One story; Faces northeast; Second-floor unit
- Construction: Block and concrete construction; Built-up roof; Slab foundation
- Exterior features: Covered, enclosed and screened patios/porches including front, rear and side porch; Patio; Balcony; Outdoor grill; Outdoor shower; Storage; Lighting; Sliding doors; Sidewalk; Mature landscaping with trees
Interior
- Kitchen: Dishwasher; Range; Range hood; Refrigerator
- Bedrooms: 2 bedrooms
- Flooring: Ceramic tile; Laminate
- Bathrooms: 1 full bathroom
- Heating & cooling: Central heating; Central air
- Interior features: Built-in features; Ceiling fans; Living room/dining room combo; Open floorplan; Thermostat; Window treatments; L-shaped dining
- Laundry & utility: Inside laundry room; Washer hookup
Neighborhood map
What this means for you Summary
Snapshot
- This is a 2-bed/1.0-bath condo listed at $119k.
Deal economics
- At list price, monthly cash flow is $62 ($746/yr) — positive.
- The deal already cash-flows at list — no discount required.
- Meets the 1% rule at list price ($2k rent vs $119k).
- Recommended offer: $112k (6.0% below list) — sets the bar for market timing.
- Cap rate 6.9% vs local median 4.3% in Largo — top-decile yield for the area; either an underpriced asset or a hidden risk that comps aren't pricing in. Stress-test before assuming the spread holds.
Location & tenants
- Location reads 82/100 on livability (#82 in FL, #1,240 nationally) — a professional / high-income tenant draw. Strengths: commute A+, cost of living A+, housing A+; Watch: employment D+, amenities F.
- Pinellas (suburban): math 51% / reading 51% proficiency, ranked #31 of 73 in FL (top 42%) — acceptable for families but not a draw, mixed tenant base, ~2y average lease.
- Zoned schools: Belleair Elementary School (math 54% / reading 45%, grade D, #1,088 of 2,144 statewide, top 53%, 472 students, 81% FRL); Largo Middle School (math 38% / reading 35%, grade F, #405 of 571 statewide, top 72%, 882 students, 66% FRL); Largo High School (math 30% / reading 50%, grade F, #296 of 667 statewide, top 45%, 2,055 students, 53% FRL) — zoned schools average 67% FRL vs 48% district-wide (19 pts higher); higher-poverty schools than district average — tighter screening recommended.
- Market conditions: Rents soft (-1.1%/yr); 225 active listings in the ZIP; 39 comparable units currently listed for rent nearby; rentals leasing fast (median 12d on market — plan ~1-2 weeks tenant-placement turnaround); 2,676 units permitted in Pinellas County in 2024 (1,422 in 5+ unit buildings).
- This rent runs 34% of the median local income ($60k/yr) — at the standard rent-burdened threshold; future hikes will face affordability resistance.
Forward outlook
- Local home prices are declining (-3.0%/yr); year-one equity from $823 of loan paydown is wiped out by about $4k of value loss. Plan a longer hold.
- Pinellas County population projected at +14% by 2050 — modest demand growth; plan on rents tracking national, not racing it.
Negotiation context
- It's been on market 81 days — a 6% lower offer ($112k) is reasonable based on typical stale-listing flexibility.
- 12 sale attempts since 22y ago; this cycle's ask has dropped $7k (5%) from the opening price — seller is motivated, your offer sets the floor, not the list.
- Current owner paid $60k; list at $119k implies a 98% gain — meaningful room to come down on a strong offer.
Risks & watch-outs
- Watch-outs: HOA is 27% of rent.
- Climate carrying-cost: severe wind risk, 99% chance of damaging wind over 30y; extreme-heat days projected 7→26/yr by 2055 (HVAC capex compounding) — expect insurance premiums to compound above CPI over the hold.
Questions for the listing agent
- It's been on market 81 days. Have you received any prior offers? Is the seller open to a 6% concession, seller financing, or rate buy-down credit?
- Built in 1972 — when were the roof, HVAC, electrical panel, plumbing, and water heater last replaced?
- What does the HOA fee cover, when was the last increase, and are there any pending special assessments or reserve-fund shortfalls?
- Any open or pending special assessments — roof, HVAC, plumbing, elevator, façade? What's the per-unit balance and payoff schedule, and is the seller paying it off at close or rolling it to the buyer?
- Why hasn't it sold? Are there any deal-killer items the seller is aware of (foundation, flood, title, zoning, code violations)?
- Is there a deadline driving the sale (1031 exchange, divorce, estate, relocation)? That informs how much negotiation room exists.
- What's the average days-on-market for RENTAL listings here right now (not sales)? A rising rental-DOM trend means longer vacancies and softer asking-rent achievability than the comps imply.
- What's the recent tenant-quality profile in this submarket — average credit score on applications, eviction rate, late-payment / NSF rate, and stable-employment percentage? A property-management company in the area should have these aggregated.
- How much new apartment / multifamily construction is in the pipeline within 1–3 miles? Heavy new supply (>2% of stock underway) typically softens rents 12–24 months out; light construction supports rent growth.
Investment metrics
- 1% rule
- 1.42% ✓
- Cap rate
- 6.92%
- Cash-on-cash
- 2.24%
- DSCR
- 1.10
- GRM
- 5.9
CMA / ARV
No comps found within radius.
Projected returns pro-forma
-3.0% appreciation · 0.0% rent growth · sell at horizon
- IRR
- -17.7%
- Equity multiple
- 0.40×
- Total profit
- $-19,974
- Equity at exit
- $17,743
- IRR
- -22.7%
- Equity multiple
- 0.09×
- Total profit
- $-30,209
- Equity at exit
- $10,289
Cash invested: $33,320 (down + closing). Projections, not guarantees.
Landlord ↔ Tenant lean methodology
- Overall (STATE)
- 87 Strongly Landlord-Friendly
- State Florida
- 87 Strongly Landlord-Friendly · R+3
- County
- — inherits STATE
- City
- — inherits STATE
ZIP-level market 33771
- Home prices YoY
- -30.2%
- Rents YoY
- -1.1%
- Active inventory
- 225
- Price-to-rent
- 5.9×
Monthly cashflow live
- Estimated rent
- $1,690 high interval (Pro) →
- Mortgage (P&I)
- −$624
- Tax from tax record
- −$147 /mo · $1,758/yr
- Insurance
- −$50
- HOA
- −$453
- Vacancy / Maint / Mgmt
- −$355
- Net cashflow
- $62
Break-even live
Sensitivity live
| Price | -10% $130 | -5% $96 | +0% $62 | +5% $28 | +10% $-5 |
|---|---|---|---|---|---|
| Rent | -10% $-71 | -5% $-5 | +0% $62 | +5% $129 | +10% $196 |
| Rate | -1.0pp $122 | -0.5pp $92 | base $62 | +0.5pp $31 | +1.0pp $0 |
UW: 25.0% down · 7.5% · 30yr · 1.5% tax · 5.0% vac · 8.0% maint · 8.0% mgmt
Financing live
Cash to close
- Down payment
- $29,750
- Closing costs
- $3,570
- Reserves months
- —
- Total cash needed
- —
Loan-product check · same deal, 3 products live
Conventional
25% down · 7.5% · 30yr
- Down + closing
- —
- Monthly P&I
- —
- Monthly cashflow
- —
- DSCR
- —
- Eligible?
- —
Personal DTI + credit; lowest rate.
DSCR
20% down · 8.5% · 30yr
- Down + closing
- —
- Monthly P&I
- —
- Monthly cashflow
- —
- DSCR
- —
- Eligible?
- —
No personal income docs; deal must DSCR.
Hard money
10% down · 12.0% · 12mo
- Down + closing
- —
- Monthly P&I
- —
- Monthly cashflow
- —
- DSCR
- —
- Eligible?
- —
Short-term bridge; refi at stabilization.
Rent comps 39 comps
| Address | Beds | Baths | Sqft | Rent | $/sqft | DOM | Units | Dist |
|---|---|---|---|---|---|---|---|---|
| 2505 E Bay Dr Lot 77 Largo, FL | 2.0 | 1.5 | 1080 | $1,395 | $1.29 | 22d | 1 | 0.23mi |
| 3022 Meadow Lake Ave Largo, FL | 2.0 | 1.0 | 900 | $1,450 | $1.61 | 6d | 1 | 0.27mi |
| 3022 Meadow Lake Ave Largo, FL | 2.0 | 1.0 | 900 | $1,450 | $1.61 | 12d | 1 | 0.27mi |
| 2291 E Bay Dr Largo, FL | 2.0 | 2.0 | 708 | $1,600 | $2.26 | 23d | 1 | 0.31mi |
| 2291 E Bay Dr Largo, FL | 2.0 | 2.0 | 708 | $1,600 | $2.26 | 22d | 1 | 0.31mi |
| 199 Fulton St NE Unit 4 Largo, FL | 2.0 | 1.0 | 760 | $1,600 | $2.11 | 15d | 1 | 0.32mi |
| 600 Starkey Rd Largo, FL | 1.0–3.0 | 1.0–2.0 | 982 | $1,774 | $1.81 | 4d | 21 | 0.36mi |
| 3073 Pine Tree Ave Largo, FL | 2.0 | 1.0 | 825 | $1,350 | $1.64 | 25d | 1 | 0.40mi |
| 3377 Sherwood Dr Unit A Largo, FL | 2.0 | 1.0 | 1064 | $1,650 | $1.55 | 9d | 1 | 0.41mi |
| 3135 Pine Tree Ave Unit A Largo, FL | 2.0 | 1.0 | 923 | $1,395 | $1.51 | 23d | 1 | 0.42mi |
| 3135 Pine Tree Ave Largo, FL | 2.0 | 1.0 | 923 | $1,395 | $1.51 | 12d | 1 | 0.42mi |
| 636 Lake Palms Dr Unit Stylish Largo, FL | 2.0 | 2.0 | 870 | $2,000 | $2.30 | 6d | 1 | 0.45mi |
| 636 Lake Palms Dr Unit Stylish Largo, FL | 3.0 | 2.0 | 1000 | $2,200 | $2.20 | 25d | 1 | 0.45mi |
| 2045 E Bay Dr Largo, FL | 1.0–2.0 | 1.0–2.0 | 1114 | $1,830 | $1.64 | 3d | 15 | 0.46mi |
| 101 Imperial Palm Dr Largo, FL | 1.0–2.0 | 1.0–2.0 | 907 | $1,810 | $1.99 | 3d | 35 | 0.51mi |
| 301 Seacrest Dr Largo, FL | 1.0–2.0 | 1.0–1.5 | 975 | $1,625 | $1.67 | 23d | 1 | 0.51mi |
| 779 34th St SE Unit 1319966P Largo, FL | 2.0 | 1.0 | 990 | $2,941 | $2.97 | 9d | 1 | 0.67mi |
| 500 Belcher Rd S #18 Largo, FL | 1.0 | 1.0 | 637 | $1,500 | $2.35 | 4d | 1 | 0.73mi |
| 221 Lake Ave NE Largo, FL | 1.0–2.0 | 1.0–2.0 | 1095 | $2,160 | $1.97 | 4d | 11 | 0.77mi |
| 4215 E Bay Dr Clearwater, FL | 1.0 | 1.0 | 575 | $1,775 | $3.09 | 19d | 3 | 0.98mi |
| 4215 E Bay Dr Clearwater, FL | 1.0 | 1.0 | 535 | $2,300 | $4.30 | 9d | 4 | 0.98mi |
| 2871 S Pines Dr #24 Largo, FL | 2.0 | 1.5 | 1048 | $1,800 | $1.72 | 25d | 1 | 1.01mi |
| 4500 E Bay Dr #149 Clearwater, FL | 2.0 | 2.0 | 1050 | $1,850 | $1.76 | 25d | 1 | 1.10mi |
| 4500 E Bay Dr #138 Clearwater, FL | 2.0 | 2.0 | 1050 | $1,350 | $1.29 | 25d | 1 | 1.10mi |
| 1100 East Bay Dr #104 Largo, FL | 2.0 | 2.0 | 840 | $1,950 | $2.32 | 5d | 1 | 1.10mi |
| 3331 Whispering Dr N Largo, FL | 2.0 | 2.0 | 1053 | $2,190 | $2.08 | 25d | 1 | 1.14mi |
| 1601 Palm Way Largo, FL | 3.0 | 1.0 | 1084 | $1,950 | $1.80 | 25d | 1 | 1.18mi |
| 3736 141st Pl Largo, FL | 2.0 | 1.0 | 805 | $1,650 | $2.05 | 25d | 1 | 1.28mi |
| 1845 S Highland Ave Clearwater, FL | 2.0 | 2.0 | 904 | $1,525 | $1.69 | 4d | 2 | 1.30mi |
| 705 3rd Ave NE Unit C Largo, FL | 3.0 | 2.0 | 1113 | $2,195 | $1.97 | 5d | 1 | 1.30mi |
| 1517 16th Cir SE Largo, FL | 1.0 | 1.0 | 625 | $1,250 | $2.00 | 5d | 1 | 1.35mi |
| 705 Redbud LN Largo, FL | 1.0–2.0 | 1.0–2.0 | 986 | $2,615 | $2.65 | 3d | 189 | 1.38mi |
| 1653 Bravo Dr Clearwater, FL | 1.0 | 1.0 | 850 | $2,200 | $2.59 | 6d | 1 | 1.41mi |
| 516 5th Ave NE Largo, FL | 3.0 | 2.0 | 1073 | $2,250 | $2.10 | 16d | 1 | 1.43mi |
| 516 5th Ave NE Largo, FL | 3.0 | 2.0 | 1057 | $2,250 | $2.13 | 25d | 1 | 1.43mi |
| 601 Rosery Rd NE Largo, FL | 1.0–3.0 | 1.0–2.5 | 1192 | $1,830 | $1.54 | 3d | 38 | 1.45mi |
| 3767 138th Ave N Unit B Largo, FL | 2.0 | 1.0 | 780 | $1,495 | $1.92 | 3d | 1 | 1.45mi |
| 447 6th Ave NE Unit B Largo, FL | 2.0 | 1.0 | 840 | $1,650 | $1.96 | 12d | 1 | 1.45mi |
| 3718 138th Ave N Unit 2 Largo, FL | 2.0 | 1.0 | 750 | $1,500 | $2.00 | 25d | 1 | 1.46mi |
HOA detail condo
- Monthly dues
- $453 · $5,436/yr
- Assessments
- None detected in remarks — confirm with the listing agent.
Listing history 50 events
-
2026-06-22days on market $119,000 Active 81 DOM
-
2026-06-18days on market $119,000 Active 78 DOM
-
2026-06-17days on market $119,000 Active 77 DOM
-
2026-06-16days on market $119,000 Active 76 DOM
-
2026-06-15days on market $119,000 Active 75 DOM
-
2026-06-13days on market $119,000 Active 73 DOM
-
2026-06-09days on market $119,000 Active 69 DOM
-
2026-06-08days on market $119,000 Active 68 DOM
-
2026-06-07days on market $119,000 Active 67 DOM
-
2026-06-04days on market $119,000 Active 64 DOM
-
2026-06-03days on market $119,000 Active 63 DOM
-
2026-06-01days on market $119,000 Active 61 DOM
-
2026-05-31days on market $119,000 Active 60 DOM
-
2026-05-12price $121,000
-
2026-04-19price $124,000
-
2026-04-01$125,900 Active
-
2024-11-29historical
-
2024-09-17price $139,000
-
2024-08-30price $146,995
-
2024-03-20historical
-
2024-03-19$149,000 Active
-
2024-01-16price $149,000
-
2023-11-14price $156,000
-
2023-09-13$173,000 Active
-
2023-08-17historical
-
2023-08-17historical
-
2023-08-07price $149,900
-
2023-08-02status Active
-
2023-08-01historical
-
2023-07-09status Active
-
2023-07-03historical
-
2023-05-19price $159,900
-
2023-03-10price $165,000
-
2023-02-02$180,000 Active
-
2020-02-17historical
-
2020-01-06$89,000 Active
-
2019-03-22soldstatus $60,000 Sold
-
2019-03-22soldstatus $60,000
-
2019-02-27status Pending
-
2019-02-07$65,000 Active
-
2019-01-31historical
-
2018-08-21$65,900 Active
-
2016-10-26soldstatus $40,000
-
2016-10-25soldstatus $40,000 Sold
-
2016-10-05status Pending
-
2016-09-02$42,500 Active
-
2010-05-04soldstatus $25,000
-
2009-10-05soldstatus $25,000
-
2008-10-13historical
-
2008-05-09$49,000
ⓘ Source: listings_history table (triggers on properties + properties_extension) + one-shot
backfill from property_details.listing_events for pre-trigger history.
Tax reassessment forecast FL · Resets to sale price
- Current annual tax
- $1,758 · $147/mo
- Projected year-2 tax
- $1,758 · $147/mo
- Expected delta
- $0/yr ($0/mo · 0.0%)
ⓘ Screening estimate from a state-policy table — verify with the county assessor before closing.
Climate risk First Street
- Flood 1/10 Low FEMA zone X (unshaded) · 0% chance over 30 yrs
- Wildfire 1/10 Low
- Heat 10/10 Extreme 7 d/yr ≥107°F today · 26 d/yr by 30 yrs out
- Wind 10/10 Extreme 99% chance of damaging wind over 30 yrs
- Air quality 3/10 Moderate 2 unhealthy d/yr today · 3 by 30 yrs out
Nearby sold comps map
Loading sold comps map…
Walkable amenities ~0.75 mi
Loading nearby amenities…
Taxation est. · year 1
- Rental income
- $20,284
- − Mortgage interest
- −$6,666
- − Property taxes
- −$1,758
- − Insurance
- −$595
- − Repairs & maintenance
- −$1,623
- − Management
- −$1,623
- − HOA
- −$5,436
- − Depreciation
- −$3,462
- Taxable loss
- −$879
- Est. tax savings @ 24.0%
- +$211
- After-tax cash flow
- $957/yr
For passive investors: Depreciation is non-cash, so a rental often shows a tax loss while cash-flowing — sheltering income. Rental losses are passive: they offset passive income freely, and up to $25,000/yr can offset ordinary (W-2) income if you actively participate and your MAGI is under $100k (phasing out to $0 by $150k); unused losses carry forward. On sale, claimed depreciation is recaptured at up to 25%, and gains may owe capital-gains tax (a 1031 exchange can defer both). Figures are a year-1 estimate at your 24.0% rate — not tax advice; consult a CPA.
Schools (NCES district)
- District
- Pinellas
- NCES district ID
- 1201560
- Math proficiency
- 51% ▼ -5.00%
- Reading proficiency
- 51% ▼ -3.00%
- Median HH income
- $46,270
- Composite
- 43.27/100
- National rank
- #3046
- State rank
- #31 of 73 in FL
Livability — Largo
- Score
- 82/100
- State rank
- #82
- US rank
- #1240
Category grades
Schools grade is shown separately in the Schools card above.
Census & demographics
- Census place
- Largo, FL
- County
- Pinellas County · 939,478 people
- City population
- 106,311
- Metro
- Tampa-St. Petersburg-Clearwater, FL
- Population (ZIP)
- 27,596
- Household income
- $59,993
- Rent vs Own
- Severe rent burden
- 1243.0
Population outlook (Pinellas County) Hauer SSP2
- Today (2025)
- 1,027,532 people
- By 2030
- 1,063,586 · +3.5%
- By 2040
- 1,125,020 · +9.5%
- By 2050
- 1,168,637 · +13.7%
- By 2075
- 1,265,188 · +23.1%
- By 2100
- 1,260,357 · +22.7%
Race, ethnicity, and origin ACS 2023
- Neighborhood character
- Predominantly White (74%)
- Race & ethnicity
- White 74% Hispanic / Latino 14% Two or more races 9% Black 4% Asian 3%
- Hispanic origin (detail)
- Mexican 3% Puerto Rican 6% Dominican 2%
- Common ancestry
- Romanian 4% Lithuanian 3% Slovak 2%
- Foreign-born
- 13% · Canada, Jamaica, Guatemala
- Languages at home
- 82% English-only · Spanish 12% Other Indo-European 2% Russian/Polish/Slavic 2%
Political lean MEDSL · Pinellas
- 2024 margin
- Lean R (+5.2) · D 46.9% · R 52.1%
- 2008→2024 swing
- -13.5pp toward R · 2008: 8.3pp · 2024: -5.2pp
- All cycles
- 2024: R+5.2 2020: D+0.2 2016: R+1.1 2012: D+5.6 2008: D+8.3
Not yet ingested
- Civics
- —
Market trends
- HPI YoY
- ▼ -135.36%
- Current HPI
- 313.5044
- Rent YoY
- ▼ -1.06%
- Metro
- Tampa-St. Petersburg-Clearwater, FL
- State GDP YoY
- ▲ 3.28%
- F500 in state
- 36
Industry mix (Fortune 500 HQ in FL)
| Industry | F500 HQs | Revenue |
|---|---|---|
| Industrial Technology | 2 | $29B |
|
||
| Insurance | 2 | $17B |
|
||
| Retail | 1 | $60B |
|
||
| Technology Distribution | 1 | $58B |
|
||
| Homebuilding | 1 | $35B |
|
||
| Technology Manufacturing | 1 | $35B |
|
||
Price history
+120.4% since first listed40 events — show timeline
- 2026-05-12 Price Changed $121,000 Stellar MLS as Distributed by MLS Grid
- 2026-04-19 Price Changed $124,000 Stellar MLS as Distributed by MLS Grid
- 2026-04-01 Listed $125,900 Stellar MLS as Distributed by MLS Grid
- 2024-11-29 Listing Removed — Stellar MLS as Distributed by MLS Grid
- 2024-09-17 Price Changed $139,000 Stellar MLS as Distributed by MLS Grid
- 2024-08-30 Price Changed $146,995 Stellar MLS as Distributed by MLS Grid
- 2024-03-20 Listing Removed — Stellar MLS as Distributed by MLS Grid
- 2024-03-19 Listed $149,000 Stellar MLS as Distributed by MLS Grid
- 2024-01-16 Price Changed $149,000 Stellar MLS as Distributed by MLS Grid
- 2023-11-14 Price Changed $156,000 Stellar MLS as Distributed by MLS Grid
- 2023-09-13 Listed $173,000 Stellar MLS as Distributed by MLS Grid
- 2023-08-17 Rental Removed — STELLARMLS
- 2023-08-17 Listing Removed — Stellar MLS as Distributed by MLS Grid
- 2023-08-07 Price Changed $149,900 Stellar MLS as Distributed by MLS Grid
- 2023-08-02 Relisted — Stellar MLS as Distributed by MLS Grid
- 2023-08-01 Listing Removed — Stellar MLS as Distributed by MLS Grid
- 2023-07-09 Relisted — Stellar MLS as Distributed by MLS Grid
- 2023-07-03 Listing Removed — Stellar MLS as Distributed by MLS Grid
- 2023-05-19 Price Changed $159,900 Stellar MLS as Distributed by MLS Grid
- 2023-03-10 Price Changed $165,000 Stellar MLS as Distributed by MLS Grid
- 2023-02-02 Listed $180,000 Stellar MLS as Distributed by MLS Grid
- 2020-02-17 Listing Removed — Stellar MLS as Distributed by MLS Grid
- 2020-01-06 Listed $89,000 Stellar MLS as Distributed by MLS Grid
- 2019-03-22 Sold (Public Records) $60,000 Public Records
- 2019-03-22 Sold (MLS) $60,000 Stellar MLS as Distributed by MLS Grid
- 2019-02-27 Pending — Stellar MLS as Distributed by MLS Grid
- 2019-02-07 Listed $65,000 Stellar MLS as Distributed by MLS Grid
- 2019-01-31 Listing Removed — Stellar MLS as Distributed by MLS Grid
- 2018-08-21 Listed $65,900 Stellar MLS as Distributed by MLS Grid
- 2016-10-26 Sold (Public Records) $40,000 Public Records
- 2016-10-25 Sold (MLS) $40,000 Stellar MLS as Distributed by MLS Grid
- 2016-10-05 Pending — Stellar MLS as Distributed by MLS Grid
- 2016-09-02 Listed $42,500 Stellar MLS as Distributed by MLS Grid
- 2010-05-04 Sold (Public Records) $25,000 Public Records
- 2009-10-05 Sold (Public Records) $25,000 Public Records
- 2008-10-13 Listing Removed — Stellar MLS as Distributed by MLS Grid
- 2008-05-09 Listed $49,000 Stellar MLS as Distributed by MLS Grid
- 2005-03-18 Sold (Public Records) $50,000 Public Records
- 2005-02-28 Sold (MLS) $50,000 Stellar MLS as Distributed by MLS Grid
- 2004-12-11 Listed $54,900 Stellar MLS as Distributed by MLS Grid
Property tax history
+11.4%/yrLatest (2025): $1,758 · +7.4% YoY. Source: county tax records.
Cash-flow waterfall
monthlySold comps — $/sqft
last 12 mo · ≤1 miLoading sold comps…