 Duplex
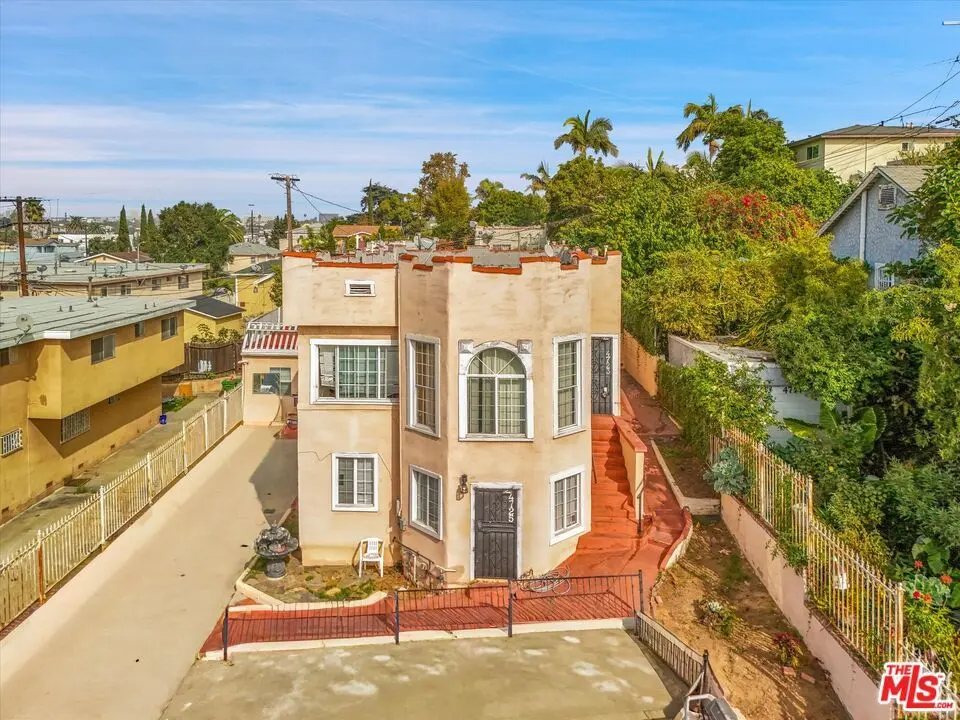
4725 St Elmo Dr · Los Angeles, CA
Flood risk 1/10 · Minimal
- FEMA flood zone
- X (unshaded)
- Chance of flooding over 30 yrs
- 0.0%
- Est. flood insurance / yr
- $507 – $1,088
Fire risk 1/10 · Minimal
- Est. fire insurance / yr
- $659 – $1,223
Heat risk 6/10 · Moderate
- Hot days now (above 89°F)
- 7 days/yr
- Hot days in 30 yrs
- 21 days/yr
Wind risk 1/10 · Minimal
- Chance of severe wind over 30 yrs
- —
Air-quality risk 5/10 · Moderate
- Unhealthy air days now
- 7 days/yr
- Unhealthy air days in 30 yrs
- 7 days/yr
Risk factors via First Street. Map © Google.
Why this score? — see what drove the C grade
The composite is a weighted blend of 9 inputs, each scored 0–100. Each bar is that input's sub-score; the figure is the points it added to the 100-point composite (weight × sub-score).
- Cash flow +18.7/30.0
- ARV discount +15.0/15.0
- DSCR +5.9/10.0
- 1% rule +4.5/10.0
- Schools +3.6/10.0
- Livability +3.4/5.0
- Condition / age +2.5/5.0
- Rent growth +2.4/5.0
- Appreciation +0.0/10.0
$777,773
🖨 Deal sheet 📄 Offer letter ✓ Due diligence
Multi-family units
County records classify this as Multi-Family (2-4 Unit). Listing-text estimate: 2 units. confirmed
Listing remarks MLS
This property is now under auction terms. Auction ends Monday 5/4. All Bids must be submitted during the auction period via the property's listing page. This sale is subject to a 5% buyer's premium pursuant to the auction Terms & Conditions. All bids will be subject to seller approval (minimums may apply). Attention all ambitious investors! Prime investment opportunity. Occupied Duplex situated in the Mid-Los Angeles neighborhood. The central location ensures easy access to major highways, public transportation and cultural attractions such as the Los Angeles County Museum of Art (LACMA). The property is sold as-is, fully occupied and sight-unseen with no interior access. Exact occupancy unknown. Drive by only. Do not disturb. Cash only. Buyer to sign an"Occupied Property Addendum" with contract. Interior condition and exact bedroom/bathroom count unknown. Tax records indicate 6BR/3BA, previous MLS history indicates 7BR/5BA. Previous MLS states "detached storage unit" (converted garage, permits unknown). Property has violations from the City of Los Angeles. Buyers to exercise due diligence and rely on own findings.
Key facts
- 6,427 sq ft lot
- 5 parking spots
- Built 1915
Neighborhood map
What this means for you Summary
Snapshot
- This is a 2 × 3-bed/1.5-bath units multifamily listed at $778k.
Deal economics
- At list price, monthly cash flow is $766 ($9k/yr) — positive. Per door: $383/mo.
- The deal already cash-flows at list — no discount required.
- To meet the 1% rule (rent ≥ 1% of price), the offer needs to be $740k (4.9% below list).
- Recommended offer: $684k (12.0% below list) — sets the bar for market timing.
- Cap rate 7.5% vs local median 2.1% in Los Angeles — top-decile yield for the area; either an underpriced asset or a hidden risk that comps aren't pricing in. Stress-test before assuming the spread holds.
Location & tenants
- Location reads 68/100 on livability (#273 in CA) — a middle-class / working-renter tenant base. Strengths: amenities A+, commute A+, employment B; Watch: health & safety C-, schools D+, crime F.
- Los Angeles Unified (urban): math 29% / reading 54% proficiency, ranked #223 of 517 in CA (top 43%) — families likely to look elsewhere, expect single-tenant / working-renter base with shorter leases; 67% free/reduced lunch — lower-income household profile, screen leases tightly.
- Market conditions: Rents soft (-0.5%/yr); 204 active listings in the ZIP; 12 comparable units currently listed for rent nearby; rentals lingering (median 44d on market — plan ~5-8 weeks vacancy on turnover, expect pricing pressure); 75% of comp listings sitting > 30 days — soft ceiling on asking rent; 19,697 units permitted in Los Angeles County in 2024 (9,426 in 5+ unit buildings).
- At $7,399/mo this rent would consume 120% of the median local household income ($74k/yr) (locally 5272% of renters already pay >50% of income on rent) — very limited rent-growth headroom before tenants either downsize or default.
Forward outlook
- Local home prices are declining (-3.0%/yr); year-one equity from $5k of loan paydown is wiped out by about $23k of value loss. Plan a longer hold.
- Los Angeles County population projected at +9% by 2050 — modest demand growth; plan on rents tracking national, not racing it.
Negotiation context
- It's been on market 226 days — a 12% lower offer ($684k) is reasonable based on typical stale-listing flexibility.
- 9 sale attempts since 24y ago; this cycle's ask has dropped $212k (21%) from the opening price — seller is motivated, your offer sets the floor, not the list.
- Current owner paid $515k; list at $778k implies a 51% gain — meaningful room to come down on a strong offer.
Risks & watch-outs
- Watch-outs: built in 1915 — expect roof / HVAC / electrical / plumbing capex.
- Climate carrying-cost: extreme-heat days projected 7→21/yr by 2055 (HVAC capex compounding) — expect insurance premiums to compound above CPI over the hold.
Questions for the listing agent
- It's been on market 226 days. Have you received any prior offers? Is the seller open to a 12% concession, seller financing, or rate buy-down credit?
- Can we see the unit-by-unit rent roll, current vacancy, and any below-market leases? What's the average tenancy length?
- What capital expenditures (roof, boiler, parking lot, exteriors) have been made in the last 5 years, and what's planned in the next 2?
- Built in 1915 — when were the roof, HVAC, electrical panel, plumbing, and water heater last replaced?
- Why hasn't it sold? Are there any deal-killer items the seller is aware of (foundation, flood, title, zoning, code violations)?
- Is there a deadline driving the sale (1031 exchange, divorce, estate, relocation)? That informs how much negotiation room exists.
- Schools are D-rated, which usually means shorter tenancies and higher turnover. Who's the typical renter profile here, and what's been the actual vacancy rate?
- Crime grade is F in this area — have there been break-ins, vandalism, or insurance claims at this property in the last 3 years? What carrier currently insures it and at what premium?
- What's the average days-on-market for RENTAL listings here right now (not sales)? A rising rental-DOM trend means longer vacancies and softer asking-rent achievability than the comps imply.
- What's the recent tenant-quality profile in this submarket — average credit score on applications, eviction rate, late-payment / NSF rate, and stable-employment percentage? A property-management company in the area should have these aggregated.
- How much new apartment / multifamily construction is in the pipeline within 1–3 miles? Heavy new supply (>2% of stock underway) typically softens rents 12–24 months out; light construction supports rent growth.
Investment metrics
- 1% rule
- 0.95% ✗
- Cap rate
- 7.47%
- Cash-on-cash
- 4.22%
- DSCR
- 1.19
- GRM
- 8.8
CMA / ARV
- ARV (median comp)
- $1,304,920
- List price
- $777,773
- Delta
- -40.40%
- Verdict
- UNDERPRICED
- Comps
- 20 within 1.0 mi
Show comp detail 10 sales within ~0.75 mi
| Address | Dist | Beds/Ba | Sqft | Sold | Price | $/sf | Match |
|---|---|---|---|---|---|---|---|
| 1920 S Rimpau Blvd | 0.32mi | 5/3.0 (-1) | 2,832 (+2%) | 1mo | $827,000 | $292 | 75 |
| 4711 St Elmo Dr | 0.02mi | 6/6.0 | 2,903 (+5%) | 11mo | $1,600,000 | $551 | 69 |
| 4521 Saturn St | 0.24mi | 5/4.0 (-1) | 2,621 (-5%) | 6mo | $1,450,000 | $553 | 66 |
| 4431 Victoria Park Pl | 0.59mi | 5/3.0 (-1) | 2,708 (-2%) | 5mo | $1,684,900 | $622 | 60 |
| 1280 S Redondo Blvd | 0.63mi | 6/5.0 | 2,601 (-6%) | 0mo | $1,650,000 | $634 | 52 |
| 1360 S Mansfield Ave | 0.44mi | 5/3.0 (-1) | 2,560 (-7%) | 13mo | $1,327,000 | $518 | 52 |
| 1272 Queen Anne Pl | 0.66mi | 5/3.0 (-1) | 2,798 (+1%) | 13mo | $735,000 | $263 | 51 |
| 1812 S Longwood Ave | 0.19mi | 6/4.0 | 2,480 (-10%) | 23mo | $1,350,000 | $544 | 51 |
| 1365 S Keniston Ave | 0.44mi | 6/4.0 | 3,096 (+12%) | 22mo | $1,460,000 | $472 | 37 |
| 1337 S Cloverdale Ave | 0.73mi | 6/2.0 | 3,118 (+13%) | 6mo | $1,640,000 | $526 | 36 |
Match score weights: distance 35% · size 25% · config 20% · recency 20%. Top-matched comps best support the ARV.
Projected returns pro-forma
-3.0% appreciation · 0.0% rent growth · sell at horizon
- IRR
- -13.0%
- Equity multiple
- 0.55×
- Total profit
- $-98,992
- Equity at exit
- $115,968
- IRR
- -9.2%
- Equity multiple
- 0.51×
- Total profit
- $-107,454
- Equity at exit
- $67,248
Cash invested: $217,776 (down + closing). Projections, not guarantees.
Landlord ↔ Tenant lean methodology
- Overall (CITY)
- 0 Strongly Tenant-Friendly
- State California
- 18 Strongly Tenant-Friendly · D+13
- County
- — inherits STATE
- City Los Angeles
- 0 Strongly Tenant-Friendly · D+22
ZIP-level market 90019
- Rents YoY
- -0.5%
- Active inventory
- 204
- Price-to-rent
- 17.5×
Monthly cashflow live
- Estimated rent
- $7,399 high interval (Pro) →
- Mortgage (P&I)
- −$4,079
- Tax from tax record
- −$676 /mo · $8,116/yr
- Insurance
- −$324
- HOA
- −$0
- Vacancy / Maint / Mgmt
- −$1,554
- Net cashflow
- $766
Break-even live
2-unit breakdown (identical units grouped — click to expand)
| Units | Beds | Baths | Est. rent |
|---|---|---|---|
| 2× units | 3 | 1.5 | $7,398 |
| #1 | 3 | 1.5 | $3,699 |
| #2 | 3 | 1.5 | $3,699 |
| Total (2 units) | $7,399 | ||
UW: 25.0% down · 7.5% · 30yr · 1.5% tax · 5.0% vac · 8.0% maint · 8.0% mgmt
Financing live
Cash to close
- Down payment
- $194,443
- Closing costs
- $23,333
- Reserves months
- —
- Total cash needed
- —
Loan-product check · same deal, 3 products live
Conventional
25% down · 7.5% · 30yr
- Down + closing
- —
- Monthly P&I
- —
- Monthly cashflow
- —
- DSCR
- —
- Eligible?
- —
Personal DTI + credit; lowest rate.
DSCR
20% down · 8.5% · 30yr
- Down + closing
- —
- Monthly P&I
- —
- Monthly cashflow
- —
- DSCR
- —
- Eligible?
- —
No personal income docs; deal must DSCR.
Hard money
10% down · 12.0% · 12mo
- Down + closing
- —
- Monthly P&I
- —
- Monthly cashflow
- —
- DSCR
- —
- Eligible?
- —
Short-term bridge; refi at stabilization.
Rent comps 12 comps
| Address | Beds | Baths | Sqft | Rent | $/sqft | DOM | Units | Dist |
|---|---|---|---|---|---|---|---|---|
| 1805 S Longwood Ave Los Angeles, CA | 5.0 | 3.5 | 2000 | $5,395 | $2.70 | 5d | 1 | 0.21mi |
| 2125 S West View St Los Angeles, CA | 6.0 | 5.0 | 2546 | $5,500 | $2.16 | 44d | 1 | 0.51mi |
| 2133 S Longwood Ave Los Angeles, CA | 5.0 | 4.0 | 2376 | $5,499 | $2.31 | 44d | 1 | 0.53mi |
| 2150 S West View St Los Angeles, CA | 5.0 | 5.0 | 2439 | $6,400 | $2.62 | 20d | 1 | 0.55mi |
| 5024 W 20th St Los Angeles, CA | 5.0 | 2.0 | 1996 | $5,250 | $2.63 | 44d | 1 | 0.56mi |
| 1620 S Victoria Ave Los Angeles, CA | 5.0 | 5.0 | 4038 | $7,850 | $1.94 | 44d | 1 | 0.66mi |
| 2012 S Dunsmuir Ave Unit A Los Angeles, CA | 5.0 | 5.5 | 2266 | $5,312 | $2.34 | 44d | 1 | 0.90mi |
| 2521 S Orange Dr Los Angeles, CA | 5.0 | 5.5 | 2397 | $6,450 | $2.69 | 44d | 1 | 0.95mi |
| 2657 1/2 S Longwood Ave Unit 1/2 Los Angeles, CA | 6.0 | 5.0 | 2295 | $5,957 | $2.60 | 44d | 1 | 1.00mi |
| 2938 West Blvd Unit B Los Angeles, CA | 5.0 | 5.0 | 2158 | $4,762 | $2.21 | 44d | 1 | 1.01mi |
| 2324 S Dunsmuir Ave Unit 2 Los Angeles, CA | 5.0 | 5.5 | 2300 | $5,775 | $2.51 | 44d | 1 | 1.06mi |
| 1737 5th Ave Los Angeles, CA | 5.0 | 3.0 | 2664 | $4,980 | $1.87 | 25d | 1 | 1.06mi |
Listing history 36 events
-
2026-06-18days on market $777,773 Active 226 DOM
-
2026-06-17days on market $777,773 Active 225 DOM
-
2026-06-16days on market $777,773 Active 224 DOM
-
2026-06-15days on market $777,773 Active 223 DOM
-
2026-06-13days on market $777,773 Active 221 DOM
-
2026-06-09days on market $777,773 Active 217 DOM
-
2026-06-08days on market $777,773 Active 216 DOM
-
2026-06-07days on market $777,773 Active 215 DOM
-
2026-06-04days on market $777,773 Active 212 DOM
-
2026-06-03days on market $777,773 Active 211 DOM
-
2026-06-02days on market $777,773 Active 210 DOM
-
2026-06-01days on market $777,773 Active 209 DOM
-
2026-05-31days on market $777,773 Active 208 DOM
-
2026-04-28price $818,708 1159-char remark
Show marketing remark (1159 chars)
This property is now under auction terms. Auction ends Monday 5/4. All Bids must be submitted during the auction period via the property's listing page. This sale is subject to a 5% buyer's premium pursuant to the auction Terms & Conditions. All bids will be subject to seller approval (minimums may apply). Attention all ambitious investors! Prime investment opportunity. Occupied Duplex situated in the Mid-Los Angeles neighborhood. The central location ensures easy access to major highways, public transportation and cultural attractions such as the Los Angeles County Museum of Art (LACMA). The property is sold as-is, fully occupied and sight-unseen with no interior access. Exact occupancy unknown. Drive by only. Do not disturb. Cash only. Buyer to sign an"Occupied Property Addendum" with contract. Interior condition and exact bedroom/bathroom count unknown. Tax records indicate 6BR/3BA, previous MLS history indicates 7BR/5BA. Previous MLS states "detached storage unit" (converted garage, permits unknown). Property has violations from the City of Los Angeles. Buyers to exercise due diligence and rely on own findings.
-
2026-02-11price $889,900 1159-char remark
Show marketing remark (1159 chars)
This property is now under auction terms. Auction ends Monday 5/4. All Bids must be submitted during the auction period via the property's listing page. This sale is subject to a 5% buyer's premium pursuant to the auction Terms & Conditions. All bids will be subject to seller approval (minimums may apply). Attention all ambitious investors! Prime investment opportunity. Occupied Duplex situated in the Mid-Los Angeles neighborhood. The central location ensures easy access to major highways, public transportation and cultural attractions such as the Los Angeles County Museum of Art (LACMA). The property is sold as-is, fully occupied and sight-unseen with no interior access. Exact occupancy unknown. Drive by only. Do not disturb. Cash only. Buyer to sign an"Occupied Property Addendum" with contract. Interior condition and exact bedroom/bathroom count unknown. Tax records indicate 6BR/3BA, previous MLS history indicates 7BR/5BA. Previous MLS states "detached storage unit" (converted garage, permits unknown). Property has violations from the City of Los Angeles. Buyers to exercise due diligence and rely on own findings.
-
2025-12-12price $950,000 1159-char remark
Show marketing remark (1159 chars)
This property is now under auction terms. Auction ends Monday 5/4. All Bids must be submitted during the auction period via the property's listing page. This sale is subject to a 5% buyer's premium pursuant to the auction Terms & Conditions. All bids will be subject to seller approval (minimums may apply). Attention all ambitious investors! Prime investment opportunity. Occupied Duplex situated in the Mid-Los Angeles neighborhood. The central location ensures easy access to major highways, public transportation and cultural attractions such as the Los Angeles County Museum of Art (LACMA). The property is sold as-is, fully occupied and sight-unseen with no interior access. Exact occupancy unknown. Drive by only. Do not disturb. Cash only. Buyer to sign an"Occupied Property Addendum" with contract. Interior condition and exact bedroom/bathroom count unknown. Tax records indicate 6BR/3BA, previous MLS history indicates 7BR/5BA. Previous MLS states "detached storage unit" (converted garage, permits unknown). Property has violations from the City of Los Angeles. Buyers to exercise due diligence and rely on own findings.
-
2025-11-03$990,000 Active 1159-char remark
Show marketing remark (1159 chars)
This property is now under auction terms. Auction ends Monday 5/4. All Bids must be submitted during the auction period via the property's listing page. This sale is subject to a 5% buyer's premium pursuant to the auction Terms & Conditions. All bids will be subject to seller approval (minimums may apply). Attention all ambitious investors! Prime investment opportunity. Occupied Duplex situated in the Mid-Los Angeles neighborhood. The central location ensures easy access to major highways, public transportation and cultural attractions such as the Los Angeles County Museum of Art (LACMA). The property is sold as-is, fully occupied and sight-unseen with no interior access. Exact occupancy unknown. Drive by only. Do not disturb. Cash only. Buyer to sign an"Occupied Property Addendum" with contract. Interior condition and exact bedroom/bathroom count unknown. Tax records indicate 6BR/3BA, previous MLS history indicates 7BR/5BA. Previous MLS states "detached storage unit" (converted garage, permits unknown). Property has violations from the City of Los Angeles. Buyers to exercise due diligence and rely on own findings.
-
2025-05-04historical
-
2024-12-10$1,050,000 Active
-
2024-10-04status Pending Sale
-
2024-09-18status Active
-
2024-09-09historical Active Under Contract
-
2024-07-24price $1,050,000
-
2024-07-10$1,300,000 Active
-
2004-03-30soldstatus $515,000
-
2004-03-30soldstatus $515,000
-
2004-02-23historical
-
2004-02-05$495,000
-
2003-11-30historical
-
2003-07-28
-
2003-06-22historical
-
2003-06-06historical
-
2003-03-23
-
2003-03-23$449,000
-
2002-12-01historical
-
2002-09-13$359,500
ⓘ Source: listings_history table (triggers on properties + properties_extension) + one-shot
backfill from property_details.listing_events for pre-trigger history.
Tax reassessment forecast CA · Resets to sale price
- Current annual tax
- $8,116 · $676/mo
- Projected year-2 tax
- $8,116 · $676/mo
- Expected delta
- $0/yr ($0/mo · 0.0%)
ⓘ Screening estimate from a state-policy table — verify with the county assessor before closing.
Climate risk First Street
- Flood 1/10 Low FEMA zone X (unshaded) · 0% chance over 30 yrs
- Wildfire 1/10 Low
- Heat 6/10 Major 7 d/yr ≥89°F today · 21 d/yr by 30 yrs out
- Wind 1/10 Low
- Air quality 5/10 Major 7 unhealthy d/yr today · 7 by 30 yrs out
Nearby sold comps map
Loading sold comps map…
Walkable amenities ~0.75 mi
Loading nearby amenities…
Taxation est. · year 1
- Rental income
- $88,788
- − Mortgage interest
- −$43,567
- − Property taxes
- −$8,116
- − Insurance
- −$3,889
- − Repairs & maintenance
- −$7,103
- − Management
- −$7,103
- − Depreciation
- −$22,626
- Taxable loss
- −$3,616
- Est. tax savings @ 24.0%
- +$868
- After-tax cash flow
- $10,061/yr
For passive investors: Depreciation is non-cash, so a rental often shows a tax loss while cash-flowing — sheltering income. Rental losses are passive: they offset passive income freely, and up to $25,000/yr can offset ordinary (W-2) income if you actively participate and your MAGI is under $100k (phasing out to $0 by $150k); unused losses carry forward. On sale, claimed depreciation is recaptured at up to 25%, and gains may owe capital-gains tax (a 1031 exchange can defer both). Figures are a year-1 estimate at your 24.0% rate — not tax advice; consult a CPA.
Schools (NCES district)
- District
- Los Angeles Unified
- NCES district ID
- 0622710
- Math proficiency
- 29% ▼ -4.00%
- Reading proficiency
- 54% ▲ 10.00%
- Median HH income
- $50,403
- Composite
- 35.67/100
- National rank
- #4875
- State rank
- #223 of 517 in CA
Livability — Los Angeles
- Score
- 68/100
- State rank
- #273
- US rank
- #9237
Category grades
Schools grade is shown separately in the Schools card above.
Census & demographics
- Census place
- Los Angeles, CA
- County
- Los Angeles County · 9,444,647 people
- City population
- 3,838,149
- Metro
- Los Angeles-Long Beach-Anaheim, CA
- Population (ZIP)
- 59,548
- Household income
- $73,934
- Rent vs Own
- Severe rent burden
- 5272.0
Population outlook (Los Angeles County) Hauer SSP2
- Today (2025)
- 10,940,515 people
- By 2030
- 11,256,481 · +2.9%
- By 2040
- 11,729,929 · +7.2%
- By 2050
- 11,948,407 · +9.2%
- By 2075
- 11,818,114 · +8.0%
- By 2100
- 10,842,928 · -0.9%
Race, ethnicity, and origin ACS 2023
- Neighborhood character
- Highly diverse neighborhood (Simpson 0.73)
- Race & ethnicity
- Hispanic / Latino 43% White 18% Black 17% Asian 17% Two or more races 13%
- Hispanic origin (detail)
- Mexican 26%
- Common ancestry
- Lithuanian 1% Romanian 1% Italian 1%
- Foreign-born
- 37% · Canada, South Korea, China
- Languages at home
- 45% English-only · Spanish 38% Korean 10% Tagalog/Filipino 1%
Political lean MEDSL · Los Angeles
- 2024 margin
- Solid D (+32.9) · D 64.8% · R 31.9% · Other 3.3%
- 2008→2024 swing
- -7.4pp toward R · 2008: 40.4pp · 2024: 32.9pp
- All cycles
- 2024: D+32.9 2020: D+44.2 2016: D+48.0 2012: D+40.0 2008: D+40.4
Not yet ingested
- Civics
- —
Market trends
- HPI YoY
- ▼ -1477.82%
- Current HPI
- 425.5427
- Rent YoY
- ▼ -0.50%
- Metro
- Los Angeles-Long Beach-Anaheim, CA
- State GDP YoY
- ▲ 3.21%
- F500 in state
- 116
Industry mix (Fortune 500 HQ in CA)
| Industry | F500 HQs | Revenue |
|---|---|---|
| Technology | 27 | $1,492B |
|
||
| Financial Services | 3 | $174B |
|
||
| Retail | 3 | $44B |
|
||
| Insurance | 3 | $26B |
|
||
| Media / Entertainment | 2 | $115B |
|
||
| Pharmaceuticals / Biotech | 2 | $62B |
|
||
Price history
+127.7% since first listed23 events — show timeline
- 2026-04-28 Price Changed $818,708 TheMLS
- 2026-02-11 Price Changed $889,900 TheMLS
- 2025-12-12 Price Changed $950,000 TheMLS
- 2025-11-03 Listed $990,000 TheMLS
- 2025-05-04 Listing Removed — CRMLS
- 2024-12-10 Listed $1,050,000 CRMLS
- 2024-10-04 Pending — CRMLS
- 2024-09-18 Relisted — CRMLS
- 2024-09-09 Contingent — CRMLS
- 2024-07-24 Price Changed $1,050,000 CRMLS
- 2024-07-10 Listed $1,300,000 CRMLS
- 2004-03-30 Sold (Public Records) $515,000 Public Records
- 2004-03-30 Sold (MLS) $515,000 TheMLS
- 2004-02-23 Delisted — TheMLS
- 2004-02-05 Listed $495,000 TheMLS
- 2003-11-30 Delisted — TheMLS
- 2003-07-28 Listed — TheMLS
- 2003-06-22 Listing Removed — SDMLS
- 2003-06-06 Delisted — TheMLS
- 2003-03-23 Listed $449,000 SDMLS
- 2003-03-23 Listed — TheMLS
- 2002-12-01 Listing Removed — CRMLS
- 2002-09-13 Listed $359,500 CRMLS
Property tax history
+0.9%/yrLatest (2025): $8,116 · +1.5% YoY. Source: county tax records.
Cash-flow waterfall
monthlySold comps — $/sqft
last 12 mo · ≤1 miLoading sold comps…