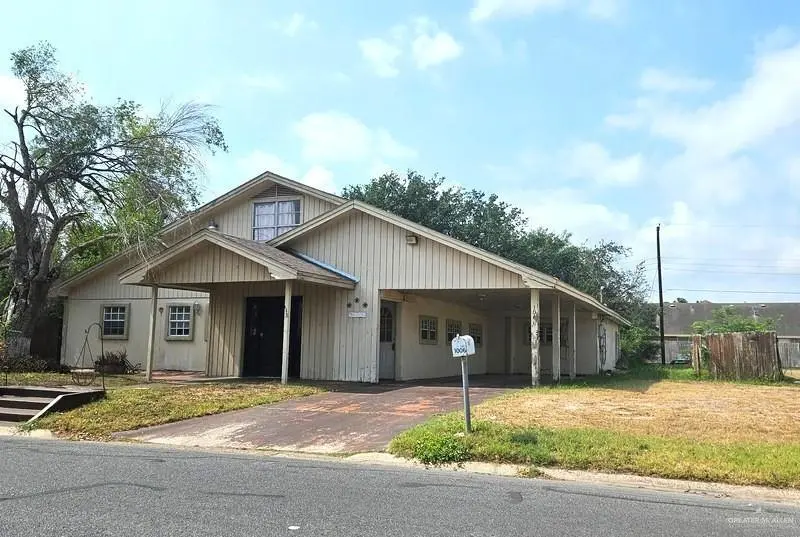
1006 E 12th St · Mission, TX
Flood risk 1/10 · Minimal
- FEMA flood zone
- X
- Chance of flooding over 30 yrs
- 0.0%
- Est. flood insurance / yr
- $507 – $1,088
Fire risk 2/10 · Minimal
- Est. fire insurance / yr
- $1,222 – $2,270
Heat risk 9/10 · Severe
- Hot days now (above 111°F)
- 7 days/yr
- Hot days in 30 yrs
- 21 days/yr
Wind risk 8/10 · Major
- Chance of severe wind over 30 yrs
- 96.0%
Air-quality risk 2/10 · Minimal
- Unhealthy air days now
- 1 days/yr
- Unhealthy air days in 30 yrs
- 2 days/yr
Risk factors via First Street. Map © Google.
Why this score? — see what drove the B- grade
The composite is a weighted blend of 9 inputs, each scored 0–100. Each bar is that input's sub-score; the figure is the points it added to the 100-point composite (weight × sub-score).
- Cash flow +23.9/30.0
- ARV discount +15.0/15.0
- 1% rule +7.7/10.0
- DSCR +7.7/10.0
- Livability +3.8/5.0
- Rent growth +2.7/5.0
- Condition / age +2.5/5.0
- Schools +1.7/10.0
- Appreciation +0.0/10.0
$155,000
🖨 Deal sheet 📄 Offer letter ✓ Due diligence
Listing remarks
VINTAGE STYLE With Great Potential JUST REDUCED!!! This 4-Bedroom 2 Full baths with over 2000 sf of living area is ready for renovations by YOU! This is an opportunity for you to turn this home into a beauty. "Sold As Is. " HUGE LOT with tons of potential to make it your dream home. This home is ready for your personal touch and is situated near City of Mission Golf Course, Hospital and Expressway 83, schools and shopping as well as eateries! Schedule all appointments through showings.com. This is a Fannie Mae HomePath First time buyers, complete the HomePath Ready Buyer homeownership course on Homepath.com. Attach certificate to offer up to 3% closing cost assistance. Check
Key facts
- Near schools
- Near hospital
- Near expressway 83
Tags
Property features AI
Finance
- Other: Green energy/efficiency: Other
- HOA & community: No homeowners association; No mandatory POA; Community features: Other
Exterior
- Parking: 1 total parking space; 1 covered space; Carport (attached, garage faces rear)
- Security: Smoke detector(s)
- Utilities: Public water; City sewer; Paved road access
- Home design: Single-family property; Facing information not provided
- Construction: Stucco and other construction materials; Composition shingle roof; Slab foundation; Built area approximately 2,090 square feet
- Exterior features: Covered patio; Chain link and wood fencing; Mature trees; Other exterior features
Interior
- Kitchen: No conveying appliances; Electric water heater
- Bedrooms: Master bedroom with walk-in closet(s)
- Flooring: Carpet; Concrete; Laminate; Tile
- Bathrooms: 2 full bathrooms
- Interior features: Laminate countertops; Ceiling fans; Walk-in closet(s); No window coverings
- Laundry & utility: Laundry room with washer/dryer connection; Water heater located in other location
Neighborhood map
What this means for you Summary
Snapshot
- This is a 3-bed/2.0-bath single-family listed at $155k.
Deal economics
- At list price, monthly cash flow is $302 ($4k/yr) — positive.
- The deal already cash-flows at list — no discount required.
- Meets the 1% rule at list price ($2k rent vs $155k).
- Recommended offer: $150k (3.0% below list) — sets the bar for market timing.
- Cap rate 8.6% vs local median 3.5% in Mission — top-decile yield for the area; either an underpriced asset or a hidden risk that comps aren't pricing in. Stress-test before assuming the spread holds.
Location & tenants
- Location reads 75/100 on livability (#148 in TX, #4,155 nationally) — a middle-class / working-renter tenant base. Strengths: cost of living A+, housing A+, health & safety A+; Watch: amenities F, commute F, employment D-.
- Mission CISD (urban): math 15% / reading 28% proficiency, ranked #775 of 826 in TX (top 94%) — low school quality limits family demand, transient renter base, plan for 1-2y turnover; 78% free/reduced lunch — lower-income household profile, screen leases tightly.
- Zoned schools: Bryan El (math 17% / reading 32%, grade F, #3,052 of 4,322 statewide, top 74%, 651 students, 71% FRL); Mission J H (math 13% / reading 26%, grade F, #1,445 of 1,662 statewide, top 88%, 680 students, 78% FRL); Veterans Memorial H S (math 19% / reading 44%, grade F, #1,073 of 1,632 statewide, top 66%, 1,932 students, 81% FRL) — zoned schools at 77% FRL track the district average.
- Market conditions: Rents flat; 852 active listings in the ZIP; 4 comparable units currently listed for rent nearby; rentals at typical pace (median 22d on market — plan ~3-4 weeks tenant-placement turnaround); 7,378 units permitted in Hidalgo County in 2024 (641 in 5+ unit buildings).
- This rent runs 44% of the median local income ($54k/yr) — at the standard rent-burdened threshold; future hikes will face affordability resistance.
Forward outlook
- Local home prices are declining (-3.0%/yr); year-one equity from $1k of loan paydown is wiped out by about $5k of value loss. Plan a longer hold.
- Hidalgo County population projected at +28% by 2050 — long-run rental-demand tailwind backs the buy-and-hold thesis.
Negotiation context
- It's been on market 49 days — a 3% lower offer ($150k) is reasonable based on typical stale-listing flexibility.
- 3 sale attempts with the ask held roughly flat each time — persistent listings suggest the price (not the market) is what's stuck; bring a comps-based counter.
Risks & watch-outs
- Watch-outs: property tax is 2.9% of price.
- Climate carrying-cost: severe wind risk, 96% chance of damaging wind over 30y; extreme-heat days projected 7→21/yr by 2055 (HVAC capex compounding) — expect insurance premiums to compound above CPI over the hold.
Questions for the listing agent
- It's been on market 49 days. Have you received any prior offers? Is the seller open to a 3% concession, seller financing, or rate buy-down credit?
- Built in 1979 — when were the roof, HVAC, electrical panel, plumbing, and water heater last replaced?
- Property tax is high relative to price — has the assessment been appealed recently, and will the sale trigger a re-assessment?
- Is there a deadline driving the sale (1031 exchange, divorce, estate, relocation)? That informs how much negotiation room exists.
- What's the average days-on-market for RENTAL listings here right now (not sales)? A rising rental-DOM trend means longer vacancies and softer asking-rent achievability than the comps imply.
- What's the recent tenant-quality profile in this submarket — average credit score on applications, eviction rate, late-payment / NSF rate, and stable-employment percentage? A property-management company in the area should have these aggregated.
- How much new for-sale + rental construction is in the pipeline within 1–3 miles? Heavy new supply typically softens prices + rents 12–24 months out; constrained supply supports both.
Investment metrics
- 1% rule
- 1.27% ✓
- Cap rate
- 8.63%
- Cash-on-cash
- 8.34%
- DSCR
- 1.37
- GRM
- 6.6
CMA / ARV
- ARV (median comp)
- $235,864
- List price
- $155,000
- Delta
- -34.28%
- Verdict
- UNDERPRICED
- Comps
- 20 within 1.0 mi
Show comp detail 3 sales within ~0.75 mi
| Address | Dist | Beds/Ba | Sqft | Sold | Price | $/sf | Match |
|---|---|---|---|---|---|---|---|
| 1101 Elm St | 0.12mi | 3/4.5 | 2,812 (-4%) | 13mo | $210,000 | $75 | 68 |
| 1710 Miller Ave | 0.67mi | 4/4.0 (+1) | 3,053 (+5%) | 16mo | $395,000 | $129 | 35 |
| 1502 Betty Dr | 0.73mi | 4/3.5 (+1) | 3,343 (+15%) | 7mo | $382,000 | $114 | 25 |
Match score weights: distance 35% · size 25% · config 20% · recency 20%. Top-matched comps best support the ARV.
Projected returns pro-forma
-3.0% appreciation · 0.93% rent growth · sell at horizon
- IRR
- -6.2%
- Equity multiple
- 0.77×
- Total profit
- $-9,779
- Equity at exit
- $23,111
- IRR
- 0.4%
- Equity multiple
- 1.02×
- Total profit
- $979
- Equity at exit
- $13,402
Cash invested: $43,400 (down + closing). Projections, not guarantees.
Landlord ↔ Tenant lean methodology
- Overall (STATE)
- 87 Strongly Landlord-Friendly
- State Texas
- 87 Strongly Landlord-Friendly · R+5
- County
- — inherits STATE
- City
- — inherits STATE
ZIP-level market 78572
- Home prices YoY
- -22.9%
- Rents YoY
- 0.9%
- Active inventory
- 852
- Price-to-rent
- 6.6×
Monthly cashflow live
- Estimated rent
- $1,970 medium interval (Pro) →
- Mortgage (P&I)
- −$813
- Tax from tax record
- −$377 /mo · $4,530/yr
- Insurance
- −$65
- HOA
- −$0
- Vacancy / Maint / Mgmt
- −$414
- Net cashflow
- $302
Break-even live
UW: 25.0% down · 7.5% · 30yr · 1.5% tax · 5.0% vac · 8.0% maint · 8.0% mgmt
Financing live
Cash to close
- Down payment
- $38,750
- Closing costs
- $4,650
- Reserves months
- —
- Total cash needed
- —
Loan-product check · same deal, 3 products live
Conventional
25% down · 7.5% · 30yr
- Down + closing
- —
- Monthly P&I
- —
- Monthly cashflow
- —
- DSCR
- —
- Eligible?
- —
Personal DTI + credit; lowest rate.
DSCR
20% down · 8.5% · 30yr
- Down + closing
- —
- Monthly P&I
- —
- Monthly cashflow
- —
- DSCR
- —
- Eligible?
- —
No personal income docs; deal must DSCR.
Hard money
10% down · 12.0% · 12mo
- Down + closing
- —
- Monthly P&I
- —
- Monthly cashflow
- —
- DSCR
- —
- Eligible?
- —
Short-term bridge; refi at stabilization.
Rent comps 4 comps
| Address | Beds | Baths | Sqft | Rent | $/sqft | DOM | Units | Dist |
|---|---|---|---|---|---|---|---|---|
| 1301 San Felipe Dr Mission, TX | 4.0 | 3.0 | 2788 | $2,100 | $0.75 | 44d | 1 | 0.55mi |
| 2216 Robyn Ln Mission, TX | 3.0 | 3.0 | 2033 | $2,000 | $0.98 | 21d | 1 | 0.86mi |
| 1606 Terrace Dr Mission, TX | 4.0 | 3.0 | 2127 | $2,600 | $1.22 | 14d | 1 | 1.04mi |
| 1604 Toni Ln Mission, TX | 2.0 | 2.5 | 2848 | $1,800 | $0.63 | 14d | 1 | 1.13mi |
Listing history 23 events
-
2026-06-18days on market $155,000 Active 49 DOM
-
2026-06-17days on market $155,000 Active 48 DOM
-
2026-06-16days on market $155,000 Active 47 DOM
-
2026-06-15days on market $155,000 Active 46 DOM
-
2026-06-14days on market $155,000 Active 44 DOM
-
2026-06-10days on market $155,000 Active 41 DOM
-
2026-06-09days on market $155,000 Active 40 DOM
-
2026-06-08days on market $155,000 Active 39 DOM
-
2026-06-07days on market $155,000 Active 38 DOM
-
2026-06-03days on market $155,000 Active 34 DOM
-
2026-06-02days on market $155,000 Active 33 DOM
-
2026-06-01days on market $155,000 Active 32 DOM
-
2026-05-31remarks 689-char remark
-
2026-05-31days on market $155,000 Active 31 DOM
-
2026-05-31days on market $155,000 Active 30 DOM
-
2026-04-17$155,000 Active 533-char remark
-
2026-02-23$155,000 Active
-
2026-01-09price $155,000
-
2025-12-11price $160,000
-
2025-11-10$165,000 Active
-
2019-09-24soldstatus
-
2012-05-29soldstatus
-
1991-05-07soldstatus
ⓘ Source: listings_history table (triggers on properties + properties_extension) + one-shot
backfill from property_details.listing_events for pre-trigger history.
Tax reassessment forecast TX · Resets to sale price
- Current annual tax
- $4,530 · $377/mo
- Projected year-2 tax
- $4,530 · $377/mo
- Expected delta
- $0/yr ($0/mo · 0.0%)
ⓘ Screening estimate from a state-policy table — verify with the county assessor before closing.
Climate risk First Street
- Flood 1/10 Low FEMA zone X · 0% chance over 30 yrs
- Wildfire 2/10 Low
- Heat 9/10 Extreme 7 d/yr ≥111°F today · 21 d/yr by 30 yrs out
- Wind 8/10 Severe 96% chance of damaging wind over 30 yrs
- Air quality 2/10 Low 1 unhealthy d/yr today · 2 by 30 yrs out
Nearby sold comps map
Loading sold comps map…
Walkable amenities ~0.75 mi
Loading nearby amenities…
Taxation est. · year 1
- Rental income
- $23,645
- − Mortgage interest
- −$8,682
- − Property taxes
- −$4,530
- − Insurance
- −$775
- − Repairs & maintenance
- −$1,892
- − Management
- −$1,892
- − Depreciation
- −$4,509
- Taxable income
- $1,365
- Est. tax owed @ 24.0%
- −$328
- After-tax cash flow
- $3,293/yr
For passive investors: Depreciation is non-cash, so a rental often shows a tax loss while cash-flowing — sheltering income. Rental losses are passive: they offset passive income freely, and up to $25,000/yr can offset ordinary (W-2) income if you actively participate and your MAGI is under $100k (phasing out to $0 by $150k); unused losses carry forward. On sale, claimed depreciation is recaptured at up to 25%, and gains may owe capital-gains tax (a 1031 exchange can defer both). Figures are a year-1 estimate at your 24.0% rate — not tax advice; consult a CPA.
Schools (NCES district)
- District
- Mission CISD
- NCES district ID
- 4831040
- Math proficiency
- 15% ▼ -35.00%
- Reading proficiency
- 28% ▼ -15.00%
- Median HH income
- $32,855
- Composite
- 17.47/100
- National rank
- #9061
- State rank
- #775 of 826 in TX
Livability — Mission
- Score
- 75/100
- State rank
- #148
- US rank
- #4155
Category grades
Schools grade is shown separately in the Schools card above.
Census & demographics
- Census place
- Mission, TX
- County
- Hidalgo County · 623,128 people
- City population
- 78,024
- Metro
- McAllen-Edinburg-Mission, TX
- Population (ZIP)
- 78,024
- Household income
- $54,298
- Rent vs Own
- Severe rent burden
- 1714.0
Population outlook (Hidalgo County) Hauer SSP2
- Today (2025)
- 955,232 people
- By 2030
- 1,009,774 · +5.7%
- By 2040
- 1,120,332 · +17.3%
- By 2050
- 1,225,036 · +28.2%
- By 2075
- 1,439,189 · +50.7%
- By 2100
- 1,533,429 · +60.5%
Race, ethnicity, and origin ACS 2023
- Neighborhood character
- Predominantly Hispanic (85%)
- Race & ethnicity
- Hispanic / Latino 85% Two or more races 47% White 12% Asian 2%
- Hispanic origin (detail)
- Mexican 80%
- Common ancestry
- Slovak 1% Portuguese 0%
- Foreign-born
- 28% · Canada, South Korea
- Languages at home
- 22% English-only · Spanish 76%
Political lean MEDSL · Hidalgo
- 2024 margin
- Toss-up / Even · D 48.1% · R 51.0%
- 2008→2024 swing
- -41.6pp toward R · 2008: 38.7pp · 2024: -2.9pp
- All cycles
- 2024: R+2.9 2020: D+17.1 2016: D+40.5 2012: D+41.8 2008: D+38.7
Not yet ingested
- Civics
- —
Market trends
- HPI YoY
- ▼ -62.35%
- Current HPI
- 209.3573
- Rent YoY
- ▲ 0.93%
- Metro
- McAllen-Edinburg-Mission, TX
- State GDP YoY
- ▲ 3.95%
- F500 in state
- 110
Industry mix (Fortune 500 HQ in TX)
| Industry | F500 HQs | Revenue |
|---|---|---|
| Energy | 16 | $1,198B |
|
||
| Technology | 5 | $198B |
|
||
| Engineering / Construction | 4 | $72B |
|
||
| Energy Services | 3 | $60B |
|
||
| Utilities | 3 | $41B |
|
||
| Healthcare | 2 | $330B |
|
||
Price history
-6.1% since first listed8 events — show timeline
- 2026-04-17 Listed $155,000 MCALLENMLS
- 2026-02-23 Listed $155,000 MCALLENMLS
- 2026-01-09 Price Changed $155,000 MCALLENMLS
- 2025-12-11 Price Changed $160,000 MCALLENMLS
- 2025-11-10 Listed $165,000 MCALLENMLS
- 2019-09-24 Sold (Public Records) — Public Records
- 2012-05-29 Sold (Public Records) — Public Records
- 1991-05-07 Sold (Public Records) — Public Records
Property tax history
+6.5%/yrLatest (2025): $4,530 · -9.4% YoY. Source: county tax records.
Cash-flow waterfall
monthlySold comps — $/sqft
last 12 mo · ≤1 miLoading sold comps…