 🏷️ Likely Rental
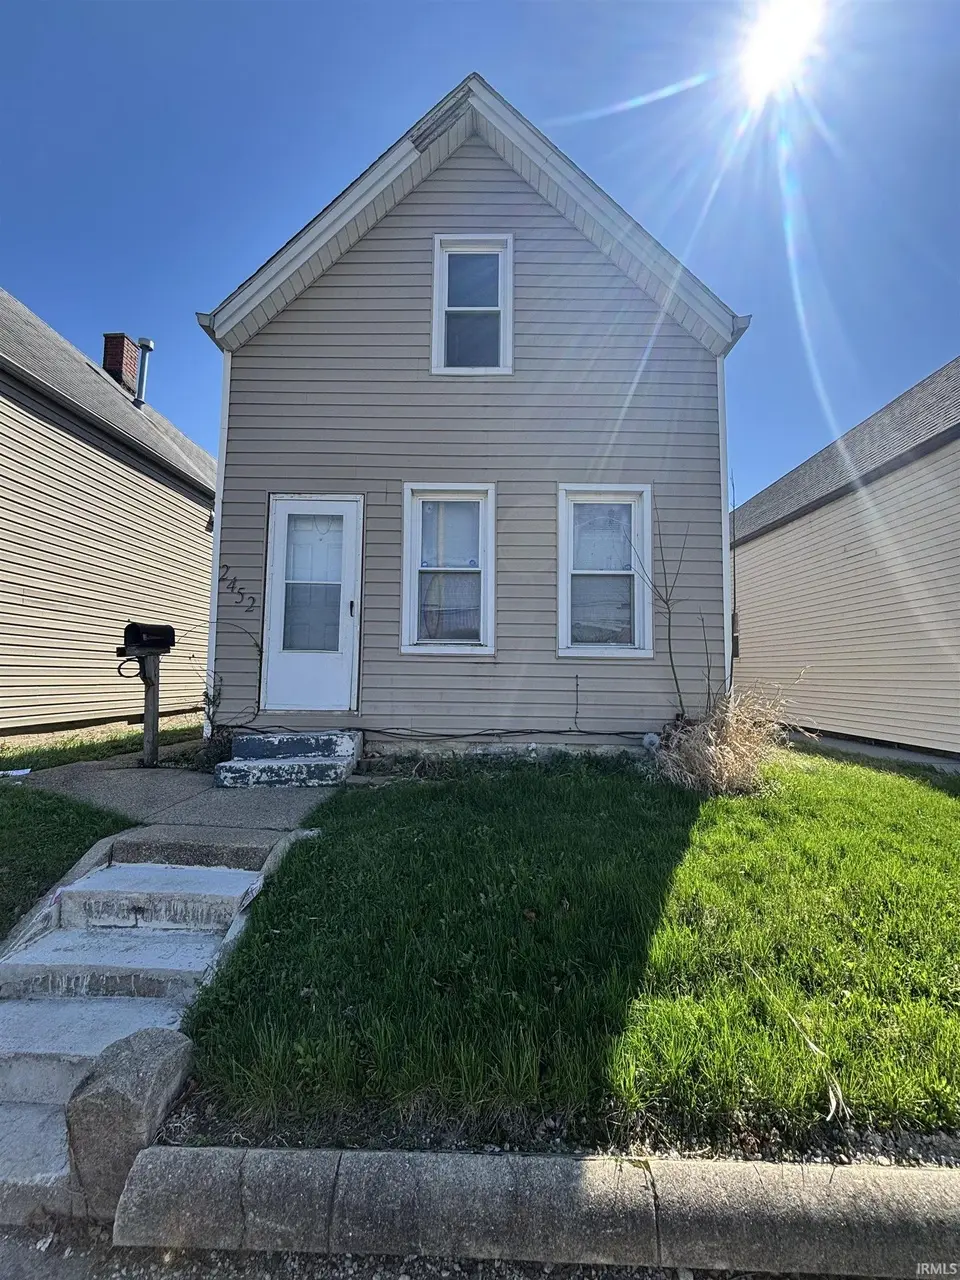
2452 W Maryland St · Evansville, IN
Flood risk 1/10 · Minimal
- FEMA flood zone
- X (unshaded)
- Chance of flooding over 30 yrs
- 0.0%
- Est. flood insurance / yr
- $507 – $1,088
Fire risk 1/10 · Minimal
- Est. fire insurance / yr
- $717 – $1,331
Heat risk 5/10 · Moderate
- Hot days now (above 107°F)
- 7 days/yr
- Hot days in 30 yrs
- 19 days/yr
Wind risk 2/10 · Minimal
- Chance of severe wind over 30 yrs
- 4.0%
Air-quality risk 4/10 · Minor
- Unhealthy air days now
- 3 days/yr
- Unhealthy air days in 30 yrs
- 5 days/yr
Risk factors via First Street. Map © Google.
Why this score? — see what drove the B- grade
The composite is a weighted blend of 9 inputs, each scored 0–100. Each bar is that input's sub-score; the figure is the points it added to the 100-point composite (weight × sub-score).
- Cash flow +26.1/30.0
- ARV discount +15.0/15.0
- DSCR +8.8/10.0
- 1% rule +6.2/10.0
- Schools +3.3/10.0
- Livability +3.2/5.0
- Rent growth +2.5/5.0
- Condition / age +2.5/5.0
- Appreciation +0.0/10.0
$119,900
🖨 Deal sheet 📄 Offer letter ✓ Due diligence
Listing remarks
This turnkey rental home offers immediate cash flow with an established tenant in place since 2022. Currently generating $950 per month in rental income, the property provides dependable returns with utilities paid by the tenant. Located on the west side, the home includes all appliances and boasts a strong rental history, making it a low-maintenance investment and an easy addition to any portfolio.
Key facts
- 2,500 sq ft lot
- Built 1953
- Listed 86 days
Property features AI
Exterior
- Security: Smoke detectors
- Utilities: Public water; Public sewer
- Home design: Single-family residence (site-built); 2 stories
- Construction: Aluminum siding; Vinyl siding
- Exterior features: Level lot
Interior
- Bedrooms: Total of 5 rooms (bedroom count not specified)
- Flooring: Carpet; Vinyl
- Bathrooms: 1 full bathroom; 1 main-level bathroom
- Heating & cooling: Central air conditioning; Forced air heating
- Interior features: Carpet and vinyl flooring; Crawl space basement
- Laundry & utility: Washer hookup on the main level
Neighborhood map
What this means for you Summary
Snapshot
- This is a 3-bed/1.0-bath single-family listed at $120k.
Deal economics
- At list price, monthly cash flow is $304 ($4k/yr) — positive.
- The deal already cash-flows at list — no discount required.
- Meets the 1% rule at list price ($1k rent vs $120k).
- Recommended offer: $113k (6.0% below list) — sets the bar for market timing.
- Cap rate 9.3% vs local median 4.6% in Evansville — top-decile yield for the area; either an underpriced asset or a hidden risk that comps aren't pricing in. Stress-test before assuming the spread holds.
Location & tenants
- Location reads 63/100 on livability (#416 in IN) — a middle-class / working-renter tenant base. Strengths: cost of living A+, housing A+, health & safety A+; Watch: crime F, commute F, employment D-.
- Evansville Vanderburgh School Corporation (urban): math 36% / reading 43% proficiency, ranked #153 of 301 in IN (top 51%) — families likely to look elsewhere, expect single-tenant / working-renter base with shorter leases.
- Zoned schools: Tekoppel Elementary School (math 42% / reading 33%, grade F, #543 of 994 statewide, top 55%, 445 students, 73% FRL); Helfrich Park Stem Academy (math 36% / reading 47%, grade F, #108 of 330 statewide, top 34%, 517 students, 52% FRL); Francis Joseph Reitz High School (math 45% / reading 68%, grade C, #70 of 369 statewide, top 19%, 1,280 students, 44% FRL).
- Market conditions: 134 active listings in the ZIP; 1 comparable units currently listed for rent nearby; 508 units permitted in Vanderburgh County in 2024 (32 in 5+ unit buildings).
Forward outlook
- Local home prices are declining (-3.0%/yr); year-one equity from $829 of loan paydown is wiped out by about $4k of value loss. Plan a longer hold.
- At projected returns (-3.0% appreciation + 3.0% rent growth), your $34k cash investment doubles in ~10 years — after that, you're playing with house money.
Negotiation context
- It's been on market 86 days — a 6% lower offer ($113k) is reasonable based on typical stale-listing flexibility.
- 3 sale attempts since 6y ago; this cycle's ask has dropped $10k (8%) from the opening price — seller is motivated, your offer sets the floor, not the list.
- Current owner paid $75k; list at $120k implies a 60% gain — meaningful room to come down on a strong offer.
Risks & watch-outs
- Watch-outs: built in 1953 — expect roof / HVAC / electrical / plumbing capex.
- Climate carrying-cost: extreme-heat days projected 7→19/yr by 2055 (HVAC capex compounding) — expect insurance premiums to compound above CPI over the hold.
Questions for the listing agent
- It's been on market 86 days. Have you received any prior offers? Is the seller open to a 6% concession, seller financing, or rate buy-down credit?
- Built in 1953 — when were the roof, HVAC, electrical panel, plumbing, and water heater last replaced?
- Why hasn't it sold? Are there any deal-killer items the seller is aware of (foundation, flood, title, zoning, code violations)?
- Is there a deadline driving the sale (1031 exchange, divorce, estate, relocation)? That informs how much negotiation room exists.
- Schools are D-rated, which usually means shorter tenancies and higher turnover. Who's the typical renter profile here, and what's been the actual vacancy rate?
- Crime grade is F in this area — have there been break-ins, vandalism, or insurance claims at this property in the last 3 years? What carrier currently insures it and at what premium?
- What's the average days-on-market for RENTAL listings here right now (not sales)? A rising rental-DOM trend means longer vacancies and softer asking-rent achievability than the comps imply.
- What's the recent tenant-quality profile in this submarket — average credit score on applications, eviction rate, late-payment / NSF rate, and stable-employment percentage? A property-management company in the area should have these aggregated.
- How much new for-sale + rental construction is in the pipeline within 1–3 miles? Heavy new supply typically softens prices + rents 12–24 months out; constrained supply supports both.
Investment metrics
- 1% rule
- 1.12% ✓
- Cap rate
- 9.33%
- Cash-on-cash
- 10.85%
- DSCR
- 1.48
- GRM
- 7.4
CMA / ARV
- ARV (on-the-fly)
- $188,160
- Comps found
- 12
Show comp detail 12 sales within ~0.75 mi
| Address | Dist | Beds/Ba | Sqft | Sold | Price | $/sf | Match |
|---|---|---|---|---|---|---|---|
| 1412 Russell Ave | 0.41mi | 3/1.5 | 1,820 (+2%) | 7mo | $195,525 | $107 | 71 |
| 2726 W Franklin St | 0.41mi | 3/1.5 | 1,676 (-6%) | 2mo | $195,000 | $116 | 66 |
| 2218 W Maryland St | 0.20mi | 3/1.0 | 1,536 (-14%) | 4mo | $75,000 | $49 | 63 |
| 2200 W Virginia St | 0.34mi | 3/2.5 | 2,009 (+12%) | 0mo | $166,400 | $83 | 58 |
| 3106 Mount Vernon Ave | 0.64mi | 3/1.5 | 1,710 (-5%) | 3mo | $192,000 | $112 | 58 |
| 2518 W Illinois St | 0.41mi | 3/2.5 | 1,658 (-8%) | 8mo | $180,000 | $109 | 56 |
| 2206 W Virginia St | 0.33mi | 4/2.0 (+1) | 2,006 (+12%) | 4mo | $197,900 | $99 | 53 |
| 809 Harmony Way | 0.57mi | 4/2.0 (+1) | 1,905 (+6%) | 3mo | $200,000 | $105 | 52 |
| 1710 Russell Ave | 0.62mi | 3/1.0 | 1,997 (+11%) | 1mo | $265,000 | $133 | 51 |
| 2813 W Franklin St | 0.48mi | 3/1.0 | 1,548 (-14%) | 5mo | $119,900 | $77 | 50 |
| 2117 W Indiana St | 0.55mi | 4/2.0 (+1) | 1,952 (+9%) | 0mo | $155,000 | $79 | 50 |
| 806 Varner Ave | 0.74mi | 4/2.0 (+1) | 1,950 (+9%) | 6mo | $108,500 | $56 | 37 |
Match score weights: distance 35% · size 25% · config 20% · recency 20%. Top-matched comps best support the ARV.
Projected returns pro-forma
-3.0% appreciation · 3.0% rent growth · sell at horizon
- IRR
- -0.1%
- Equity multiple
- 1.00×
- Total profit
- $-112
- Equity at exit
- $17,877
- IRR
- 9.6%
- Equity multiple
- 1.74×
- Total profit
- $24,709
- Equity at exit
- $10,367
Cash invested: $33,572 (down + closing). Projections, not guarantees.
Landlord ↔ Tenant lean methodology
- Overall (STATE)
- 90 Strongly Landlord-Friendly
- State Indiana
- 90 Strongly Landlord-Friendly · R+11
- County
- — inherits STATE
- City
- — inherits STATE
ZIP-level market 47712
- Home prices YoY
- -32.1%
- Active inventory
- 134
- Price-to-rent
- 7.4×
Monthly cashflow live
- Estimated rent
- $1,342 medium interval (Pro) →
- Mortgage (P&I)
- −$629
- Tax from tax record
- −$78 /mo · $937/yr
- Insurance
- −$50
- HOA
- −$0
- Vacancy / Maint / Mgmt
- −$282
- Net cashflow
- $304
Break-even live
UW: 25.0% down · 7.5% · 30yr · 1.5% tax · 5.0% vac · 8.0% maint · 8.0% mgmt
Financing live
Cash to close
- Down payment
- $29,975
- Closing costs
- $3,597
- Reserves months
- —
- Total cash needed
- —
Loan-product check · same deal, 3 products live
Conventional
25% down · 7.5% · 30yr
- Down + closing
- —
- Monthly P&I
- —
- Monthly cashflow
- —
- DSCR
- —
- Eligible?
- —
Personal DTI + credit; lowest rate.
DSCR
20% down · 8.5% · 30yr
- Down + closing
- —
- Monthly P&I
- —
- Monthly cashflow
- —
- DSCR
- —
- Eligible?
- —
No personal income docs; deal must DSCR.
Hard money
10% down · 12.0% · 12mo
- Down + closing
- —
- Monthly P&I
- —
- Monthly cashflow
- —
- DSCR
- —
- Eligible?
- —
Short-term bridge; refi at stabilization.
Rent comps 1 comps
| Address | Beds | Baths | Sqft | Rent | $/sqft | DOM | Units | Dist |
|---|---|---|---|---|---|---|---|---|
| 1319 Uhlhorn St Evansville, IN | 3.0 | 2.0 | 1424 | $1,350 | $0.95 | 13d | 1 | 1.25mi |
Listing history 21 events
-
2026-06-18days on market $119,900 Active 86 DOM
-
2026-06-17remarks 403-char remark
-
2026-06-17price $119,900 Active 85 DOM
-
2026-06-17days on market $127,900 Active 85 DOM
-
2026-06-16days on market $127,900 Active 84 DOM
-
2026-06-15days on market $127,900 Active 83 DOM
-
2026-06-14days on market $127,900 Active 81 DOM
-
2026-06-13days on market $127,900 Active 80 DOM
-
2026-06-10days on market $127,900 Active 78 DOM
-
2026-06-09days on market $127,900 Active 77 DOM
-
2026-06-08days on market $127,900 Active 76 DOM
-
2026-06-07days on market $127,900 Active 75 DOM
-
2026-06-02days on market $127,900 Active 70 DOM
-
2026-06-01days on market $127,900 Active 69 DOM
-
2026-05-31days on market $127,900 Active 68 DOM
-
2026-05-30days on market $127,900 Active 67 DOM
-
2026-05-01price $127,900
-
2026-03-24$129,900 Active
-
2026-03-24$129,900 Active
-
2020-11-16soldstatus $75,000
-
2020-09-08$77,900
ⓘ Source: listings_history table (triggers on properties + properties_extension) + one-shot
backfill from property_details.listing_events for pre-trigger history.
Tax reassessment forecast IN · Partial reset (capped growth)
- Current annual tax
- $937 · $78/mo
- Projected year-2 tax
- $978 · $81/mo
- Expected delta
- +$41/yr (+$3/mo · 4.4%)
ⓘ Screening estimate from a state-policy table — verify with the county assessor before closing.
Climate risk First Street
- Flood 1/10 Low FEMA zone X (unshaded) · 0% chance over 30 yrs
- Wildfire 1/10 Low
- Heat 5/10 Major 7 d/yr ≥107°F today · 19 d/yr by 30 yrs out
- Wind 2/10 Low 4% chance of damaging wind over 30 yrs
- Air quality 4/10 Moderate 3 unhealthy d/yr today · 5 by 30 yrs out
Nearby sold comps map
Loading sold comps map…
Walkable amenities ~0.75 mi
Loading nearby amenities…
Taxation est. · year 1
- Rental income
- $16,108
- − Mortgage interest
- −$6,716
- − Property taxes
- −$937
- − Insurance
- −$600
- − Repairs & maintenance
- −$1,289
- − Management
- −$1,289
- − Depreciation
- −$3,488
- Taxable income
- $1,790
- Est. tax owed @ 24.0%
- −$430
- After-tax cash flow
- $3,214/yr
For passive investors: Depreciation is non-cash, so a rental often shows a tax loss while cash-flowing — sheltering income. Rental losses are passive: they offset passive income freely, and up to $25,000/yr can offset ordinary (W-2) income if you actively participate and your MAGI is under $100k (phasing out to $0 by $150k); unused losses carry forward. On sale, claimed depreciation is recaptured at up to 25%, and gains may owe capital-gains tax (a 1031 exchange can defer both). Figures are a year-1 estimate at your 24.0% rate — not tax advice; consult a CPA.
Schools (NCES district)
- District
- Evansville Vanderburgh School Corporation
- NCES district ID
- 1803450
- Math proficiency
- 36% ▼ -7.00%
- Reading proficiency
- 43% ▼ -3.00%
- Median HH income
- $43,270
- Composite
- 33.41/100
- National rank
- #5471
- State rank
- #153 of 301 in IN
Livability — Evansville
- Score
- 63/100
- State rank
- #416
- US rank
- #15047
Category grades
Schools grade is shown separately in the Schools card above.
Census & demographics
- Census place
- Evansville, IN
- County
- Vanderburgh County · 146,793 people
- City population
- 146,793
- Metro
- Evansville, IN-KY
- Population (ZIP)
- 25,444
- Household income
- $68,494
- Rent vs Own
- Severe rent burden
- 797.0
Population outlook (Vanderburgh County) Hauer SSP2
- Today (2025)
- 187,038 people
- By 2030
- 188,907 · +1.0%
- By 2040
- 190,272 · +1.7%
- By 2050
- 188,871 · +1.0%
- By 2075
- 180,751 · -3.4%
- By 2100
- 163,015 · -12.8%
Race, ethnicity, and origin ACS 2023
- Neighborhood character
- Predominantly White (91%)
- Race & ethnicity
- White 91% Two or more races 4% Hispanic / Latino 2% Black 2% Asian 2%
- Common ancestry
- Romanian 3% Lithuanian 2% Italian 1%
- Foreign-born
- 2% · China, Canada
- Languages at home
- 97% English-only · Spanish 1%
Political lean MEDSL · Vanderburgh
- 2024 margin
- R (+12.7) · D 43.0% · R 55.6% · Other 1.4%
- 2008→2024 swing
- -15.1pp toward R · 2008: 2.5pp · 2024: -12.7pp
- All cycles
- 2024: R+12.7 2020: R+9.6 2016: R+16.9 2012: R+10.8 2008: D+2.5
Not yet ingested
- Civics
- —
Market trends
- HPI YoY
- ▼ -101.86%
- Current HPI
- 215.5153
- Rent YoY
- —
- Metro
- Evansville, IN-KY
- State GDP YoY
- ▲ 2.90%
- F500 in state
- 18
Industry mix (Fortune 500 HQ in IN)
| Industry | F500 HQs | Revenue |
|---|---|---|
| Industrial Machinery | 2 | $37B |
|
||
| Healthcare | 1 | $177B |
|
||
| Pharmaceuticals | 1 | $45B |
|
||
| Metals / Steel | 1 | $18B |
|
||
| Agriculture | 1 | $17B |
|
||
| Packaging | 1 | $12B |
|
||
Price history
+64.2% since first listed5 events — show timeline
- 2026-05-01 Price Changed $127,900 IRMLS
- 2026-03-24 Listed $129,900 IRMLS
- 2026-03-24 Listed $129,900 IRMLS
- 2020-11-16 Sold (MLS) $75,000 IRMLS
- 2020-09-08 Listed $77,900 IRMLS
Property tax history
+9.4%/yrLatest (2024): $937 · -2.3% YoY. Source: county tax records.
Cash-flow waterfall
monthlySold comps — $/sqft
last 12 mo · ≤1 miLoading sold comps…