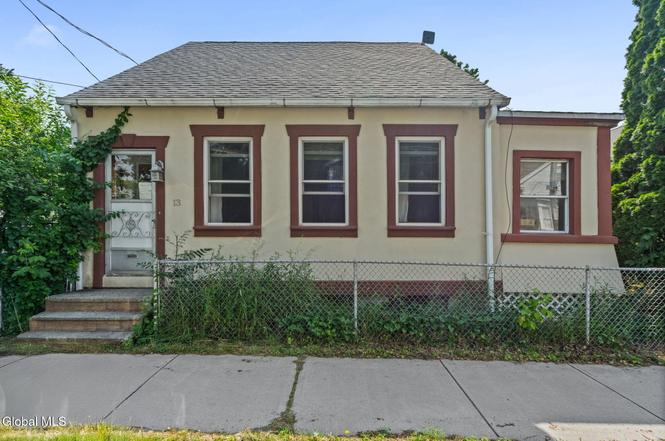
13 Sand St · Albany, NY
Flood risk 1/10 · Minimal
- FEMA flood zone
- X (unshaded)
- Chance of flooding over 30 yrs
- 0.0%
- Est. flood insurance / yr
- $473 – $860
Fire risk 3/10 · Minor
- Est. fire insurance / yr
- $691 – $1,283
Heat risk 4/10 · Minor
- Hot days now (above 99°F)
- 7 days/yr
- Hot days in 30 yrs
- 16 days/yr
Wind risk 3/10 · Minor
- Chance of severe wind over 30 yrs
- 7.0%
Air-quality risk 1/10 · Minimal
- Unhealthy air days now
- 0 days/yr
- Unhealthy air days in 30 yrs
- 0 days/yr
Risk factors via First Street. Map © Google.
Why this score? — see what drove the C+ grade
The composite is a weighted blend of 9 inputs, each scored 0–100. Each bar is that input's sub-score; the figure is the points it added to the 100-point composite (weight × sub-score).
- Cash flow +20.8/30.0
- ARV discount +15.0/15.0
- DSCR +6.6/10.0
- 1% rule +6.3/10.0
- Livability +4.0/5.0
- Schools +3.2/10.0
- Rent growth +2.5/5.0
- Condition / age +2.5/5.0
- Appreciation +0.0/10.0
$165,000
🖨 Deal sheet 📄 Offer letter ✓ Due diligence
Listing remarks MLS
TWO EXTRA LOTS INCLUDED #9 AND #11, ZONED "2 RA" WITH HOUSE ON #13. 1ST FLR LAUNDRY, COULD BE CONVERTED BACK INTO 3 BR. NEEDS TLC, BUT IT'S A NICE STREET, 2 BR OR 3 BR. Good Condition
Key facts
- Two additional lots
- Urban oasis
- Custom plaster work
Tags
Property features AI
Exterior
- Parking: Five parking spaces total; Off-street parking via driveway
- Security: Smoke detectors; Carbon monoxide detectors
- Utilities: 150-amp electric service; Public water; Public sewer; Cable available
- Home design: Single-family residence; Fixer condition
- Construction: Stucco exterior; Block foundation; Asphalt roof; Living area approximately 1,334
- Exterior features: Side porch that is covered and enclosed; Outdoor lighting; Shed(s); Partial chain-link fencing; Level lot
Interior
- Kitchen: Dishwasher; Gas oven; Microwave; Refrigerator
- Bedrooms: Two bedrooms on the second level
- Flooring: Vinyl flooring; Hardwood flooring
- Bathrooms: One full bathroom on the first level
- Heating & cooling: Hot water heating (natural gas); Window air conditioning units
- Interior features: High-speed internet available; Built-in features; Screens and blinds on windows
- Laundry & utility: Main-level laundry; Basement with interior entry and Bilco doors
Neighborhood map
What this means for you Summary
Snapshot
- This is a 2-bed/1.0-bath single-family listed at $165k.
Deal economics
- At list price, monthly cash flow is $226 ($3k/yr) — positive.
- The deal already cash-flows at list — no discount required.
- Meets the 1% rule at list price ($2k rent vs $165k).
- Cap rate 7.9% vs local median 5.7% in Albany — top-decile yield for the area; either an underpriced asset or a hidden risk that comps aren't pricing in. Stress-test before assuming the spread holds.
Location & tenants
- Location reads 79/100 on livability (#129 in NY, #2,083 nationally) — a middle-class / working-renter tenant base. Strengths: amenities A+, commute A+, housing A+; Watch: employment C-, crime F.
- Albany City School District (urban): math 37% / reading 40% proficiency, ranked #543 of 590 in NY (top 92%) — families likely to look elsewhere, expect single-tenant / working-renter base with shorter leases; 66% free/reduced lunch — lower-income household profile, screen leases tightly.
- Zoned schools: Delaware Community School (math 12% / reading 22%, grade F, #2,011 of 2,108 statewide, top 96%, 290 students, 81% FRL); Albany High School (math 74% / reading 67%, grade B+, #710 of 1,100 statewide, top 65%, 2,676 students, 69% FRL).
- Market conditions: 47 active listings in the ZIP; 40 comparable units currently listed for rent nearby; rentals lingering (median 44d on market — plan ~5-8 weeks vacancy on turnover, expect pricing pressure); 52% of comp listings sitting > 30 days — soft ceiling on asking rent; 675 units permitted in Albany County in 2024 (451 in 5+ unit buildings).
Forward outlook
- Local home prices are declining (-3.0%/yr); year-one equity from $1k of loan paydown is wiped out by about $5k of value loss. Plan a longer hold.
- Albany County population projected at +9% by 2050 — modest demand growth; plan on rents tracking national, not racing it.
Negotiation context
- Only 3 days on market — expect competitive offers; lowballing is unlikely to land.
- 2 sale attempts since 20y ago with the ask held roughly flat each time — persistent listings suggest the price (not the market) is what's stuck; bring a comps-based counter.
- Current owner paid $58k; list at $165k implies a 184% gain — meaningful room to come down on a strong offer.
Risks & watch-outs
- Watch-outs: built in 1901 — expect roof / HVAC / electrical / plumbing capex.
Questions for the listing agent
- Built in 1901 — when were the roof, HVAC, electrical panel, plumbing, and water heater last replaced?
- Is there a deadline driving the sale (1031 exchange, divorce, estate, relocation)? That informs how much negotiation room exists.
- Crime grade is F in this area — have there been break-ins, vandalism, or insurance claims at this property in the last 3 years? What carrier currently insures it and at what premium?
- What's the average days-on-market for RENTAL listings here right now (not sales)? A rising rental-DOM trend means longer vacancies and softer asking-rent achievability than the comps imply.
- What's the recent tenant-quality profile in this submarket — average credit score on applications, eviction rate, late-payment / NSF rate, and stable-employment percentage? A property-management company in the area should have these aggregated.
- How much new for-sale + rental construction is in the pipeline within 1–3 miles? Heavy new supply typically softens prices + rents 12–24 months out; constrained supply supports both.
Investment metrics
- 1% rule
- 1.13% ✓
- Cap rate
- 7.94%
- Cash-on-cash
- 5.86%
- DSCR
- 1.26
- GRM
- 7.4
CMA / ARV
- ARV (on-the-fly)
- $212,106
- Comps found
- 12
Show comp detail 12 sales within ~0.75 mi
| Address | Dist | Beds/Ba | Sqft | Sold | Price | $/sf | Match |
|---|---|---|---|---|---|---|---|
| 2 Sand St | 0.03mi | 3/1.0 (+1) | 1,252 (-6%) | 0mo | $165,000 | $132 | 83 |
| 1A Providence Pl | 0.52mi | 3/1.0 (+1) | 1,360 (+2%) | 6mo | $225,000 | $165 | 62 |
| 23 Barrows St | 0.51mi | 3/1.5 (+1) | 1,312 (-2%) | 6mo | $198,000 | $151 | 62 |
| 1 S Marshall St | 0.39mi | 3/2.0 (+1) | 1,399 (+5%) | 7mo | $210,000 | $150 | 59 |
| 79 Broad St | 0.69mi | 3/1.0 (+1) | 1,364 (+2%) | 2mo | $147,000 | $108 | 57 |
| 167 Southern Blvd | 0.52mi | 3/2.0 (+1) | 1,277 (-4%) | 3mo | $225,000 | $176 | 57 |
| 19 W Van Vechten St | 0.21mi | 3/1.5 (+1) | 1,145 (-14%) | 4mo | $215,000 | $188 | 56 |
| 317 Mountain St | 0.52mi | 3/1.0 (+1) | 1,240 (-7%) | 6mo | $230,000 | $185 | 54 |
| 37 Sloan St | 0.41mi | 3/1.0 (+1) | 1,200 (-10%) | 6mo | $152,900 | $127 | 54 |
| 24 Sparkill Ave | 0.70mi | 3/1.5 (+1) | 1,351 (+1%) | 6mo | $170,000 | $126 | 53 |
| 310 Mccarty Ave | 0.46mi | 2/1.5 | 1,154 (-14%) | 4mo | $184,000 | $159 | 50 |
| 415 Second Ave | 0.55mi | 3/1.5 (+1) | 1,168 (-12%) | 1mo | $209,000 | $179 | 46 |
Match score weights: distance 35% · size 25% · config 20% · recency 20%. Top-matched comps best support the ARV.
Projected returns pro-forma
-3.0% appreciation · 3.0% rent growth · sell at horizon
- IRR
- -7.2%
- Equity multiple
- 0.73×
- Total profit
- $-12,267
- Equity at exit
- $24,602
- IRR
- 2.5%
- Equity multiple
- 1.18×
- Total profit
- $8,202
- Equity at exit
- $14,266
Cash invested: $46,200 (down + closing). Projections, not guarantees.
Landlord ↔ Tenant lean methodology
- Overall (STATE)
- 15 Strongly Tenant-Friendly
- State New York
- 15 Strongly Tenant-Friendly · D+10
- County
- — inherits STATE
- City
- — inherits STATE
ZIP-level market 12209
- Home prices YoY
- -7.3%
- Active inventory
- 47
- Price-to-rent
- 7.4×
Monthly cashflow live
- Estimated rent
- $1,857 high interval (Pro) →
- Mortgage (P&I)
- −$865
- Tax from tax record
- −$307 /mo · $3,687/yr
- Insurance
- −$69
- HOA
- −$0
- Vacancy / Maint / Mgmt
- −$390
- Net cashflow
- $226
Break-even live
UW: 25.0% down · 7.5% · 30yr · 1.5% tax · 5.0% vac · 8.0% maint · 8.0% mgmt
Financing live
Cash to close
- Down payment
- $41,250
- Closing costs
- $4,950
- Reserves months
- —
- Total cash needed
- —
Loan-product check · same deal, 3 products live
Conventional
25% down · 7.5% · 30yr
- Down + closing
- —
- Monthly P&I
- —
- Monthly cashflow
- —
- DSCR
- —
- Eligible?
- —
Personal DTI + credit; lowest rate.
DSCR
20% down · 8.5% · 30yr
- Down + closing
- —
- Monthly P&I
- —
- Monthly cashflow
- —
- DSCR
- —
- Eligible?
- —
No personal income docs; deal must DSCR.
Hard money
10% down · 12.0% · 12mo
- Down + closing
- —
- Monthly P&I
- —
- Monthly cashflow
- —
- DSCR
- —
- Eligible?
- —
Short-term bridge; refi at stabilization.
Rent comps 40 comps
| Address | Beds | Baths | Sqft | Rent | $/sqft | DOM | Units | Dist |
|---|---|---|---|---|---|---|---|---|
| 22 Hurlbut St Albany, NY | 3.0 | 1.0 | 1209 | $2,050 | $1.70 | 43d | 1 | 0.31mi |
| 43 Second Ave Albany, NY | 1.0 | 1.0 | 900 | $1,500 | $1.67 | 43d | 1 | 0.52mi |
| 98 Mount Hope Dr Albany, NY | 2.0 | 1.5 | 1200 | $2,000 | $1.67 | 14d | 1 | 0.60mi |
| 86 Hackett Blvd Albany, NY | 2.0 | 1.0 | 1100 | $1,900 | $1.73 | 23d | 1 | 0.60mi |
| 201 Park Ave Unit 10 Albany, NY | 3.0 | 2.0 | 1600 | $2,100 | $1.31 | 43d | 1 | 0.63mi |
| 502 Second Ave #3 Albany, NY | 3.0 | 1.0 | 1100 | $1,800 | $1.64 | 43d | 1 | 0.64mi |
| 50 Southern Blvd Albany, NY | 3.0 | 1.0 | 1200 | $1,650 | $1.38 | 14d | 1 | 0.67mi |
| 4 Irving St Unit 2nd Floor Albany, NY | 3.0 | 1.0 | 1000 | $1,695 | $1.70 | 43d | 1 | 0.70mi |
| 25 Bleecker Pl #1 Albany, NY | 2.0 | 1.0 | 1150 | $1,350 | $1.17 | 44d | 1 | 0.74mi |
| 119 Grand St Albany, NY | 3.0 | 1.0 | 1600 | $1,300 | $0.81 | 43d | 1 | 0.79mi |
| 125 Jefferson St Unit 2 Albany, NY | 1.0 | 1.0 | 1000 | $2,045 | $2.04 | 14d | 1 | 0.79mi |
| 346 Madison Ave Unit 3 Albany, NY | 3.0 | 2.0 | 1110 | $2,725 | $2.45 | 43d | 1 | 0.82mi |
| 346 Madison Ave Albany, NY | 3.0 | 2.0 | 1500 | $2,495 | $1.66 | 23d | 1 | 0.82mi |
| 364 Madison Ave Albany, NY | 2.0 | 2.0 | 1150 | $1,850 | $1.61 | 21d | 1 | 0.82mi |
| 341 Madison Ave Albany, NY | 2.0 | 1.0 | 1000 | $1,800 | $1.80 | 14d | 1 | 0.84mi |
| 357 Madison Ave Unit Basement Albany, NY | 1.0 | 1.0 | 900 | $1,550 | $1.72 | 14d | 1 | 0.85mi |
| 164 Madison Ave Albany, NY | 2.0 | 1.0 | 1200 | $1,500 | $1.25 | 43d | 1 | 0.86mi |
| 409 Madison Ave Albany, NY | 2.0 | 2.0 | 1050 | $2,094 | $1.99 | 23d | 1 | 0.88mi |
| 168 S Pearl St Albany, NY | 3.0 | 1.5 | 1044 | $1,800 | $1.72 | 23d | 1 | 0.90mi |
| 366 Hamilton St #2 Albany, NY | 1.0 | 1.0 | 1400 | $1,800 | $1.29 | 14d | 1 | 0.91mi |
| 292 Lark St Albany, NY | 2.0 | 1.0 | 1100 | $1,500 | $1.36 | 43d | 1 | 0.92mi |
| 151 S Pearl St Albany, NY | 2.0 | 1.0 | 1000 | $1,600 | $1.60 | 14d | 1 | 0.93mi |
| 135 Madison Ave Unit 2 Albany, NY | 2.0 | 1.0 | 1000 | $1,400 | $1.40 | 43d | 1 | 0.93mi |
| 88 Willett St Albany, NY | 3.0 | 1.0 | 825 | $1,802 | $2.18 | 14d | 10 | 0.96mi |
| 520 Madison Ave Unit 1 Albany, NY | 3.0 | 1.0 | 1080 | $1,700 | $1.57 | 43d | 1 | 0.97mi |
| 149 Jay St Albany, NY | 2.0 | 1.0 | 1000 | $1,750 | $1.75 | 43d | 1 | 1.00mi |
| 154 Lancaster St Unit 1 Albany, NY | 2.0 | 1.5 | 1500 | $2,200 | $1.47 | 23d | 1 | 1.02mi |
| 227 Jay St Albany, NY | 2.0 | 2.0 | 1710 | $2,150 | $1.26 | 43d | 1 | 1.04mi |
| 290 State St #1 Albany, NY | 1.0 | 1.0 | 1000 | $1,600 | $1.60 | 43d | 1 | 1.11mi |
| 326 State St Albany, NY | 1.0 | 1.0 | 1000 | $1,600 | $1.60 | 43d | 1 | 1.14mi |
| 352 State St Albany, NY | 2.0 | 2.0 | 1143 | $2,500 | $2.19 | 23d | 1 | 1.15mi |
| 21 Woodlawn Ave Unit 3RDFL Albany, NY | 3.0 | 1.0 | 1300 | $1,500 | $1.15 | 43d | 1 | 1.16mi |
| 21 Woodlawn Ave Unit 3rd floor Albany, NY | 3.0 | 1.0 | 1300 | $1,500 | $1.15 | 23d | 1 | 1.16mi |
| 138 Washington Ave Albany, NY | 1.0 | 1.0 | 900 | $1,800 | $2.00 | 43d | 1 | 1.17mi |
| 546 Mercer St Unit 1 Albany, NY | 3.0 | 1.0 | 1400 | $1,800 | $1.29 | 23d | 1 | 1.18mi |
| 42 Harris Ave Unit 2 Albany, NY | 2.0 | 1.0 | 1000 | $1,600 | $1.60 | 14d | 1 | 1.19mi |
| 199 Lark St Albany, NY | 3.0 | 1.0 | 1000 | $1,800 | $1.80 | 43d | 1 | 1.19mi |
| 240 Washington Ave Albany, NY | 2.0 | 2.0 | 1560 | $2,450 | $1.57 | 43d | 1 | 1.25mi |
| 31 N Pearl St Albany, NY | 1.0 | 1.0 | 1000 | $1,150 | $1.15 | 43d | 1 | 1.27mi |
| 48 N Pearl St Albany, NY | 2.0 | 1.0–2.5 | 1251 | $3,500 | $2.80 | 14d | 17 | 1.29mi |
Listing history 4 events
-
2026-06-18days on market $165,000 Active 3 DOM
-
2026-06-17days on market $165,000 Active 2 DOM
-
2026-06-15remarks 699-char remark
-
2026-06-15$165,000 Active 1 DOM
ⓘ Source: listings_history table (triggers on properties + properties_extension) + one-shot
backfill from property_details.listing_events for pre-trigger history.
Tax reassessment forecast NY · Partial reset (capped growth)
- Current annual tax
- $3,687 · $307/mo
- Projected year-2 tax
- $3,687 · $307/mo
- Expected delta
- $0/yr ($0/mo · 0.0%)
ⓘ Screening estimate from a state-policy table — verify with the county assessor before closing.
Climate risk First Street
- Flood 1/10 Low FEMA zone X (unshaded) · 0% chance over 30 yrs
- Wildfire 3/10 Moderate
- Heat 4/10 Moderate 7 d/yr ≥99°F today · 16 d/yr by 30 yrs out
- Wind 3/10 Moderate 7% chance of damaging wind over 30 yrs
- Air quality 1/10 Low 0 unhealthy d/yr today · 0 by 30 yrs out
Nearby sold comps map
Loading sold comps map…
Walkable amenities ~0.75 mi
Loading nearby amenities…
Taxation est. · year 1
- Rental income
- $22,284
- − Mortgage interest
- −$9,243
- − Property taxes
- −$3,687
- − Insurance
- −$825
- − Repairs & maintenance
- −$1,783
- − Management
- −$1,783
- − Depreciation
- −$4,800
- Taxable income
- $164
- Est. tax owed @ 24.0%
- −$39
- After-tax cash flow
- $2,670/yr
For passive investors: Depreciation is non-cash, so a rental often shows a tax loss while cash-flowing — sheltering income. Rental losses are passive: they offset passive income freely, and up to $25,000/yr can offset ordinary (W-2) income if you actively participate and your MAGI is under $100k (phasing out to $0 by $150k); unused losses carry forward. On sale, claimed depreciation is recaptured at up to 25%, and gains may owe capital-gains tax (a 1031 exchange can defer both). Figures are a year-1 estimate at your 24.0% rate — not tax advice; consult a CPA.
Schools (NCES district)
- District
- Albany City School District
- NCES district ID
- 3602460
- Math proficiency
- 37% ▲ 6.00%
- Reading proficiency
- 40% ▲ 7.00%
- Median HH income
- $40,568
- Composite
- 32.34/100
- National rank
- #5744
- State rank
- #543 of 590 in NY
Livability — Albany
- Score
- 79/100
- State rank
- #129
- US rank
- #2083
Category grades
Schools grade is shown separately in the Schools card above.
Census & demographics
- Census place
- Albany, NY
- City population
- 116,921
- Population (ZIP)
- 10,754
Population outlook (Albany County) Hauer SSP2
- Today (2025)
- 320,794 people
- By 2030
- 327,401 · +2.1%
- By 2040
- 338,218 · +5.4%
- By 2050
- 348,467 · +8.6%
- By 2075
- 381,693 · +19.0%
- By 2100
- 393,809 · +22.8%
Race, ethnicity, and origin ACS 2023
- Neighborhood character
- Diverse neighborhood (Simpson 0.69)
- Race & ethnicity
- White 46% Black 23% Hispanic / Latino 19% Asian 8% Two or more races 7%
- Hispanic origin (detail)
- Puerto Rican 6%
- Common ancestry
- Romanian 4% Lithuanian 3% Serbian 1%
- Foreign-born
- 18% · Canada, Philippines, South Korea
- Languages at home
- 77% English-only · Spanish 13% Other Asian/Pacific 3% Tagalog/Filipino 1%
Political lean MEDSL · Albany
- 2024 margin
- Strong D (+25.8) · D 62.9% · R 37.1%
- 2008→2024 swing
- -3.6pp toward R · 2008: 29.4pp · 2024: 25.8pp
- All cycles
- 2024: D+25.8 2020: D+31.4 2016: D+24.3 2012: D+31.0 2008: D+29.4
Not yet ingested
- Civics
- —
Market trends
- HPI YoY
- ▼ -24.91%
- Current HPI
- 318.0191
- Rent YoY
- —
- Metro
- —
- State GDP YoY
- ▲ 2.60%
- F500 in state
- 92
Industry mix (Fortune 500 HQ in NY)
| Industry | F500 HQs | Revenue |
|---|---|---|
| Financial Services | 10 | $950B |
|
||
| Consumer Goods | 9 | $162B |
|
||
| Insurance | 4 | $225B |
|
||
| Telecommunications | 2 | $144B |
|
||
| Pharmaceuticals | 2 | $112B |
|
||
| Media / Entertainment | 2 | $69B |
|
||
Price history
+164.0% since first listed4 events — show timeline
- 2026-06-15 Listed $165,000 Global MLS
- 2006-08-04 Sold (MLS) $58,000 Global MLS
- 2006-05-12 Listing Removed — Global MLS
- 2006-02-24 Listed $62,500 Global MLS
Property tax history
+8.9%/yrLatest (2025): $3,687 · -9.4% YoY. Source: county tax records.
Cash-flow waterfall
monthlySold comps — $/sqft
last 12 mo · ≤1 miLoading sold comps…