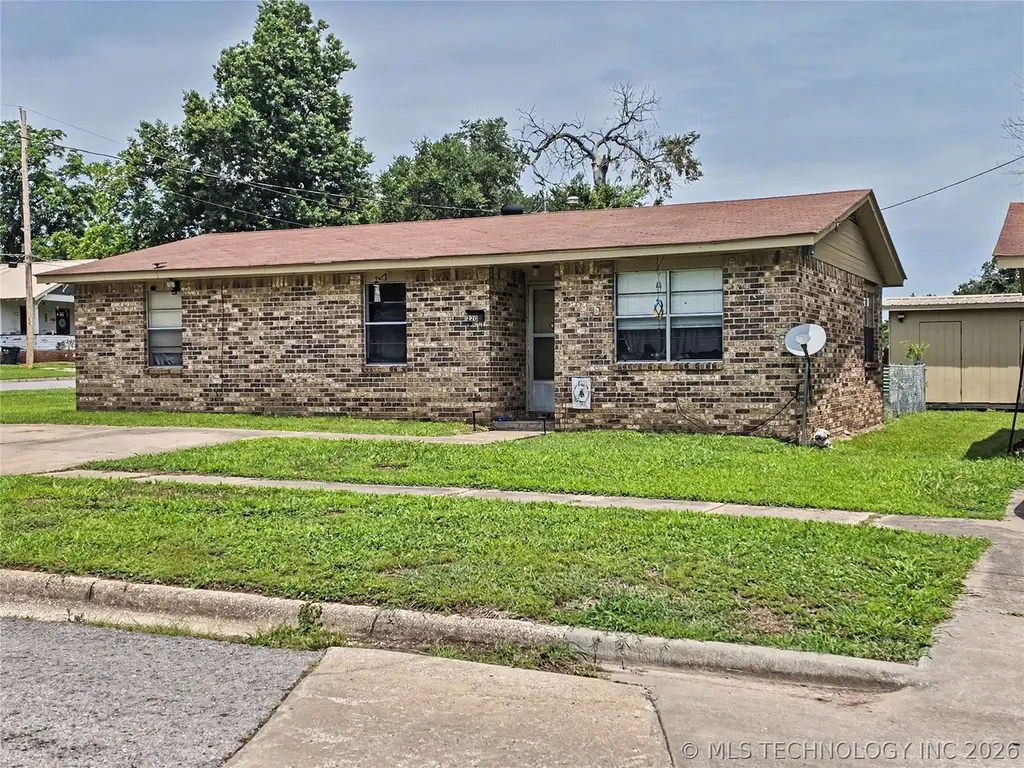
220 W Ross St · Tahlequah, OK
Flood risk No data
- FEMA flood zone
- —
- Chance of flooding over 30 yrs
- —
- Est. flood insurance / yr
- —
Fire risk No data
- Est. fire insurance / yr
- —
Heat risk No data
- Hot days now (above threshold)
- —
- Hot days in 30 yrs
- —
Wind risk No data
- Chance of severe wind over 30 yrs
- —
Air-quality risk No data
- Unhealthy air days now
- —
- Unhealthy air days in 30 yrs
- —
Risk factors via First Street. Map © Google.
Why this score? — see what drove the D grade
The composite is a weighted blend of 9 inputs, each scored 0–100. Each bar is that input's sub-score; the figure is the points it added to the 100-point composite (weight × sub-score).
- Cash flow +13.4/30.0
- ARV discount +11.0/15.0
- Rent growth +4.8/5.0
- DSCR +4.0/10.0
- 1% rule +3.8/10.0
- Livability +3.3/5.0
- Condition / age +2.2/5.0
- Schools +2.1/10.0
- Appreciation +0.0/10.0
$149,900
🖨 Deal sheet (PDF) 📄 Offer letter ✓ Due diligence
Listing remarks
Great Location. 3 bedroom, 1 bath brick home on a corner lot. Central heat and air. Won't last long!
Key facts
- Central heat and air
- Corner lot
- 6,344 sq ft lot
Tags
Property features AI
Exterior
- Parking: Concrete driveway
- Security: Smoke detector(s); No safety shelter
- Utilities: Cable available; Electricity available; Natural gas available; Phone available; Public water; Public sewer
- Home design: Single-story; Faces south; Slab foundation
- Construction: Built with brick, brick veneer and wood frame; Asphalt and fiberglass roof
- Exterior features: Concrete driveway; Patio; Corner lot
Interior
- Kitchen: Oven; Range; Stove; Refrigerator
- Flooring: Carpet; Vinyl
- Bathrooms: 1 full bathroom
- Heating & cooling: Central heating (gas); Central air conditioning
- Interior features: Aluminum window frames; Insulated doors; Laminate counters; Electric range connection; Carpet flooring; Vinyl flooring
- Laundry & utility: Washer hookup; Electric dryer hookup; Gas water heater
Neighborhood map
What this means for you Summary
Snapshot
- This is a 3-bed/1.0-bath single-family listed at $150k. Condition is rated fair.
Deal economics
- At list price, monthly cash flow is $3 ($31/yr) — positive.
- The deal already cash-flows at list — no discount required.
- To meet the 1% rule (rent ≥ 1% of price), the offer needs to be $131k (12.3% below list).
- Recommended offer: $131k (12.3% below list) — sets the bar for 1% rule.
- Cap rate 6.3% vs local median 4.3% in Tahlequah — top-decile yield for the area; either an underpriced asset or a hidden risk that comps aren't pricing in. Stress-test before assuming the spread holds.
Location & tenants
- Location reads 66/100 on livability (#124 in OK) — a middle-class / working-renter tenant base. Strengths: cost of living A+, housing A; Watch: amenities D, commute F, employment F.
- Tahlequah (town): math 27% / reading 25% proficiency, ranked #109 of 270 in OK (top 40%) — low school quality limits family demand, transient renter base, plan for 1-2y turnover; 64% free/reduced lunch — lower-income household profile, screen leases tightly.
- Zoned schools: Greenwood Es (math 26% / reading 21%, grade F, #407 of 845 statewide, top 48%, 503 students, 0% FRL); Tahlequah Ms (math 28% / reading 25%, grade F, #77 of 345 statewide, top 22%, 676 students, 0% FRL); Tahlequah Hs (math 23% / reading 33%, grade F, #122 of 447 statewide, top 27%, 1,300 students, 0% FRL) — zoned schools average 0% FRL vs 64% district-wide (64 pts lower); this property's tenant base skews higher-income than the district average.
- Market conditions: Rents rising fast (+9.2%/yr); 369 active listings in the ZIP; 48 units permitted in Cherokee County in 2024 (0 in 5+ unit buildings).
- This rent runs 31% of the median local income ($51k/yr) — at the standard rent-burdened threshold; future hikes will face affordability resistance.
Forward outlook
- Local home prices are declining (-3.0%/yr); year-one equity from $1k of loan paydown is wiped out by about $4k of value loss. Plan a longer hold.
- Cherokee County population projected at +15% by 2050 — modest demand growth; plan on rents tracking national, not racing it.
Negotiation context
- It's been on market 19 days — a 2% lower offer ($148k) is reasonable based on typical stale-listing flexibility.
- 2 sale attempts with the ask held roughly flat each time — persistent listings suggest the price (not the market) is what's stuck; bring a comps-based counter.
Questions for the listing agent
- Have any recent inspections been done? Can we get a copy of the seller's disclosures and any deferred-maintenance estimates?
- Is there a deadline driving the sale (1031 exchange, divorce, estate, relocation)? That informs how much negotiation room exists.
- Schools are D-rated, which usually means shorter tenancies and higher turnover. Who's the typical renter profile here, and what's been the actual vacancy rate?
- The area grade is low — what's the realistic commute time and amenity access for the typical tenant pool here? Any planned neighborhood developments (good or bad) we should know about?
- What's the average days-on-market for RENTAL listings here right now (not sales)? A rising rental-DOM trend means longer vacancies and softer asking-rent achievability than the comps imply.
- What's the recent tenant-quality profile in this submarket — average credit score on applications, eviction rate, late-payment / NSF rate, and stable-employment percentage? A property-management company in the area should have these aggregated.
- How much new for-sale + rental construction is in the pipeline within 1–3 miles? Heavy new supply typically softens prices + rents 12–24 months out; constrained supply supports both.
Investment metrics
- 1% rule
- 0.88% ✗
- Cap rate
- 6.31%
- Cash-on-cash
- 0.07%
- DSCR
- 1.00
- GRM
- 9.5
CMA / ARV
- ARV (on-the-fly)
- $162,690
- Comps found
- 12
Show comp detail 12 sales within ~0.75 mi
| Address | Dist | Beds/Ba | Sqft | Sold | Price | $/sf | Match |
|---|---|---|---|---|---|---|---|
| 325 W Chickasaw St | 0.14mi | 3/1.0 | 1,172 (+4%) | 0mo | $140,000 | $119 | 86 |
| 702 S College | 0.22mi | 2/1.0 (-1) | 1,120 (-0%) | 4mo | $70,000 | $63 | 81 |
| 510 S Cherokee Ave | 0.07mi | 2/1.0 (-1) | 1,064 (-5%) | 6mo | $164,000 | $154 | 78 |
| 757 Bluff St | 0.37mi | 3/1.0 | 1,103 (-2%) | 6mo | $144,000 | $131 | 75 |
| 708 S Cherokee Ave | 0.26mi | 3/1.5 | 1,112 (-1%) | 13mo | $171,000 | $154 | 73 |
| 813 W Choctaw St | 0.52mi | 3/1.0 | 1,104 (-2%) | 5mo | $120,000 | $109 | 68 |
| 504 S College Ave | 0.06mi | 2/1.0 (-1) | 973 (-13%) | 14mo | $160,100 | $165 | 58 |
| 411 S Lee Ave | 0.24mi | 2/2.0 (-1) | 961 (-14%) | 0mo | $172,000 | $179 | 56 |
| 602 N Jones Ave | 0.71mi | 3/2.0 | 1,080 (-4%) | 1mo | $175,000 | $162 | 56 |
| 1009 Hillcrest Ave | 0.71mi | 3/1.0 | 1,172 (+4%) | 8mo | $170,000 | $145 | 53 |
| 902 S Owens Ave | 0.54mi | 3/2.0 | 1,236 (+10%) | 5mo | $175,000 | $142 | 50 |
| 215 E Fuller St | 0.60mi | 2/1.0 (-1) | 1,007 (-10%) | 3mo | $146,500 | $145 | 48 |
Match score weights: distance 35% · size 25% · config 20% · recency 20%. Top-matched comps best support the ARV.
Projected returns pro-forma
-3.0% appreciation · 8.0% rent growth · sell at horizon
- IRR
- -10.7%
- Equity multiple
- 0.59×
- Total profit
- $-17,160
- Equity at exit
- $22,351
- IRR
- 4.5%
- Equity multiple
- 1.40×
- Total profit
- $16,967
- Equity at exit
- $12,961
Cash invested: $41,972 (down + closing). Projections, not guarantees.
Landlord ↔ Tenant lean methodology
- Overall (STATE)
- 83 Strongly Landlord-Friendly
- State Oklahoma
- 83 Strongly Landlord-Friendly · R+20
- County
- — inherits STATE
- City
- — inherits STATE
ZIP-level market 74464
- Rents YoY
- 9.2%
- Active inventory
- 369
- Price-to-rent
- 9.5×
Monthly cashflow live
- Estimated rent
- $1,315 medium interval (Pro) →
- Mortgage (P&I)
- −$786
- Tax est. 1.5%
- −$187 /mo · $2,248/yr
- Insurance
- −$62
- HOA
- −$0
- Vacancy / Maint / Mgmt
- −$276
- Net cashflow
- $3
Break-even live
Sensitivity live
| Price | -10% $106 | -5% $54 | +0% $3 | +5% $-49 | +10% $-101 |
|---|---|---|---|---|---|
| Rent | -10% $-101 | -5% $-49 | +0% $3 | +5% $54 | +10% $106 |
| Rate | -1.0pp $78 | -0.5pp $41 | base $3 | +0.5pp $-36 | +1.0pp $-76 |
UW: 25.0% down · 7.5% · 30yr · 1.5% tax · 5.0% vac · 8.0% maint · 8.0% mgmt
Financing live
Cash to close
- Down payment
- $37,475
- Closing costs
- $4,497
- Reserves months
- —
- Total cash needed
- —
Loan-product check · same deal, 3 products live
Conventional
25% down · 7.5% · 30yr
- Down + closing
- —
- Monthly P&I
- —
- Monthly cashflow
- —
- DSCR
- —
- Eligible?
- —
Personal DTI + credit; lowest rate.
DSCR
20% down · 8.5% · 30yr
- Down + closing
- —
- Monthly P&I
- —
- Monthly cashflow
- —
- DSCR
- —
- Eligible?
- —
No personal income docs; deal must DSCR.
Hard money
10% down · 12.0% · 12mo
- Down + closing
- —
- Monthly P&I
- —
- Monthly cashflow
- —
- DSCR
- —
- Eligible?
- —
Short-term bridge; refi at stabilization.
Listing history 13 events
-
2026-06-22days on market $149,900 Active 19 DOM
-
2026-06-19days on market $149,900 Active 16 DOM
-
2026-06-18days on market $149,900 Active 15 DOM
-
2026-06-17days on market $149,900 Active 14 DOM
-
2026-06-16days on market $149,900 Active 13 DOM
-
2026-06-15days on market $149,900 Active 12 DOM
-
2026-06-14days on market $149,900 Active 10 DOM
-
2026-06-12days on market $149,900 Active 9 DOM
-
2026-06-09days on market $149,900 Active 6 DOM
-
2026-06-08days on market $149,900 Active 5 DOM
-
2026-06-07days on market $149,900 Active 4 DOM
-
2026-06-05remarks 100-char remark
-
2026-06-05$149,900 Active 1 DOM
ⓘ Source: listings_history table (triggers on properties + properties_extension) + one-shot
backfill from property_details.listing_events for pre-trigger history.
Nearby sold comps map
Loading sold comps map…
Walkable amenities ~0.75 mi
Loading nearby amenities…
Taxation est. · year 1
- Rental income
- $15,774
- − Mortgage interest
- −$8,397
- − Property taxes
- −$2,248
- − Insurance
- −$750
- − Repairs & maintenance
- −$1,262
- − Management
- −$1,262
- − Depreciation
- −$4,361
- Taxable loss
- −$2,505
- Est. tax savings @ 24.0%
- +$601
- After-tax cash flow
- $632/yr
For passive investors: Depreciation is non-cash, so a rental often shows a tax loss while cash-flowing — sheltering income. Rental losses are passive: they offset passive income freely, and up to $25,000/yr can offset ordinary (W-2) income if you actively participate and your MAGI is under $100k (phasing out to $0 by $150k); unused losses carry forward. On sale, claimed depreciation is recaptured at up to 25%, and gains may owe capital-gains tax (a 1031 exchange can defer both). Figures are a year-1 estimate at your 24.0% rate — not tax advice; consult a CPA.
Condition & rehab AI · 9 photos
The home requires moderate repairs and maintenance, including landscaping, driveway repair, and exterior painting. These updates would significantly enhance its curb appeal and property value.
Repairs flagged
- Major Driveway — Cracks in concrete
- Major Landscaping — Overgrown and unkempt
- Moderate Exterior paint — Weathered brick
Value-add opportunities
- Both Landscaping — Enhances curb appeal and property value
- Both Driveway repair — Improves curb appeal and functionality
- Both Exterior painting — Enhances curb appeal and property value
Renovation cost estimate screening
| Repair item | Severity | Est. cost |
|---|---|---|
| Driveway · Cracks in concrete | Major | $15,000–50,000 |
| Landscaping · Overgrown and unkempt | Major | $15,000–50,000 |
| Exterior paint · Weathered brick | Moderate | $3,000–15,000 |
| Total estimated repair cost · 3 items | $33,000–115,000 |
Value-add ROI direction
- Both Landscaping — Enhances curb appeal and property value ↑
- Both Driveway repair — Improves curb appeal and functionality ↑
- Both Exterior painting — Enhances curb appeal and property value ↑
ⓘ Cost ranges are severity-bucket heuristics (US national rule-of-thumb). Get contractor quotes + a written scope before underwriting a rehab budget.
Schools (NCES district)
- District
- Tahlequah
- NCES district ID
- 4029380
- Math proficiency
- 27% ▼ -14.00%
- Reading proficiency
- 25% ▼ -11.00%
- Median HH income
- $32,990
- Composite
- 21.28/100
- National rank
- #8393
- State rank
- #109 of 270 in OK
Livability — Tahlequah
- Score
- 66/100
- State rank
- #124
- US rank
- #12171
Category grades
Schools grade is shown separately in the Schools card above.
Census & demographics
- Census place
- Tahlequah, OK
- County
- Cherokee County · 31,116 people
- City population
- 31,116
- Metro
- Tahlequah, OK
- Population (ZIP)
- 31,116
- Household income
- $51,262
- Rent vs Own
- Severe rent burden
- 1058.0
Population outlook (Cherokee County) Hauer SSP2
- Today (2025)
- 51,747 people
- By 2030
- 53,481 · +3.4%
- By 2040
- 56,503 · +9.2%
- By 2050
- 59,370 · +14.7%
- By 2075
- 67,178 · +29.8%
- By 2100
- 70,900 · +37.0%
Race, ethnicity, and origin ACS 2023
- Neighborhood character
- Highly diverse neighborhood (Simpson 0.82)
- Race & ethnicity
- White 41% Native American 35% Two or more races 16% Hispanic / Latino 10% Black 2%
- Hispanic origin (detail)
- Mexican 8%
- Common ancestry
- Italian 2% Slovak 2% Lithuanian 1%
- Foreign-born
- 4% · Canada
- Languages at home
- 90% English-only · Spanish 6%
Political lean MEDSL · Cherokee
- 2024 margin
- Solid R (+32.6) · D 32.7% · R 65.3% · Other 2.0%
- 2008→2024 swing
- -20.4pp toward R · 2008: -12.2pp · 2024: -32.6pp
- All cycles
- 2024: R+32.6 2020: R+29.3 2016: R+27.5 2012: R+14.1 2008: R+12.2
Not yet ingested
- Civics
- —
Market trends
- HPI YoY
- ▼ -184.14%
- Current HPI
- 226.4004
- Rent YoY
- ▲ 9.23%
- Metro
- Tahlequah, OK
- State GDP YoY
- ▲ 1.55%
- F500 in state
- 6
Industry mix (Fortune 500 HQ in OK)
| Industry | F500 HQs | Revenue |
|---|---|---|
| Energy | 3 | $48B |
|
||
Price history
3 events — show timeline
- 2026-06-03 Relisted — MLS Technology, Inc.
- 2026-06-02 Listing Removed — MLS Technology, Inc.
- 2026-06-01 Listed $149,900 MLS Technology, Inc.
Cash-flow waterfall
monthlySold comps — $/sqft
last 12 mo · ≤1 miLoading sold comps…