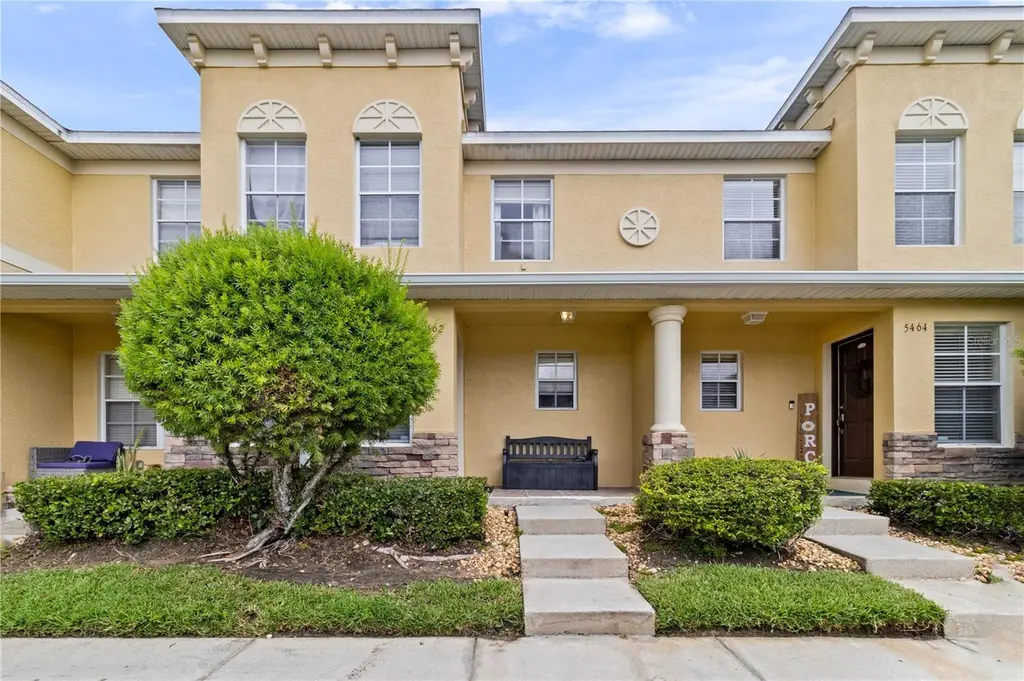
5462 Quarry Rock Rd · Lakeland, FL
Flood risk 1/10 · Minimal
- FEMA flood zone
- X (unshaded)
- Chance of flooding over 30 yrs
- 0.0%
- Est. flood insurance / yr
- $507 – $1,088
Fire risk 4/10 · Minor
- Est. fire insurance / yr
- $947 – $1,759
Heat risk 9/10 · Severe
- Hot days now (above 108°F)
- 7 days/yr
- Hot days in 30 yrs
- 25 days/yr
Wind risk 9/10 · Severe
- Chance of severe wind over 30 yrs
- 99.0%
Air-quality risk 2/10 · Minimal
- Unhealthy air days now
- 1 days/yr
- Unhealthy air days in 30 yrs
- 2 days/yr
Risk factors via First Street. Map © Google.
Why this score? — see what drove the D- grade
The composite is a weighted blend of 9 inputs, each scored 0–100. Each bar is that input's sub-score; the figure is the points it added to the 100-point composite (weight × sub-score).
- Cash flow +11.5/30.0
- ARV discount +7.5/15.0
- 1% rule +5.0/10.0
- Livability +3.9/5.0
- Schools +3.5/10.0
- DSCR +3.4/10.0
- Rent growth +2.7/5.0
- Condition / age +2.5/5.0
- Appreciation +0.0/10.0
$174,990
🖨 Deal sheet 📄 Offer letter ✓ Due diligence
Listing remarks MLS
Move-in ready townhouse/condo in Cobblestone Landing! This is a 2 Bedroom with a bonus room (could be used as an office or extra bedroom). Upgrades include: Bamboo laminate flooring, all new interior painting, kitchen backsplash, metal designer stair railing, custom vanity & mirror in half bath and glass sliding barn door to bonus room (3rd room). Live maintenance free-HOA covers all exterior maintenance including mowing, landscaping, building insurance, roof/painting reserves, road paving/sidewalks, gated entrance & Community pool. Washer/dryer included but not warranted.
Key facts
- Easy access
- Community pool
- Exterior maintenance
Tags
Property features AI
Finance
- Other: Living area 1,496 square feet (per public records)
- Financial info: Total annual association fees $4,104; Lease restrictions apply
- HOA & community: Monthly condo/HOA fee $342; HOA includes structure and grounds maintenance; Association amenities: Pool; Association approval required; Pets allowed (cats OK, dogs OK, breed restrictions)
Exterior
- Parking: Curb parking
- Utilities: Public water; Public sewer; Electricity connected; Cable connected
- Home design: Residential condominium; Completed condition; Two stories; Faces east; First-floor unit
- Construction: Stucco construction; Shingle roof; Slab foundation; Built as part of multi-unit building
- Exterior features: Other exterior features; Asphalt road access
Interior
- Kitchen: Dishwasher; Microwave; Range; Refrigerator
- Bedrooms: 2 bedrooms
- Flooring: Carpet; Ceramic tile
- Bathrooms: 2 full baths, 1 half bath
- Heating & cooling: Central heat; Central air
- Interior features: Ceiling fans
- Laundry & utility: Laundry inside
Neighborhood map
What this means for you Summary
Snapshot
- This is a 2-bed/2.0-bath condo listed at $175k.
Deal economics
- At list price, monthly cash flow is $-56 ($-673/yr) — negative.
- To cash-flow at today's rent, offer at most $165k (5.7% below list).
- Meets the 1% rule at list price ($2k rent vs $175k).
- Recommended offer: $165k (5.7% below list) — sets the bar for cash-flow.
Location & tenants
- Location reads 77/100 on livability (#206 in FL, #3,179 nationally) — a middle-class / working-renter tenant base. Strengths: cost of living A+, housing A+, health & safety A+; Watch: employment D+, amenities F, commute F.
- Polk (suburban): math 39% / reading 43% proficiency, ranked #62 of 73 in FL (top 85%) — families likely to look elsewhere, expect single-tenant / working-renter base with shorter leases.
- Market conditions: Rents flat; 259 active listings in the ZIP; 18 comparable units currently listed for rent nearby; rentals at typical pace (median 24d on market — plan ~3-4 weeks tenant-placement turnaround); 10,384 units permitted in Polk County in 2024 (1,716 in 5+ unit buildings).
- This rent runs 30% of the median local income ($70k/yr) — at the standard rent-burdened threshold; future hikes will face affordability resistance.
Forward outlook
- Local home prices are declining (-3.0%/yr); year-one equity from $1k of loan paydown is wiped out by about $5k of value loss. Plan a longer hold.
- Polk County population projected at +33% by 2050 — long-run rental-demand tailwind backs the buy-and-hold thesis.
Negotiation context
- Only 13 days on market — expect competitive offers; lowballing is unlikely to land.
- 2 sale attempts since 7y ago with the ask held roughly flat each time — persistent listings suggest the price (not the market) is what's stuck; bring a comps-based counter.
- Current owner paid $129k; 36% above their basis — modest negotiation headroom, anchor on the comps not their cost.
Risks & watch-outs
- Climate carrying-cost: severe wind risk, 99% chance of damaging wind over 30y; extreme-heat days projected 7→25/yr by 2055 (HVAC capex compounding) — expect insurance premiums to compound above CPI over the hold.
Questions for the listing agent
- What do current leases actually rent for vs. the listed asking? Can we see a recent rent roll and the last 12 months of T-12 income?
- What does the HOA fee cover, when was the last increase, and are there any pending special assessments or reserve-fund shortfalls?
- Any open or pending special assessments — roof, HVAC, plumbing, elevator, façade? What's the per-unit balance and payoff schedule, and is the seller paying it off at close or rolling it to the buyer?
- Is there a deadline driving the sale (1031 exchange, divorce, estate, relocation)? That informs how much negotiation room exists.
- The area grade is low — what's the realistic commute time and amenity access for the typical tenant pool here? Any planned neighborhood developments (good or bad) we should know about?
- What's the average days-on-market for RENTAL listings here right now (not sales)? A rising rental-DOM trend means longer vacancies and softer asking-rent achievability than the comps imply.
- What's the recent tenant-quality profile in this submarket — average credit score on applications, eviction rate, late-payment / NSF rate, and stable-employment percentage? A property-management company in the area should have these aggregated.
- How much new apartment / multifamily construction is in the pipeline within 1–3 miles? Heavy new supply (>2% of stock underway) typically softens rents 12–24 months out; light construction supports rent growth.
Investment metrics
- 1% rule
- 1.00% ✓
- Cap rate
- 5.91%
- Cash-on-cash
- -1.37%
- DSCR
- 0.94
- GRM
- 8.3
CMA / ARV
No comps found within radius.
Projected returns pro-forma
-3.0% appreciation · 0.65% rent growth · sell at horizon
- IRR
- -21.7%
- Equity multiple
- 0.27×
- Total profit
- $-35,808
- Equity at exit
- $26,092
- IRR
- -23.8%
- Equity multiple
- -0.04×
- Total profit
- $-50,946
- Equity at exit
- $15,130
Cash invested: $48,997 (down + closing). Projections, not guarantees.
Landlord ↔ Tenant lean methodology
- Overall (STATE)
- 87 Strongly Landlord-Friendly
- State Florida
- 87 Strongly Landlord-Friendly · R+3
- County
- — inherits STATE
- City
- — inherits STATE
ZIP-level market 33809
- Home prices YoY
- -20.9%
- Rents YoY
- 0.7%
- Active inventory
- 259
- Price-to-rent
- 8.3×
Monthly cashflow live
- Estimated rent
- $1,753 high interval (Pro) →
- Mortgage (P&I)
- −$918
- Tax from tax record
- −$108 /mo · $1,296/yr
- Insurance
- −$73
- HOA
- −$342
- Vacancy / Maint / Mgmt
- −$368
- Net cashflow
- $-56
Break-even live
UW: 25.0% down · 7.5% · 30yr · 1.5% tax · 5.0% vac · 8.0% maint · 8.0% mgmt
Financing live
Cash to close
- Down payment
- $43,748
- Closing costs
- $5,250
- Reserves months
- —
- Total cash needed
- —
Loan-product check · same deal, 3 products live
Conventional
25% down · 7.5% · 30yr
- Down + closing
- —
- Monthly P&I
- —
- Monthly cashflow
- —
- DSCR
- —
- Eligible?
- —
Personal DTI + credit; lowest rate.
DSCR
20% down · 8.5% · 30yr
- Down + closing
- —
- Monthly P&I
- —
- Monthly cashflow
- —
- DSCR
- —
- Eligible?
- —
No personal income docs; deal must DSCR.
Hard money
10% down · 12.0% · 12mo
- Down + closing
- —
- Monthly P&I
- —
- Monthly cashflow
- —
- DSCR
- —
- Eligible?
- —
Short-term bridge; refi at stabilization.
Rent comps 18 comps
| Address | Beds | Baths | Sqft | Rent | $/sqft | DOM | Units | Dist |
|---|---|---|---|---|---|---|---|---|
| 5840 Sandpipers Dr Lakeland, FL | 3.0 | 2.0 | 1732 | $2,000 | $1.15 | 14d | 1 | 0.38mi |
| 4950 Deep Forest Ct Lakeland, FL | 1.0–3.0 | 1.0–2.0 | 1047 | $1,718 | $1.64 | 2d | 27 | 0.45mi |
| 6006 Crane Dr Lakeland, FL | 2.0 | 2.0 | 1372 | $2,000 | $1.46 | 11d | 1 | 0.50mi |
| 206 Mary Catherine Ct Lakeland, FL | 3.0 | 2.0 | 1254 | $1,725 | $1.38 | 23d | 1 | 0.74mi |
| 6268 Sandpipers Dr Lakeland, FL | 2.0 | 2.0 | 1484 | $1,995 | $1.34 | 23d | 1 | 0.78mi |
| 259 Village View Ln Lakeland, FL | 2.0 | 2.0 | 885 | $1,600 | $1.81 | 23d | 1 | 0.82mi |
| 235 Leelon Rd Lakeland, FL | 2.0 | 1.0 | 921 | $1,295 | $1.41 | 23d | 1 | 0.82mi |
| 165 Shannon Dr Lakeland, FL | 2.0 | 2.0 | 1008 | $1,350 | $1.34 | 3d | 1 | 0.88mi |
| 239 Village Crest Ct Lakeland, FL | 2.0 | 2.0 | 912 | $1,495 | $1.64 | 23d | 1 | 0.89mi |
| 236 Village Crest Ct Lakeland, FL | 2.0 | 2.0 | 1142 | $1,550 | $1.36 | 13d | 1 | 0.91mi |
| 1031 Hidden Ct Lakeland, FL | 3.0 | 2.0 | 1712 | $1,995 | $1.17 | 23d | 1 | 1.08mi |
| 5818 Bambi Dr Lakeland, FL | 3.0 | 2.0 | 1401 | $2,200 | $1.57 | 23d | 1 | 1.11mi |
| 114 Rosalynn Cir Lakeland, FL | 2.0 | 2.0 | 1033 | $1,450 | $1.40 | 23d | 1 | 1.14mi |
| 124 Rosalynn Cir Lakeland, FL | 2.0 | 2.0 | 1033 | $1,550 | $1.50 | 3d | 1 | 1.15mi |
| 5817 Daughtery Downs Loop Lakeland, FL | 3.0 | 2.0 | 1609 | $1,800 | $1.12 | 14d | 1 | 1.17mi |
| 5817 Daughtery Downs Loop Lakeland, FL | 3.0 | 2.0 | 1609 | $1,800 | $1.12 | 23d | 1 | 1.17mi |
| 5275 Long Lake Cir Lakeland, FL | 1.0–3.0 | 1.0–2.0 | 1075 | $1,565 | $1.46 | 14d | 13 | 1.40mi |
| 5725 Lacar Way Lakeland, FL | 3.0 | 2.0 | 1380 | $1,995 | $1.45 | 13d | 1 | 1.49mi |
HOA detail condo
- Monthly dues
- $342 · $4,104/yr
- Likely covers
- landscapingexterior maint.insurancepoolsecurity
- Assessments
- None detected in remarks — confirm with the listing agent.
Listing history 10 events
-
2026-06-18days on market $174,990 Active 13 DOM
-
2026-06-17days on market $174,990 Active 12 DOM
-
2026-06-16days on market $174,990 Active 11 DOM
-
2026-06-15days on market $174,990 Active 10 DOM
-
2026-06-13days on market $174,990 Active 8 DOM
-
2026-06-10days on market $174,990 Active 5 DOM
-
2026-06-09days on market $174,990 Active 4 DOM
-
2026-06-08days on market $174,990 Active 3 DOM
-
2026-06-07remarks 699-char remark
-
2026-06-07$174,990 Active 2 DOM
ⓘ Source: listings_history table (triggers on properties + properties_extension) + one-shot
backfill from property_details.listing_events for pre-trigger history.
Tax reassessment forecast FL · Resets to sale price
- Current annual tax
- $1,296 · $108/mo
- Projected year-2 tax
- $1,452 · $121/mo
- Expected delta
- +$156/yr (+$13/mo · 12.0%)
ⓘ Screening estimate from a state-policy table — verify with the county assessor before closing.
Climate risk First Street
- Flood 1/10 Low FEMA zone X (unshaded) · 0% chance over 30 yrs
- Wildfire 4/10 Moderate
- Heat 9/10 Extreme 7 d/yr ≥108°F today · 25 d/yr by 30 yrs out
- Wind 9/10 Extreme 99% chance of damaging wind over 30 yrs
- Air quality 2/10 Low 1 unhealthy d/yr today · 2 by 30 yrs out
Nearby sold comps map
Loading sold comps map…
Walkable amenities ~0.75 mi
Loading nearby amenities…
Taxation est. · year 1
- Rental income
- $21,031
- − Mortgage interest
- −$9,802
- − Property taxes
- −$1,296
- − Insurance
- −$875
- − Repairs & maintenance
- −$1,682
- − Management
- −$1,682
- − HOA
- −$4,104
- − Depreciation
- −$5,091
- Taxable loss
- −$3,502
- Est. tax savings @ 24.0%
- +$841
- After-tax cash flow
- $168/yr
For passive investors: Depreciation is non-cash, so a rental often shows a tax loss while cash-flowing — sheltering income. Rental losses are passive: they offset passive income freely, and up to $25,000/yr can offset ordinary (W-2) income if you actively participate and your MAGI is under $100k (phasing out to $0 by $150k); unused losses carry forward. On sale, claimed depreciation is recaptured at up to 25%, and gains may owe capital-gains tax (a 1031 exchange can defer both). Figures are a year-1 estimate at your 24.0% rate — not tax advice; consult a CPA.
Schools (NCES district)
- District
- Polk
- NCES district ID
- 1201590
- Math proficiency
- 39% ▼ -11.00%
- Reading proficiency
- 43% ▼ -4.00%
- Median HH income
- $43,979
- Composite
- 34.74/100
- National rank
- #5132
- State rank
- #62 of 73 in FL
Livability — Lakeland
- Score
- 77/100
- State rank
- #206
- US rank
- #3179
Category grades
Schools grade is shown separately in the Schools card above.
Census & demographics
- Census place
- Lakeland, FL
- County
- Polk County · 740,051 people
- City population
- 277,690
- Metro
- Lakeland-Winter Haven, FL
- Population (ZIP)
- 30,797
- Household income
- $70,066
- Rent vs Own
- Severe rent burden
- 924.0
Population outlook (Polk County) Hauer SSP2
- Today (2025)
- 752,975 people
- By 2030
- 804,621 · +6.9%
- By 2040
- 906,117 · +20.3%
- By 2050
- 1,000,476 · +32.9%
- By 2075
- 1,197,520 · +59.0%
- By 2100
- 1,271,518 · +68.9%
Race, ethnicity, and origin ACS 2023
- Neighborhood character
- Diverse neighborhood (Simpson 0.55)
- Race & ethnicity
- White 63% Hispanic / Latino 18% Black 11% Two or more races 11% Asian 3%
- Hispanic origin (detail)
- Puerto Rican 9% Cuban 1% Dominican 2%
- Common ancestry
- Lithuanian 2% Italian 2% Romanian 2%
- Foreign-born
- 11% · Canada, Jamaica
- Languages at home
- 81% English-only · Spanish 15% Other Asian/Pacific 2% Other Indo-European 1%
Political lean MEDSL · Polk
- 2024 margin
- Strong R (+20.7) · D 39.2% · R 59.9%
- 2008→2024 swing
- -14.6pp toward R · 2008: -6.1pp · 2024: -20.7pp
- All cycles
- 2024: R+20.7 2020: R+14.4 2016: R+14.1 2012: R+6.8 2008: R+6.1
Not yet ingested
- Civics
- —
Market trends
- HPI YoY
- ▼ -79.46%
- Current HPI
- 301.3054
- Rent YoY
- ▲ 0.65%
- Metro
- Lakeland-Winter Haven, FL
- State GDP YoY
- ▲ 3.28%
- F500 in state
- 36
Industry mix (Fortune 500 HQ in FL)
| Industry | F500 HQs | Revenue |
|---|---|---|
| Industrial Technology | 2 | $29B |
|
||
| Insurance | 2 | $17B |
|
||
| Retail | 1 | $60B |
|
||
| Technology Distribution | 1 | $58B |
|
||
| Homebuilding | 1 | $35B |
|
||
| Technology Manufacturing | 1 | $35B |
|
||
Price history
+29.7% since first listed5 events — show timeline
- 2026-06-05 Listed $174,990 Stellar MLS as Distributed by MLS Grid
- 2019-11-22 Sold (Public Records) $129,000 Public Records
- 2019-11-21 Sold (MLS) $129,000 Stellar MLS as Distributed by MLS Grid
- 2019-10-12 Pending — Stellar MLS as Distributed by MLS Grid
- 2019-09-30 Listed $134,900 Stellar MLS as Distributed by MLS Grid
Property tax history
-1.4%/yrLatest (2025): $1,296 · +3.8% YoY. Source: county tax records.
Cash-flow waterfall
monthlySold comps — $/sqft
last 12 mo · ≤1 miLoading sold comps…