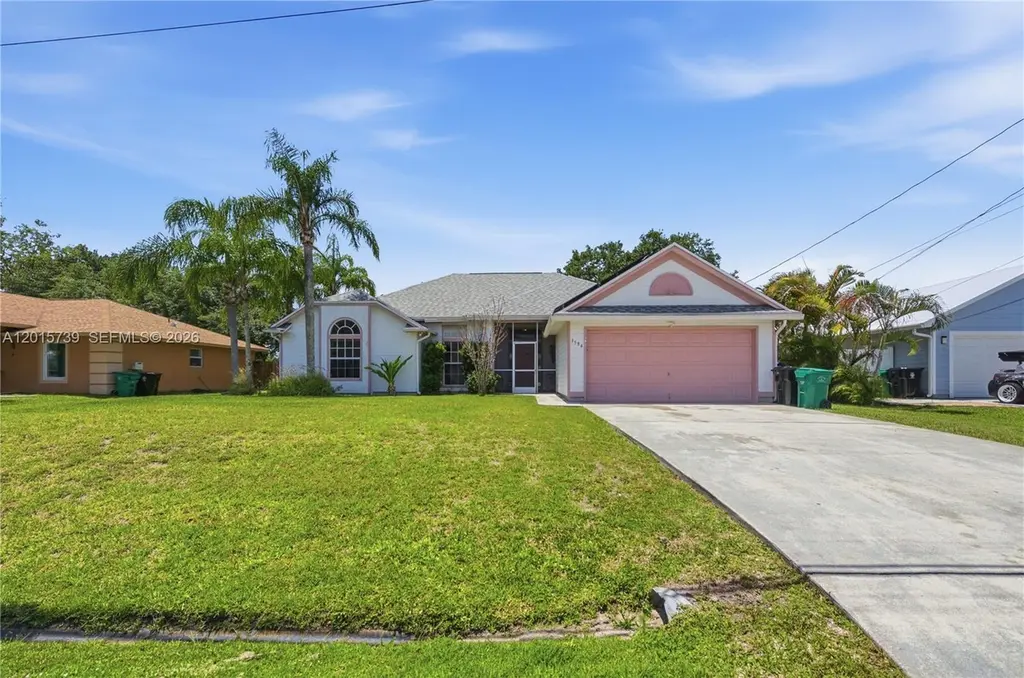
3584 SW Zullo St · Port St. Lucie, FL
Flood risk 1/10 · Minimal
- FEMA flood zone
- X (unshaded)
- Chance of flooding over 30 yrs
- 0.0%
- Est. flood insurance / yr
- $507 – $1,088
Fire risk 2/10 · Minimal
- Est. fire insurance / yr
- $947 – $1,759
Heat risk 10/10 · Severe
- Hot days now (above 107°F)
- 7 days/yr
- Hot days in 30 yrs
- 23 days/yr
Wind risk 10/10 · Severe
- Chance of severe wind over 30 yrs
- 99.0%
Air-quality risk 1/10 · Minimal
- Unhealthy air days now
- 0 days/yr
- Unhealthy air days in 30 yrs
- 0 days/yr
Risk factors via First Street. Map © Google.
Why this score? — see what drove the C grade
The composite is a weighted blend of 9 inputs, each scored 0–100. Each bar is that input's sub-score; the figure is the points it added to the 100-point composite (weight × sub-score).
- Cash flow +20.2/30.0
- ARV discount +15.0/15.0
- 1% rule +6.8/10.0
- DSCR +6.4/10.0
- Schools +3.7/10.0
- Rent growth +2.6/5.0
- Livability +2.5/5.0
- Condition / age +2.5/5.0
- Appreciation +0.0/10.0
$249,000
🖨 Deal sheet 📄 Offer letter ✓ Due diligence
Listing remarks
This immaculate 3-bedroom, 2-bathroom residence offers a perfect blend of comfort and style with 1,629 square feet of heated area. Nestled on a spacious lot with no flood zone worries, you'll enjoy endless summers splashing in the pristine pool or lounging in the expansive 730 square foot screen porch—a true entertainer's delight. Inside, discover an inviting open floor plan bathed in natural light. The modern kitchen is a chef's paradise featuring ample cabinetry and sleek countertops. Retreat to the serene primary suite complete with an ensuite bath for ultimate relaxation. Two additional well-appointed bedrooms offer versatility for guests or home office needs. Step outside to find
Key facts
- Pristine pool
- Open floor plan
- Modern kitchen
Tags
Property features AI
Exterior
- Parking: Attached garage (2 spaces); Driveway
- Utilities: Public water; Public sewer
- Home design: Single-story; Faces east; Resale property
- Construction: Frame and stucco construction; Shingle roof
- Exterior features: Enclosed porch; Porch with screen enclosure
Interior
- Kitchen: Electric range; Microwave; Dishwasher; Refrigerator
- Bedrooms: Bedroom on main level
- Flooring: Tile
- Bathrooms: 2 full bathrooms
- Heating & cooling: Central heating
- Interior features: First-floor entry; Bedroom on the main level
- Laundry & utility: Washer; Dryer
Neighborhood map
What this means for you Summary
Snapshot
- This is a 3-bed/2.0-bath single-family listed at $249k.
Deal economics
- At list price, monthly cash flow is $315 ($4k/yr) — positive.
- The deal already cash-flows at list — no discount required.
- Meets the 1% rule at list price ($3k rent vs $249k).
- Cap rate 7.8% vs local median 3.9% in Port St. Lucie — top-decile yield for the area; either an underpriced asset or a hidden risk that comps aren't pricing in. Stress-test before assuming the spread holds.
Location & tenants
- Location reads: area grade C — affects rentability + tenant quality, not the cash-flow math above.
- St. Lucie (urban): math 40% / reading 48% proficiency, ranked #51 of 73 in FL (top 70%) — families likely to look elsewhere, expect single-tenant / working-renter base with shorter leases.
- Market conditions: Rents flat; 758 active listings in the ZIP; 31 comparable units currently listed for rent nearby; rentals at typical pace (median 23d on market — plan ~3-4 weeks tenant-placement turnaround); solid renter incomes; 4,868 units permitted in St. Lucie County in 2024 (268 in 5+ unit buildings).
- This rent runs 41% of the median local income ($86k/yr) — at the standard rent-burdened threshold; future hikes will face affordability resistance.
Forward outlook
- Local home prices are declining (-3.0%/yr); year-one equity from $2k of loan paydown is wiped out by about $7k of value loss. Plan a longer hold.
- St. Lucie County population projected at +20% by 2050 — long-run rental-demand tailwind backs the buy-and-hold thesis.
Negotiation context
- Only 5 days on market — expect competitive offers; lowballing is unlikely to land.
- 2 sale attempts since 2y ago; this cycle's ask has dropped $111k (31%) from the opening price — seller is motivated, your offer sets the floor, not the list.
- Current owner paid $96k; list at $249k implies a 159% gain — meaningful room to come down on a strong offer.
Risks & watch-outs
- Watch-outs: property tax is 2.9% of price.
- Climate carrying-cost: severe wind risk, 99% chance of damaging wind over 30y; extreme-heat days projected 7→23/yr by 2055 (HVAC capex compounding) — expect insurance premiums to compound above CPI over the hold.
Questions for the listing agent
- Property tax is high relative to price — has the assessment been appealed recently, and will the sale trigger a re-assessment?
- Is there a deadline driving the sale (1031 exchange, divorce, estate, relocation)? That informs how much negotiation room exists.
- What's the average days-on-market for RENTAL listings here right now (not sales)? A rising rental-DOM trend means longer vacancies and softer asking-rent achievability than the comps imply.
- What's the recent tenant-quality profile in this submarket — average credit score on applications, eviction rate, late-payment / NSF rate, and stable-employment percentage? A property-management company in the area should have these aggregated.
- How much new for-sale + rental construction is in the pipeline within 1–3 miles? Heavy new supply typically softens prices + rents 12–24 months out; constrained supply supports both.
Investment metrics
- 1% rule
- 1.18% ✓
- Cap rate
- 7.81%
- Cash-on-cash
- 5.43%
- DSCR
- 1.24
- GRM
- 7.1
CMA / ARV
- ARV (on-the-fly)
- $399,105
- Comps found
- 5
Show comp detail 5 sales within ~0.75 mi
| Address | Dist | Beds/Ba | Sqft | Sold | Price | $/sf | Match |
|---|---|---|---|---|---|---|---|
| 3444 SW Ellis St | 0.26mi | 3/2.0 | 1,643 (+1%) | 1mo | $390,000 | $237 | 86 |
| 3391 SW Rosser Blvd | 0.65mi | 3/2.0 | 1,590 (-2%) | 1mo | $390,000 | $245 | 65 |
| 1766 SW Capehart Ave | 0.52mi | 3/2.0 | 1,510 (-7%) | 10mo | $370,000 | $245 | 55 |
| 3541 SW Kromrey St | 0.66mi | 3/2.0 | 1,669 (+2%) | 13mo | $442,000 | $265 | 54 |
| 1666 SW Caisor Ave | 0.59mi | 3/2.0 | 1,396 (-14%) | 22mo | $375,000 | $269 | 30 |
Match score weights: distance 35% · size 25% · config 20% · recency 20%. Top-matched comps best support the ARV.
Projected returns pro-forma
-3.0% appreciation · 0.22% rent growth · sell at horizon
- IRR
- -11.4%
- Equity multiple
- 0.60×
- Total profit
- $-28,055
- Equity at exit
- $37,127
- IRR
- -7.6%
- Equity multiple
- 0.59×
- Total profit
- $-28,754
- Equity at exit
- $21,529
Cash invested: $69,720 (down + closing). Projections, not guarantees.
Landlord ↔ Tenant lean methodology
- Overall (STATE)
- 87 Strongly Landlord-Friendly
- State Florida
- 87 Strongly Landlord-Friendly · R+3
- County
- — inherits STATE
- City
- — inherits STATE
ZIP-level market 34953
- Home prices YoY
- -10.1%
- Rents YoY
- 0.2%
- Active inventory
- 758
- Price-to-rent
- 7.1×
Monthly cashflow live
- Estimated rent
- $2,942 high interval (Pro) →
- Mortgage (P&I)
- −$1,306
- Tax from tax record
- −$600 /mo · $7,195/yr
- Insurance
- −$104
- HOA
- −$0
- Vacancy / Maint / Mgmt
- −$618
- Net cashflow
- $315
Break-even live
UW: 25.0% down · 7.5% · 30yr · 1.5% tax · 5.0% vac · 8.0% maint · 8.0% mgmt
Financing live
Cash to close
- Down payment
- $62,250
- Closing costs
- $7,470
- Reserves months
- —
- Total cash needed
- —
Loan-product check · same deal, 3 products live
Conventional
25% down · 7.5% · 30yr
- Down + closing
- —
- Monthly P&I
- —
- Monthly cashflow
- —
- DSCR
- —
- Eligible?
- —
Personal DTI + credit; lowest rate.
DSCR
20% down · 8.5% · 30yr
- Down + closing
- —
- Monthly P&I
- —
- Monthly cashflow
- —
- DSCR
- —
- Eligible?
- —
No personal income docs; deal must DSCR.
Hard money
10% down · 12.0% · 12mo
- Down + closing
- —
- Monthly P&I
- —
- Monthly cashflow
- —
- DSCR
- —
- Eligible?
- —
Short-term bridge; refi at stabilization.
Rent comps 31 comps
| Address | Beds | Baths | Sqft | Rent | $/sqft | DOM | Units | Dist |
|---|---|---|---|---|---|---|---|---|
| 1791 SW Effland Ave Port Saint Lucie, FL | 4.0 | 3.0 | 2239 | $3,300 | $1.47 | 13d | 1 | 0.31mi |
| 1733 SW Open View Dr Port Saint Lucie, FL | 4.0 | 2.0 | 1915 | $2,600 | $1.36 | 21d | 1 | 0.41mi |
| 1766 SW Millikin Ave Port Saint Lucie, FL | 2.0 | 1.0 | 1501 | $1,800 | $1.20 | 23d | 1 | 0.59mi |
| 3262 SW Cohutta St Port Saint Lucie, FL | 3.0 | 2.0 | 2026 | $2,700 | $1.33 | 23d | 1 | 0.67mi |
| 3450 SW Martin St Port Saint Lucie, FL | 4.0 | 2.0 | 1930 | $3,800 | $1.97 | 23d | 1 | 0.70mi |
| 3273 SW Rosser Blvd Port Saint Lucie, FL | 4.0 | 2.0 | 1787 | $2,600 | $1.45 | 13d | 1 | 0.77mi |
| 1692 SW Alvaton Ave Port Saint Lucie, FL | 4.0 | 2.0 | 2050 | $2,900 | $1.41 | 23d | 1 | 0.77mi |
| 1692 SW Alvaton Ave Port St Lucie, FL | 4.0 | 2.0 | 2050 | $2,900 | $1.41 | 13d | 1 | 0.77mi |
| 1454 SW Medina Ave Port Saint Lucie, FL | 3.0 | 2.0 | 1558 | $2,395 | $1.54 | 13d | 1 | 0.80mi |
| 3189 SW Curcuma St Port Saint Lucie, FL | 4.0 | 2.0 | 1800 | $2,900 | $1.61 | 23d | 1 | 0.89mi |
| 3150 SW Centamino St Port Saint Lucie, FL | 3.0 | 2.0 | 1284 | $2,200 | $1.71 | 13d | 1 | 1.01mi |
| 3158 SW Martin St Port Saint Lucie, FL | 3.0 | 2.0 | 1878 | $4,800 | $2.56 | 23d | 1 | 1.01mi |
| 3133 SW Centamino St Port Saint Lucie, FL | 4.0 | 2.0 | 1916 | $2,800 | $1.46 | 21d | 1 | 1.02mi |
| 12545 SW Gray Fox Ln Port Saint Lucie, FL | 3.0 | 2.0 | 2050 | $3,100 | $1.51 | 23d | 1 | 1.12mi |
| 2206 SW Cape Cod Dr Port Saint Lucie, FL | 3.0 | 2.5 | 2123 | $2,800 | $1.32 | 13d | 1 | 1.17mi |
| 2165 SW Newport Isles Blvd Port Saint Lucie, FL | 3.0 | 2.0 | 2182 | $2,995 | $1.37 | 23d | 1 | 1.18mi |
| 3201 SW Collings Dr Port Saint Lucie, FL | 3.0 | 2.0 | 1389 | $2,616 | $1.88 | 13d | 1 | 1.19mi |
| 1538 SW Neptune Ave Port Saint Lucie, FL | 3.0 | 2.0 | 2052 | $2,650 | $1.29 | 13d | 1 | 1.20mi |
| 3226 SW Nutley St Port Saint Lucie, FL | 3.0 | 2.0 | 1552 | $2,900 | $1.87 | 23d | 1 | 1.23mi |
| 2264 SW Newport Isles Blvd Port Saint Lucie, FL | 3.0 | 2.0 | 2182 | $2,475 | $1.13 | 13d | 1 | 1.23mi |
| 1298 SW Crost Ave Port Saint Lucie, FL | 4.0 | 2.0 | 1833 | $2,566 | $1.40 | 13d | 1 | 1.25mi |
| 2894 SW Cedar Dunes Dr Port Saint Lucie, FL | 3.0 | 2.5 | 2198 | $2,700 | $1.23 | 23d | 1 | 1.26mi |
| 12944 SW Vermillion Cir Indiantown, FL | 3.0 | 2.0 | 1579 | $3,000 | $1.90 | 23d | 1 | 1.29mi |
| 1342 SW Wampler Ave Port Saint Lucie, FL | 3.0 | 2.0 | 1282 | $2,400 | $1.87 | 23d | 1 | 1.30mi |
| 3773 SW Swope St Port Saint Lucie, FL | 4.0 | 2.0 | 1915 | $2,600 | $1.36 | 21d | 1 | 1.35mi |
| 12327 SW Sand Dollar Way Port Saint Lucie, FL | 4.0 | 2.0 | 1849 | $3,100 | $1.68 | 23d | 1 | 1.38mi |
| 1217 SW Marmore Ave Port Saint Lucie, FL | 3.0 | 2.0 | 1580 | $3,700 | $2.34 | 23d | 1 | 1.40mi |
| 3014 SW Segovia St Port Saint Lucie, FL | 3.0 | 2.0 | 2102 | $2,700 | $1.28 | 13d | 1 | 1.40mi |
| 2957 SW Collings Dr Port Saint Lucie, FL | 3.0 | 2.0 | 2042 | $3,000 | $1.47 | 23d | 1 | 1.42mi |
| 8950 SW Hegener Dr Port Saint Lucie, FL | 1.0–3.0 | 1.0–2.5 | 1078 | $2,799 | $2.60 | 13d | 16 | 1.43mi |
| 2992 SW Lucerne St Port Saint Lucie, FL | 3.0 | 2.0 | 1734 | $2,500 | $1.44 | 23d | 1 | 1.50mi |
Listing history 14 events
-
2026-06-14statusdays on market $249,000 Pending 5 DOM
-
2026-06-13days on market $249,000 Active 4 DOM
-
2026-06-10days on market $249,000 Active 2 DOM
-
2026-06-09pricedays on market $249,000 Active 1 DOM
-
2026-05-08$359,990 Active
-
2024-09-16historical $2,250
-
2024-09-05price $2,250
-
2024-08-24price $2,350
-
2024-07-27price $2,490
-
2024-07-14price $2,600
-
2024-07-02price $150
-
2024-06-21price $175
-
2024-05-29$200
-
2000-02-08soldstatus $96,000
ⓘ Source: listings_history table (triggers on properties + properties_extension) + one-shot
backfill from property_details.listing_events for pre-trigger history.
Tax reassessment forecast FL · Resets to sale price
- Current annual tax
- $7,195 · $600/mo
- Projected year-2 tax
- $7,195 · $600/mo
- Expected delta
- $0/yr ($0/mo · 0.0%)
ⓘ Screening estimate from a state-policy table — verify with the county assessor before closing.
Climate risk First Street
- Flood 1/10 Low FEMA zone X (unshaded) · 0% chance over 30 yrs
- Wildfire 2/10 Low
- Heat 10/10 Extreme 7 d/yr ≥107°F today · 23 d/yr by 30 yrs out
- Wind 10/10 Extreme 99% chance of damaging wind over 30 yrs
- Air quality 1/10 Low 0 unhealthy d/yr today · 0 by 30 yrs out
Nearby sold comps map
Loading sold comps map…
Walkable amenities ~0.75 mi
Loading nearby amenities…
Taxation est. · year 1
- Rental income
- $35,308
- − Mortgage interest
- −$13,948
- − Property taxes
- −$7,195
- − Insurance
- −$1,245
- − Repairs & maintenance
- −$2,825
- − Management
- −$2,825
- − Depreciation
- −$7,244
- Taxable income
- $27
- Est. tax owed @ 24.0%
- −$6
- After-tax cash flow
- $3,777/yr
For passive investors: Depreciation is non-cash, so a rental often shows a tax loss while cash-flowing — sheltering income. Rental losses are passive: they offset passive income freely, and up to $25,000/yr can offset ordinary (W-2) income if you actively participate and your MAGI is under $100k (phasing out to $0 by $150k); unused losses carry forward. On sale, claimed depreciation is recaptured at up to 25%, and gains may owe capital-gains tax (a 1031 exchange can defer both). Figures are a year-1 estimate at your 24.0% rate — not tax advice; consult a CPA.
Schools (NCES district)
- District
- St. Lucie
- NCES district ID
- 1201770
- Math proficiency
- 40% ▼ -11.00%
- Reading proficiency
- 48% ▼ -4.00%
- Median HH income
- $44,737
- Composite
- 37.28/100
- National rank
- #4449
- State rank
- #51 of 73 in FL
Livability — Port St. Lucie
No livability data for this city. (Only ~50 U.S. cities are tracked.)
Census & demographics
- Census place
- Port St. Lucie, FL
- County
- Saint Lucie County · 337,150 people
- City population
- 221,051
- Metro
- Port St. Lucie, FL
- Population (ZIP)
- 86,875
- Household income
- $85,667
- Rent vs Own
- Severe rent burden
- 857.0
Population outlook (St. Lucie County) Hauer SSP2
- Today (2025)
- 338,016 people
- By 2030
- 355,687 · +5.2%
- By 2040
- 385,521 · +14.1%
- By 2050
- 406,106 · +20.1%
- By 2075
- 441,054 · +30.5%
- By 2100
- 436,885 · +29.2%
Race, ethnicity, and origin ACS 2023
- Neighborhood character
- Diverse neighborhood (Simpson 0.69)
- Race & ethnicity
- White 42% Hispanic / Latino 28% Black 23% Two or more races 15% Asian 2%
- Hispanic origin (detail)
- Mexican 2% Puerto Rican 8% Cuban 4% Dominican 3%
- Common ancestry
- Hispanic 4% Romanian 2% Estonian 2%
- Foreign-born
- 24% · Canada, Jamaica, China
- Languages at home
- 69% English-only · Spanish 19% French/Haitian/Cajun 6% Other Indo-European 3%
Political lean MEDSL · St. Lucie
- 2024 margin
- Lean R (+9.1) · D 45.1% · R 54.2%
- 2008→2024 swing
- -21.2pp toward R · 2008: 12.1pp · 2024: -9.1pp
- All cycles
- 2024: R+9.1 2020: R+1.6 2016: R+2.5 2012: D+7.9 2008: D+12.1
Not yet ingested
- Civics
- —
Market trends
- HPI YoY
- ▼ -44.19%
- Current HPI
- 392.7681
- Rent YoY
- ▲ 0.22%
- Metro
- Port St. Lucie, FL
- State GDP YoY
- ▲ 3.28%
- F500 in state
- 36
Industry mix (Fortune 500 HQ in FL)
| Industry | F500 HQs | Revenue |
|---|---|---|
| Industrial Technology | 2 | $29B |
|
||
| Insurance | 2 | $17B |
|
||
| Retail | 1 | $60B |
|
||
| Technology Distribution | 1 | $58B |
|
||
| Homebuilding | 1 | $35B |
|
||
| Technology Manufacturing | 1 | $35B |
|
||
Price history
+275.0% since first listed10 events — show timeline
- 2026-05-08 Listed $359,990 MARMLS
- 2024-09-16 Rental Removed $2,250 APPFOLIO
- 2024-09-05 Price Changed $2,250 APPFOLIO
- 2024-08-24 Price Changed $2,350 APPFOLIO
- 2024-07-27 Price Changed $2,490 APPFOLIO
- 2024-07-14 Price Changed $2,600 APPFOLIO
- 2024-07-02 Price Changed $150 APPFOLIO
- 2024-06-21 Price Changed $175 APPFOLIO
- 2024-05-29 Listed for Rent $200 APPFOLIO
- 2000-02-08 Sold (Public Records) $96,000 Public Records
Property tax history
+24.5%/yrLatest (2025): $7,195 · +1043.1% YoY. Source: county tax records.
Cash-flow waterfall
monthlySold comps — $/sqft
last 12 mo · ≤1 miLoading sold comps…