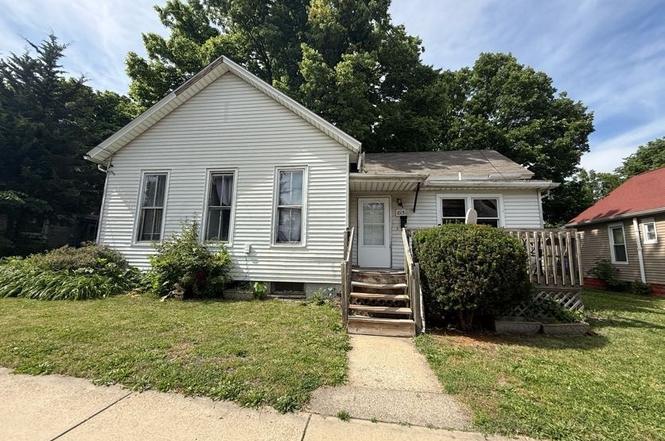
815 W Mill St · Bloomington, IL
Flood risk 1/10 · Minimal
- FEMA flood zone
- X (unshaded)
- Chance of flooding over 30 yrs
- 0.0%
- Est. flood insurance / yr
- $473 – $860
Fire risk 1/10 · Minimal
- Est. fire insurance / yr
- $804 – $1,492
Heat risk 3/10 · Minor
- Hot days now (above 106°F)
- 7 days/yr
- Hot days in 30 yrs
- 18 days/yr
Wind risk 2/10 · Minimal
- Chance of severe wind over 30 yrs
- 2.0%
Air-quality risk 2/10 · Minimal
- Unhealthy air days now
- 1 days/yr
- Unhealthy air days in 30 yrs
- 2 days/yr
Risk factors via First Street. Map © Google.
Why this score? — see what drove the B+ grade
The composite is a weighted blend of 9 inputs, each scored 0–100. Each bar is that input's sub-score; the figure is the points it added to the 100-point composite (weight × sub-score).
- Cash flow +30.0/30.0
- ARV discount +15.0/15.0
- 1% rule +10.0/10.0
- DSCR +10.0/10.0
- Rent growth +3.9/5.0
- Livability +3.9/5.0
- Condition / age +2.5/5.0
- Schools +1.5/10.0
- Appreciation +0.0/10.0
$80,000
🖨 Deal sheet (PDF) 📄 Offer letter ✓ Due diligence
Listing remarks
Welcome to 815 West Mill Street - an affordable opportunity packed with potential and priced aggressively at just $80,000! This 3-bedroom, 2-bathroom home is being delivered vacant and clean, making it an excellent option for an investor, handyman, rental portfolio addition, or owner-occupant looking to build equity through a few finishing touches. Several important updates have already been completed, including a new furnace, new water heater, new dishwasher, and recent cosmetic improvements. With many of the major mechanical items addressed, the next owner can focus on bringing their own vision to the remaining TLC and updates. Whether you're looking for a value-add investment or an af
Key facts
- New furnace
- New water heater
- New dishwasher
Tags
Property features AI
Finance
- HOA & community: No master association fee required
Exterior
- Utilities: Public water; Public sewer
- Home design: Detached single-family home; One-story layout; Fee simple ownership; Built over 100 years ago; Home built before 1978
- Construction: Frame construction
- Exterior features: Lot dimensions approximately 60 x 115; Lot smaller than 0.25 acre
Interior
- Kitchen: Kitchen on main level (10 x 10)
- Bedrooms: Master bedroom on main level (14 x 17); Bedroom on main level (12 x 13); Bedroom on main level (11 x 12)
- Bathrooms: 2 full bathrooms
- Heating & cooling: Natural gas heating; Central air conditioning
- Interior features: 5 total rooms; Unfinished full basement
- Laundry & utility: Laundry room
Neighborhood map
What this means for you Summary
Snapshot
- This is a 3-bed/2.0-bath single-family listed at $80k.
Deal economics
- At list price, monthly cash flow is $657 ($8k/yr) — positive.
- The deal already cash-flows at list — no discount required.
- Meets the 1% rule at list price ($2k rent vs $80k).
- Cap rate 16.2% vs local median 5.4% in Bloomington — top-decile yield for the area; either an underpriced asset or a hidden risk that comps aren't pricing in. Stress-test before assuming the spread holds.
Location & tenants
- Location reads 77/100 on livability (#161 in IL, #2,987 nationally) — a middle-class / working-renter tenant base. Strengths: cost of living A+, housing A+, health & safety A+; Watch: schools C-, amenities C-, commute F.
- Bloomington SD 87 (urban): math 14% / reading 19% proficiency, ranked #476 of 620 in IL (top 77%) — low school quality limits family demand, transient renter base, plan for 1-2y turnover.
- Market conditions: Rents rising fast (+5.6%/yr); 92 active listings in the ZIP; 10 comparable units currently listed for rent nearby; rentals at typical pace (median 22d on market — plan ~3-4 weeks tenant-placement turnaround); 247 units permitted in McLean County in 2024 (54 in 5+ unit buildings).
- This rent runs 34% of the median local income ($57k/yr) — at the standard rent-burdened threshold; future hikes will face affordability resistance.
Forward outlook
- Local home prices are declining (-3.0%/yr); year-one equity from $553 of loan paydown is wiped out by about $2k of value loss. Plan a longer hold.
- At projected returns (-3.0% appreciation + 5.6% rent growth), your $22k cash investment doubles in ~4 years — after that, you're playing with house money.
Negotiation context
- Only 10 days on market — expect competitive offers; lowballing is unlikely to land.
Risks & watch-outs
- Watch-outs: built in 1900 — expect roof / HVAC / electrical / plumbing capex.
Questions for the listing agent
- Built in 1900 — when were the roof, HVAC, electrical panel, plumbing, and water heater last replaced?
- Is there a deadline driving the sale (1031 exchange, divorce, estate, relocation)? That informs how much negotiation room exists.
- What's the average days-on-market for RENTAL listings here right now (not sales)? A rising rental-DOM trend means longer vacancies and softer asking-rent achievability than the comps imply.
- What's the recent tenant-quality profile in this submarket — average credit score on applications, eviction rate, late-payment / NSF rate, and stable-employment percentage? A property-management company in the area should have these aggregated.
- How much new for-sale + rental construction is in the pipeline within 1–3 miles? Heavy new supply typically softens prices + rents 12–24 months out; constrained supply supports both.
Investment metrics
- 1% rule
- 2.01% ✓
- Cap rate
- 16.15%
- Cash-on-cash
- 35.20%
- DSCR
- 2.57
- GRM
- 4.1
CMA / ARV
- ARV (on-the-fly)
- $155,324
- Comps found
- 12
Show comp detail 12 sales within ~0.75 mi
| Address | Dist | Beds/Ba | Sqft | Sold | Price | $/sf | Match |
|---|---|---|---|---|---|---|---|
| 310 S Western Ave | 0.23mi | 3/1.0 | 1,323 (-1%) | 1mo | $41,000 | $31 | 83 |
| 1022 W Taylor St | 0.14mi | 2/1.5 (-1) | 1,290 (-4%) | 1mo | $150,000 | $116 | 80 |
| 507 W Oakland Ave | 0.29mi | 3/1.5 | 1,256 (-6%) | 2mo | $195,000 | $155 | 73 |
| 1211 S Lee St | 0.51mi | 3/2.5 | 1,332 (-0%) | 2mo | $162,000 | $122 | 72 |
| 1101 Low St | 0.38mi | 4/1.5 (+1) | 1,371 (+2%) | 0mo | $118,000 | $86 | 71 |
| 1226 Low St | 0.52mi | 3/2.0 | 1,325 (-1%) | 5mo | $196,000 | $148 | 70 |
| 1005 S Lee St | 0.40mi | 2/1.0 (-1) | 1,374 (+3%) | 6mo | $99,000 | $72 | 63 |
| 1213 S Madison St | 0.63mi | 2/1.0 (-1) | 1,347 (+1%) | 2mo | $94,000 | $70 | 59 |
| 1006 S East St | 0.71mi | 4/1.0 (+1) | 1,332 (-0%) | 5mo | $163,500 | $123 | 53 |
| 1307 S Main St | 0.74mi | 2/1.0 (-1) | 1,298 (-3%) | 1mo | $158,000 | $122 | 51 |
| 406 E Oakland Ave | 0.75mi | 2/1.0 (-1) | 1,356 (+1%) | 6mo | $59,000 | $44 | 49 |
| 405 W Bissell St | 0.58mi | 4/1.0 (+1) | 1,196 (-11%) | 4mo | $49,999 | $42 | 42 |
Match score weights: distance 35% · size 25% · config 20% · recency 20%. Top-matched comps best support the ARV.
Projected returns pro-forma
-3.0% appreciation · 5.6% rent growth · sell at horizon
- IRR
- 33.9%
- Equity multiple
- 2.49×
- Total profit
- $33,270
- Equity at exit
- $11,928
- IRR
- 42.2%
- Equity multiple
- 5.54×
- Total profit
- $101,803
- Equity at exit
- $6,917
Cash invested: $22,400 (down + closing). Projections, not guarantees.
Landlord ↔ Tenant lean methodology
- Overall (STATE)
- 43 Moderately Tenant-Leaning
- State Illinois
- 43 Moderately Tenant-Leaning · D+7
- County
- — inherits STATE
- City
- — inherits STATE
ZIP-level market 61701
- Rents YoY
- 5.6%
- Active inventory
- 92
- Price-to-rent
- 4.1×
Monthly cashflow live
- Estimated rent
- $1,609 high interval (Pro) →
- Mortgage (P&I)
- −$420
- Tax from tax record
- −$161 /mo · $1,930/yr
- Insurance
- −$33
- HOA
- −$0
- Vacancy / Maint / Mgmt
- −$338
- Net cashflow
- $657
Break-even live
Sensitivity live
| Price | -10% $702 | -5% $680 | +0% $657 | +5% $635 | +10% $612 |
|---|---|---|---|---|---|
| Rent | -10% $530 | -5% $594 | +0% $657 | +5% $721 | +10% $784 |
| Rate | -1.0pp $697 | -0.5pp $677 | base $657 | +0.5pp $636 | +1.0pp $615 |
UW: 25.0% down · 7.5% · 30yr · 1.5% tax · 5.0% vac · 8.0% maint · 8.0% mgmt
Financing live
Cash to close
- Down payment
- $20,000
- Closing costs
- $2,400
- Reserves months
- —
- Total cash needed
- —
Loan-product check · same deal, 3 products live
Conventional
25% down · 7.5% · 30yr
- Down + closing
- —
- Monthly P&I
- —
- Monthly cashflow
- —
- DSCR
- —
- Eligible?
- —
Personal DTI + credit; lowest rate.
DSCR
20% down · 8.5% · 30yr
- Down + closing
- —
- Monthly P&I
- —
- Monthly cashflow
- —
- DSCR
- —
- Eligible?
- —
No personal income docs; deal must DSCR.
Hard money
10% down · 12.0% · 12mo
- Down + closing
- —
- Monthly P&I
- —
- Monthly cashflow
- —
- DSCR
- —
- Eligible?
- —
Short-term bridge; refi at stabilization.
Rent comps 10 comps
| Address | Beds | Baths | Sqft | Rent | $/sqft | DOM | Units | Dist |
|---|---|---|---|---|---|---|---|---|
| 703 W Olive St Bloomington, IL | 3.0 | 1.0 | 1000 | $1,495 | $1.50 | 22d | 1 | 0.23mi |
| 507 1/2 S Clayton St Bloomington, IL | 3.0 | 1.0 | 1003 | $1,895 | $1.89 | 22d | 1 | 0.90mi |
| 915 N Madison St Unit 4 Bloomington, IL | 2.0 | 1.0 | 900 | $899 | $1.00 | 22d | 1 | 1.03mi |
| 318 E Locust St Apt A Bloomington, IL | 3.0 | 2.0 | 1200 | $3,000 | $2.50 | 45d | 1 | 1.04mi |
| 1102 N Madison St Bloomington, IL | 3.0 | 2.0 | 1603 | $1,950 | $1.22 | 22d | 1 | 1.09mi |
| 1619 R T Dunn Dr Bloomington, IL | 3.0 | 2.0 | 1200 | $1,300 | $1.08 | 22d | 1 | 1.13mi |
| 102 Donnie Dr Unit 1906Tra-202 Bloomington, IL | 2.0 | 1.0 | 1500 | $1,169 | $0.78 | 22d | 1 | 1.23mi |
| 503 E Empire St Bloomington, IL | 3.0 | 2.0 | 1000 | $1,795 | $1.79 | 45d | 1 | 1.24mi |
| 507 E Graham St Bloomington, IL | 3.0 | 1.5 | 1300 | $1,900 | $1.46 | 45d | 1 | 1.30mi |
| 108 Oak Creek Plz Unit 3-10 Bloomington, IL | 2.0 | 1.0 | 1150 | $1,199 | $1.04 | 22d | 1 | 1.32mi |
Listing history 9 events
-
2026-06-21days on market $80,000 Active 10 DOM
-
2026-06-19days on market $80,000 Active 8 DOM
-
2026-06-18days on market $80,000 Active 7 DOM
-
2026-06-17days on market $80,000 Active 6 DOM
-
2026-06-16days on market $80,000 Active 5 DOM
-
2026-06-15days on market $80,000 Active 4 DOM
-
2026-06-14days on market $80,000 Active 2 DOM
-
2026-06-13remarks 699-char remark
-
2026-06-13$80,000 Active 1 DOM
ⓘ Source: listings_history table (triggers on properties + properties_extension) + one-shot
backfill from property_details.listing_events for pre-trigger history.
Tax reassessment forecast IL · Partial reset (capped growth)
- Current annual tax
- $1,930 · $161/mo
- Projected year-2 tax
- $1,930 · $161/mo
- Expected delta
- $0/yr ($0/mo · 0.0%)
ⓘ Screening estimate from a state-policy table — verify with the county assessor before closing.
Climate risk First Street
- Flood 1/10 Low FEMA zone X (unshaded) · 0% chance over 30 yrs
- Wildfire 1/10 Low
- Heat 3/10 Moderate 7 d/yr ≥106°F today · 18 d/yr by 30 yrs out
- Wind 2/10 Low 2% chance of damaging wind over 30 yrs
- Air quality 2/10 Low 1 unhealthy d/yr today · 2 by 30 yrs out
Nearby sold comps map
Loading sold comps map…
Walkable amenities ~0.75 mi
Loading nearby amenities…
Taxation est. · year 1
- Rental income
- $19,304
- − Mortgage interest
- −$4,481
- − Property taxes
- −$1,930
- − Insurance
- −$400
- − Repairs & maintenance
- −$1,544
- − Management
- −$1,544
- − Depreciation
- −$2,327
- Taxable income
- $7,077
- Est. tax owed @ 24.0%
- −$1,698
- After-tax cash flow
- $6,187/yr
For passive investors: Depreciation is non-cash, so a rental often shows a tax loss while cash-flowing — sheltering income. Rental losses are passive: they offset passive income freely, and up to $25,000/yr can offset ordinary (W-2) income if you actively participate and your MAGI is under $100k (phasing out to $0 by $150k); unused losses carry forward. On sale, claimed depreciation is recaptured at up to 25%, and gains may owe capital-gains tax (a 1031 exchange can defer both). Figures are a year-1 estimate at your 24.0% rate — not tax advice; consult a CPA.
Schools (NCES district)
- District
- Bloomington SD 87
- NCES district ID
- 1706480
- Math proficiency
- 14% ▼ -7.00%
- Reading proficiency
- 19% ▼ -7.00%
- Median HH income
- $50,544
- Composite
- 15.05/100
- National rank
- #9351
- State rank
- #476 of 620 in IL
Livability — Bloomington
- Score
- 77/100
- State rank
- #161
- US rank
- #2987
Category grades
Schools grade is shown separately in the Schools card above.
Census & demographics
- Census place
- Bloomington, IL
- County
- McLean County · 126,490 people
- City population
- 72,415
- Metro
- Bloomington, IL
- Population (ZIP)
- 35,136
- Household income
- $57,130
- Rent vs Own
- Severe rent burden
- 1493.0
Population outlook (McLean County) Hauer SSP2
- Today (2025)
- 176,468 people
- By 2030
- 178,002 · +0.9%
- By 2040
- 178,592 · +1.2%
- By 2050
- 177,090 · +0.4%
- By 2075
- 173,224 · -1.8%
- By 2100
- 158,425 · -10.2%
Race, ethnicity, and origin ACS 2023
- Neighborhood character
- Predominantly White (70%)
- Race & ethnicity
- White 70% Black 13% Two or more races 9% Hispanic / Latino 9% Asian 3%
- Hispanic origin (detail)
- Mexican 7%
- Common ancestry
- Romanian 3% Slovak 2% Italian 1%
- Foreign-born
- 6% · Canada, Philippines, Vietnam
- Languages at home
- 91% English-only · Spanish 5% Other Asian/Pacific 1% Other Indo-European 1%
Political lean MEDSL · McLean
- 2024 margin
- Toss-up / Even · D 51.6% · R 46.8% · Other 1.6%
- 2008→2024 swing
- +3.7pp toward D · 2008: 1.2pp · 2024: 4.9pp
- All cycles
- 2024: D+4.9 2020: D+3.9 2016: R+1.5 2012: R+11.1 2008: D+1.2
Not yet ingested
- Civics
- —
Market trends
- HPI YoY
- ▼ -115.13%
- Current HPI
- 172.3659
- Rent YoY
- ▲ 5.60%
- Metro
- Bloomington, IL
- State GDP YoY
- ▲ 1.59%
- F500 in state
- 60
Industry mix (Fortune 500 HQ in IL)
| Industry | F500 HQs | Revenue |
|---|---|---|
| Insurance | 4 | $201B |
|
||
| Consumer Goods | 4 | $87B |
|
||
| Industrial Machinery | 3 | $64B |
|
||
| Healthcare | 2 | $55B |
|
||
| Retail / Pharmacy | 1 | $148B |
|
||
| Agriculture / Food | 1 | $86B |
|
||
Price history
-5.3% since first listed2 events — show timeline
- 2026-06-10 Listed $80,000 MRED as Distributed by MLS Grid
- 2005-04-25 Sold (Public Records) $84,500 Public Records
Property tax history
+3.8%/yrLatest (2023): $1,930 · +14.8% YoY. Source: county tax records.
Cash-flow waterfall
monthlySold comps — $/sqft
last 12 mo · ≤1 miLoading sold comps…