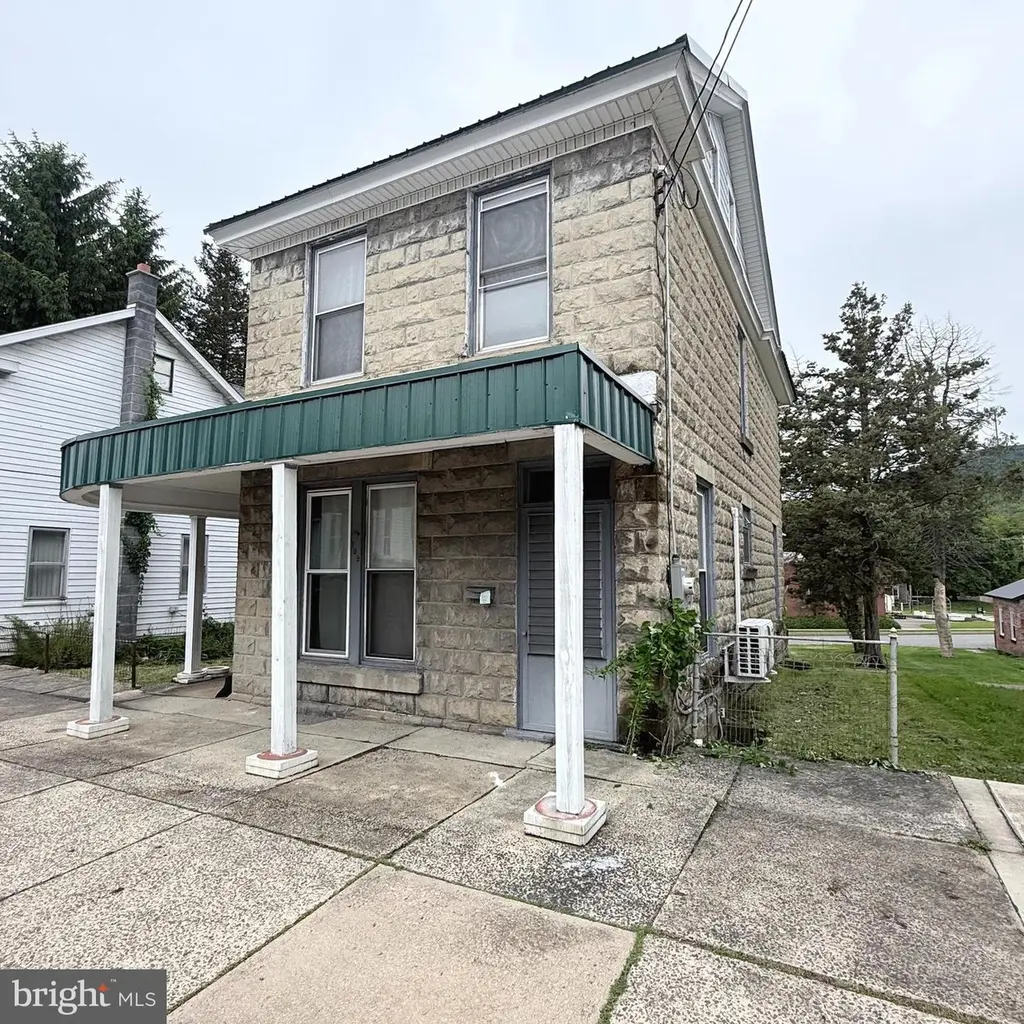
709 Main St · Lykens, PA
Flood risk 1/10 · Minimal
- FEMA flood zone
- X (unshaded)
- Chance of flooding over 30 yrs
- 0.0%
- Est. flood insurance / yr
- $473 – $860
Fire risk 3/10 · Minor
- Est. fire insurance / yr
- $511 – $949
Heat risk 5/10 · Moderate
- Hot days now (above 95°F)
- 8 days/yr
- Hot days in 30 yrs
- 17 days/yr
Wind risk 3/10 · Minor
- Chance of severe wind over 30 yrs
- 4.0%
Air-quality risk 2/10 · Minimal
- Unhealthy air days now
- 1 days/yr
- Unhealthy air days in 30 yrs
- 2 days/yr
Risk factors via First Street. Map © Google.
Why this score? — see what drove the B grade
The composite is a weighted blend of 9 inputs, each scored 0–100. Each bar is that input's sub-score; the figure is the points it added to the 100-point composite (weight × sub-score).
- Cash flow +30.0/30.0
- 1% rule +10.0/10.0
- DSCR +10.0/10.0
- ARV discount +7.5/15.0
- Appreciation +4.8/10.0
- Schools +3.9/10.0
- Livability +3.4/5.0
- Rent growth +2.5/5.0
- Condition / age +2.5/5.0
$80,000
🖨 Deal sheet 📄 Offer letter ✓ Due diligence
Listing remarks MLS
2.5 story stone home w/ pillared wrap-around porch, large deck & fenced yard. Double LR w/ beautiful original woodwork detail, an open stairway & archway w/ 9-1/2 ft ceilings. Oak Kit; first floor Laundry & 1/2 bath. New windows throughout. Updated 200 amp service. With some paint & carpets, this home will be complete.
Key facts
- Basement access
- Large yard
- Exterior deck
Tags
Property features AI
Finance
- Other: Fee simple ownership; Not in a federal flood zone; 2+ access exits (accessibility feature)
- HOA & community: Ground rent paid annually
Exterior
- Parking: Two off-street spaces; On-street parking available; Public/unpaved parking
- Utilities: Public water; Public sewer; 200+ amp electric service; Oil hot water; Cable TV available; Phone available; Municipal trash service
- Home design: Detached property
- Construction: Concrete construction; Block and concrete perimeter foundation; Double-pane windows; Building not winterized
- Exterior features: Exterior lighting; Gutter system; Sidewalks; Street lights; Deck(s); Porch(es); Roofed outdoor living area; Rear yard; Side yards
Interior
- Kitchen: Stove; Refrigerator
- Bedrooms: Three bedrooms on the upper level
- Flooring: Carpet; Vinyl
- Bathrooms: One full bathroom; One half bathroom
- Heating & cooling: Hot water baseboard heating; Heating fuel: oil and electric
- Interior features: Attic; Tub with shower; Ceiling fans; Traditional floor plan; Eat-in kitchen; Family room off kitchen; Storm door(s); Drywall and paneled walls; 9' plus ceilings
- Laundry & utility: Washer; Electric dryer; Main-floor laundry
Neighborhood map
What this means for you Summary
Snapshot
- This is a 3-bed/1.5-bath single-family listed at $80k.
Deal economics
- At list price, monthly cash flow is $389 ($5k/yr) — positive.
- The deal already cash-flows at list — no discount required.
- Meets the 1% rule at list price ($1k rent vs $80k).
Location & tenants
- Location reads 67/100 on livability (#969 in PA) — a middle-class / working-renter tenant base. Strengths: crime A+, cost of living A+, housing A+; Watch: amenities F, commute F, employment D-.
- Upper Dauphin Area SD (rural): math 37% / reading 55% proficiency, ranked #259 of 539 in PA (top 48%) — families likely to look elsewhere, expect single-tenant / working-renter base with shorter leases.
- Zoned schools: Upper Dauphin Area El Sch (math 42% / reading 62%, grade C-, #586 of 1,518 statewide, top 42%, 399 students, 52% FRL); Upper Dauphin Area Ms (math 25% / reading 52%, grade F, #275 of 512 statewide, top 55%, 312 students, 48% FRL); Upper Dauphin Area Hs (math 77%, 343 students, 47% FRL) — zoned schools average 49% FRL vs 32% district-wide (17 pts higher); higher-poverty schools than district average — tighter screening recommended.
- Market conditions: 26 active listings in the ZIP; 1 comparable units currently listed for rent nearby; 540 units permitted in Dauphin County in 2024 (194 in 5+ unit buildings).
Forward outlook
- In year one you build about $168 of equity ($553 loan paydown + $-385 appreciation (-0.5% local appreciation)).
- At projected returns (-0.5% appreciation + 3.0% rent growth), your $22k cash investment doubles in ~5 years — after that, you're playing with house money.
Negotiation context
- Only 5 days on market — expect competitive offers; lowballing is unlikely to land.
- 2 sale attempts since 21y ago with the ask held roughly flat each time — persistent listings suggest the price (not the market) is what's stuck; bring a comps-based counter.
- Current owner paid $37k; list at $80k implies a 116% gain — meaningful room to come down on a strong offer.
Risks & watch-outs
- Watch-outs: built in 1919 — expect roof / HVAC / electrical / plumbing capex.
- Climate carrying-cost: extreme-heat days projected 8→17/yr by 2055 (HVAC capex compounding) — expect insurance premiums to compound above CPI over the hold.
Questions for the listing agent
- Built in 1919 — when were the roof, HVAC, electrical panel, plumbing, and water heater last replaced?
- Is there a deadline driving the sale (1031 exchange, divorce, estate, relocation)? That informs how much negotiation room exists.
- Schools are D-rated, which usually means shorter tenancies and higher turnover. Who's the typical renter profile here, and what's been the actual vacancy rate?
- What's the average days-on-market for RENTAL listings here right now (not sales)? A rising rental-DOM trend means longer vacancies and softer asking-rent achievability than the comps imply.
- What's the recent tenant-quality profile in this submarket — average credit score on applications, eviction rate, late-payment / NSF rate, and stable-employment percentage? A property-management company in the area should have these aggregated.
- How much new for-sale + rental construction is in the pipeline within 1–3 miles? Heavy new supply typically softens prices + rents 12–24 months out; constrained supply supports both.
Investment metrics
- 1% rule
- 1.50% ✓
- Cap rate
- 12.13%
- Cash-on-cash
- 20.83%
- DSCR
- 1.93
- GRM
- 5.6
CMA / ARV
- ARV (on-the-fly)
- $196,840
- Comps found
- 11
Show comp detail 11 sales within ~0.75 mi
| Address | Dist | Beds/Ba | Sqft | Sold | Price | $/sf | Match |
|---|---|---|---|---|---|---|---|
| 767 Main St | 0.12mi | 3/1.5 | 1,603 (+8%) | 10mo | $120,000 | $75 | 72 |
| 711 Main St | 0.01mi | 4/1.5 (+1) | 1,664 (+12%) | 4mo | $222,000 | $133 | 70 |
| 312 Center St | 0.42mi | 3/1.5 | 1,575 (+6%) | 1mo | $228,100 | $145 | 68 |
| 521 S 2nd St | 0.31mi | 2/2.0 (-1) | 1,503 (+2%) | 11mo | $205,000 | $136 | 66 |
| 700 South St | 0.15mi | 3/1.0 | 1,316 (-11%) | 12mo | $165,000 | $125 | 63 |
| 454 S 2nd St | 0.39mi | 3/2.0 | 1,596 (+8%) | 10mo | $174,900 | $110 | 58 |
| 422 North St | 0.46mi | 3/2.0 | 1,636 (+10%) | 2mo | $287,000 | $175 | 57 |
| 433 S 2nd St | 0.43mi | 4/2.0 (+1) | 1,598 (+8%) | 7mo | $154,500 | $97 | 54 |
| 618 Park View Rd | 0.29mi | 3/1.5 | 1,296 (-12%) | 15mo | $234,000 | $181 | 53 |
| 822 Main St | 0.21mi | 3/1.5 | 1,265 (-14%) | 23mo | $175,000 | $138 | 47 |
| 312 Pottsville St | 0.58mi | 3/1.5 | 1,410 (-5%) | 23mo | $120,000 | $85 | 46 |
Match score weights: distance 35% · size 25% · config 20% · recency 20%. Top-matched comps best support the ARV.
Projected returns pro-forma
-0.48% appreciation · 3.0% rent growth · sell at horizon
- IRR
- 19.6%
- Equity multiple
- 1.92×
- Total profit
- $20,659
- Equity at exit
- $21,323
- IRR
- 24.5%
- Equity multiple
- 3.61×
- Total profit
- $58,488
- Equity at exit
- $24,156
Cash invested: $22,400 (down + closing). Projections, not guarantees.
Landlord ↔ Tenant lean methodology
- Overall (STATE)
- 62 Landlord-Friendly
- State Pennsylvania
- 62 Landlord-Friendly · EVEN
- County
- — inherits STATE
- City
- — inherits STATE
ZIP-level market 17048
- Home prices YoY
- -0.2%
- Active inventory
- 26
- Price-to-rent
- 5.6×
Monthly cashflow live
- Estimated rent
- $1,200 medium interval (Pro) →
- Mortgage (P&I)
- −$420
- Tax from tax record
- −$106 /mo · $1,275/yr
- Insurance
- −$33
- HOA
- −$0
- Vacancy / Maint / Mgmt
- −$252
- Net cashflow
- $389
Break-even live
UW: 25.0% down · 7.5% · 30yr · 1.5% tax · 5.0% vac · 8.0% maint · 8.0% mgmt
Financing live
Cash to close
- Down payment
- $20,000
- Closing costs
- $2,400
- Reserves months
- —
- Total cash needed
- —
Loan-product check · same deal, 3 products live
Conventional
25% down · 7.5% · 30yr
- Down + closing
- —
- Monthly P&I
- —
- Monthly cashflow
- —
- DSCR
- —
- Eligible?
- —
Personal DTI + credit; lowest rate.
DSCR
20% down · 8.5% · 30yr
- Down + closing
- —
- Monthly P&I
- —
- Monthly cashflow
- —
- DSCR
- —
- Eligible?
- —
No personal income docs; deal must DSCR.
Hard money
10% down · 12.0% · 12mo
- Down + closing
- —
- Monthly P&I
- —
- Monthly cashflow
- —
- DSCR
- —
- Eligible?
- —
Short-term bridge; refi at stabilization.
Rent comps 1 comps
| Address | Beds | Baths | Sqft | Rent | $/sqft | DOM | Units | Dist |
|---|---|---|---|---|---|---|---|---|
| 609 Spruce St Lykens, PA | 2.0 | 1.0 | 1404 | $1,200 | $0.85 | 43d | 1 | 0.09mi |
Listing history 8 events
-
2026-06-01status $80,000 Pending 5 DOM
-
2026-06-01days on market $80,000 Active 5 DOM
-
2026-05-31days on market $80,000 Active 4 DOM
-
2026-05-27$80,000 Active
-
2005-10-04soldstatus $37,000
-
2005-09-30soldstatus $37,000 344-char remark
Show marketing remark (344 chars)
2.5 story stone home w/ pillared wrap-around porch, large deck & fenced yard. Double LR w/ beautiful original woodwork detail, an open stairway & archway w/ 9-1/2 ft ceilings. Oak Kit; first floor Laundry & 1/2 bath. New windows throughout. Updated 200 amp service. With some paint & carpets, this home will be complete.
-
2005-04-08$49,900 344-char remark
Show marketing remark (344 chars)
2.5 story stone home w/ pillared wrap-around porch, large deck & fenced yard. Double LR w/ beautiful original woodwork detail, an open stairway & archway w/ 9-1/2 ft ceilings. Oak Kit; first floor Laundry & 1/2 bath. New windows throughout. Updated 200 amp service. With some paint & carpets, this home will be complete.
-
2005-04-08historical 344-char remark
Show marketing remark (344 chars)
2.5 story stone home w/ pillared wrap-around porch, large deck & fenced yard. Double LR w/ beautiful original woodwork detail, an open stairway & archway w/ 9-1/2 ft ceilings. Oak Kit; first floor Laundry & 1/2 bath. New windows throughout. Updated 200 amp service. With some paint & carpets, this home will be complete.
ⓘ Source: listings_history table (triggers on properties + properties_extension) + one-shot
backfill from property_details.listing_events for pre-trigger history.
Tax reassessment forecast PA · Partial reset (capped growth)
- Current annual tax
- $1,275 · $106/mo
- Projected year-2 tax
- $1,275 · $106/mo
- Expected delta
- $0/yr ($0/mo · 0.0%)
ⓘ Screening estimate from a state-policy table — verify with the county assessor before closing.
Climate risk First Street
- Flood 1/10 Low FEMA zone X (unshaded) · 0% chance over 30 yrs
- Wildfire 3/10 Moderate
- Heat 5/10 Major 8 d/yr ≥95°F today · 17 d/yr by 30 yrs out
- Wind 3/10 Moderate 4% chance of damaging wind over 30 yrs
- Air quality 2/10 Low 1 unhealthy d/yr today · 2 by 30 yrs out
Nearby sold comps map
Loading sold comps map…
Walkable amenities ~0.75 mi
Loading nearby amenities…
Taxation est. · year 1
- Rental income
- $14,400
- − Mortgage interest
- −$4,481
- − Property taxes
- −$1,275
- − Insurance
- −$400
- − Repairs & maintenance
- −$1,152
- − Management
- −$1,152
- − Depreciation
- −$2,327
- Taxable income
- $3,613
- Est. tax owed @ 24.0%
- −$867
- After-tax cash flow
- $3,800/yr
For passive investors: Depreciation is non-cash, so a rental often shows a tax loss while cash-flowing — sheltering income. Rental losses are passive: they offset passive income freely, and up to $25,000/yr can offset ordinary (W-2) income if you actively participate and your MAGI is under $100k (phasing out to $0 by $150k); unused losses carry forward. On sale, claimed depreciation is recaptured at up to 25%, and gains may owe capital-gains tax (a 1031 exchange can defer both). Figures are a year-1 estimate at your 24.0% rate — not tax advice; consult a CPA.
Schools (NCES district)
- District
- Upper Dauphin Area SD
- NCES district ID
- 4224360
- Math proficiency
- 37% ▼ -3.00%
- Reading proficiency
- 55% ▼ -8.00%
- Median HH income
- $48,201
- Composite
- 39.23/100
- National rank
- #4012
- State rank
- #259 of 539 in PA
Livability — Lykens
- Score
- 67/100
- State rank
- #969
- US rank
- #10571
Category grades
Schools grade is shown separately in the Schools card above.
Census & demographics
- Census place
- Lykens, PA
- Population (ZIP)
- 3,801
Population outlook (Dauphin County) Hauer SSP2
- Today (2025)
- 281,628 people
- By 2030
- 283,549 · +0.7%
- By 2040
- 285,385 · +1.3%
- By 2050
- 286,188 · +1.6%
- By 2075
- 291,053 · +3.3%
- By 2100
- 282,374 · +0.3%
Race, ethnicity, and origin ACS 2023
- Neighborhood character
- Predominantly White (88%)
- Race & ethnicity
- White 88% Two or more races 8% Hispanic / Latino 2% Asian 2%
- Common ancestry
- Polish 4% Romanian 3% Iranian 3%
- Foreign-born
- 1% · Canada, India
- Languages at home
- 88% English-only · German/W. Germanic 10% Spanish 2%
Political lean MEDSL · Dauphin
- 2024 margin
- Lean D (+5.9) · D 52.4% · R 46.5% · Other 1.1%
- 2008→2024 swing
- -3.1pp toward R · 2008: 9.1pp · 2024: 5.9pp
- All cycles
- 2024: D+5.9 2020: D+8.5 2016: D+2.8 2012: D+6.0 2008: D+9.1
Not yet ingested
- Civics
- —
Market trends
- HPI YoY
- ▼ -0.48%
- Current HPI
- 241.7628
- Rent YoY
- —
- Metro
- —
- State GDP YoY
- ▲ 1.68%
- F500 in state
- 34
Industry mix (Fortune 500 HQ in PA)
| Industry | F500 HQs | Revenue |
|---|---|---|
| Healthcare | 2 | $309B |
|
||
| Insurance | 2 | $27B |
|
||
| Telecommunications / Media | 1 | $124B |
|
||
| Industrial Distribution | 1 | $22B |
|
||
| Financial Services | 1 | $20B |
|
||
| Chemicals / Materials | 1 | $18B |
|
||
Price history
+60.3% since first listed5 events — show timeline
- 2026-05-27 Listed $80,000 BRIGHT MLS
- 2005-10-04 Sold (Public Records) $37,000 Public Records
- 2005-09-30 Sold (MLS) $37,000 BRIGHT MLS
- 2005-04-08 Listing Removed — BRIGHT MLS
- 2005-04-08 Listed $49,900 BRIGHT MLS
Property tax history
+2.2%/yrLatest (2026): $1,275 · +5.6% YoY. Source: county tax records.
Cash-flow waterfall
monthlySold comps — $/sqft
last 12 mo · ≤1 miLoading sold comps…