170 Newbury · Madison, MI
Flood risk 6/10 · Moderate
- FEMA flood zone
- X (unshaded)
- Chance of flooding over 30 yrs
- 0.7%
- Est. flood insurance / yr
- $507 – $1,088
Fire risk 3/10 · Minor
- Est. fire insurance / yr
- $784 – $1,456
Heat risk 3/10 · Minor
- Hot days now (above 98°F)
- 7 days/yr
- Hot days in 30 yrs
- 16 days/yr
Wind risk 2/10 · Minimal
- Chance of severe wind over 30 yrs
- —
Air-quality risk 2/10 · Minimal
- Unhealthy air days now
- 1 days/yr
- Unhealthy air days in 30 yrs
- 1 days/yr
Risk factors via First Street. Map © Google.
Why this score? — see what drove the C+ grade
The composite is a weighted blend of 9 inputs, each scored 0–100. Each bar is that input's sub-score; the figure is the points it added to the 100-point composite (weight × sub-score).
- Cash flow +26.9/30.0
- 1% rule +10.0/10.0
- DSCR +9.3/10.0
- ARV discount +7.5/15.0
- Schools +3.5/10.0
- Rent growth +2.5/5.0
- Livability +2.5/5.0
- Condition / age +2.5/5.0
- Appreciation +0.0/10.0
$75,000
🖨 Deal sheet 📄 Offer letter ✓ Due diligence
Listing remarks MLS
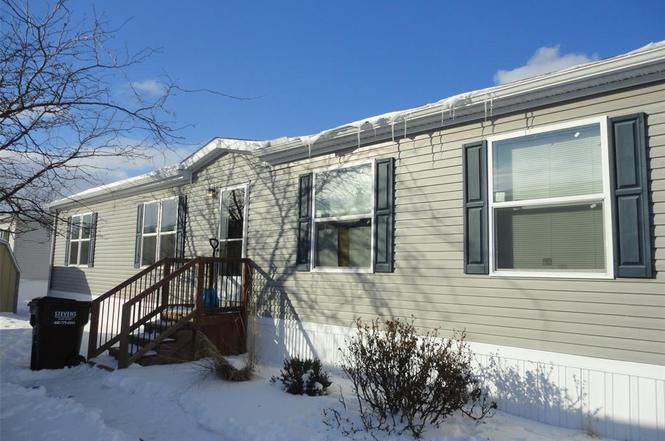
Beautiful manufactured home, like new inside, 3 bedrooms, 2 full baths, all appliances can be included with the sale of this home. Low lot rent only $490 a month. This is a 2021 manufactured home in Sterling Estates manufactured home park in Adrian, MI.
Key facts
- 3,600 sq ft lot
- Built 2021
- Listed 137 days
Property features AI
Finance
- Other: Located in Sterling Estates subdivision; Directions: US-223 to north on Division Street to east into Sterling Estates mobile home park
- Financial info:
- HOA & community: Homeowners association present; $490 monthly association fee
Exterior
- Parking: No garage; assigned parking
- Security:
- Utilities: Public water; Public sewer; Cable available; Underground utilities
- Home design: Single-family residence; One-level layout; Ground-level entry with steps
- Construction: Vinyl siding; Asphalt roof; Block and pier/pillar foundation; Built as a residential single-family home
- Exterior features: Paved road access; Pets allowed with breed restrictions; cats and dogs allowed; No pool
Interior
- Kitchen: Dishwasher; Free-standing gas range; Free-standing refrigerator
- Bedrooms:
- Flooring:
- Bathrooms: 2 full bathrooms
- Heating & cooling: Forced air heating (natural gas); No central cooling
- Interior features: Dishwasher; Dryer; Free-standing gas range; Free-standing refrigerator; Washer; 6 total rooms
- Laundry & utility: Washer and dryer included
Neighborhood map
What this means for you Summary
Snapshot
- This is a 3-bed/2.0-bath single-family listed at $75k.
Deal economics
- At list price, monthly cash flow is $207 ($2k/yr) — positive.
- The deal already cash-flows at list — no discount required.
- Meets the 1% rule at list price ($2k rent vs $75k).
- Recommended offer: $66k (12.0% below list) — sets the bar for market timing.
Location & tenants
- Location reads: area grade C — affects rentability + tenant quality, not the cash-flow math above.
- Madison School District (Lenawee) (town): math 34% / reading 51% proficiency, ranked #195 of 540 in MI (top 36%) — families likely to look elsewhere, expect single-tenant / working-renter base with shorter leases.
- Market conditions: 214 active listings in the ZIP; 137 units permitted in Lenawee County in 2024 (0 in 5+ unit buildings).
Forward outlook
- Local home prices are declining (-3.0%/yr); year-one equity from $519 of loan paydown is wiped out by about $2k of value loss. Plan a longer hold.
- Lenawee County population projected at -18% by 2050 — secular population decline; favor cash flow + early exit over multi-decade hold.
- At projected returns (-3.0% appreciation + 3.0% rent growth), your $21k cash investment doubles in ~10 years — after that, you're playing with house money.
Negotiation context
- It's been on market 138 days — a 12% lower offer ($66k) is reasonable based on typical stale-listing flexibility.
- 2 sale attempts; this cycle's ask has dropped $15k (17%) from the opening price — seller is motivated, your offer sets the floor, not the list.
Risks & watch-outs
- Watch-outs: HOA is 32% of rent.
- Climate carrying-cost: major flood risk — expect insurance premiums to compound above CPI over the hold.
Questions for the listing agent
- It's been on market 138 days. Have you received any prior offers? Is the seller open to a 12% concession, seller financing, or rate buy-down credit?
- What does the HOA fee cover, when was the last increase, and are there any pending special assessments or reserve-fund shortfalls?
- Why hasn't it sold? Are there any deal-killer items the seller is aware of (foundation, flood, title, zoning, code violations)?
- Is there a deadline driving the sale (1031 exchange, divorce, estate, relocation)? That informs how much negotiation room exists.
- What's the average days-on-market for RENTAL listings here right now (not sales)? A rising rental-DOM trend means longer vacancies and softer asking-rent achievability than the comps imply.
- What's the recent tenant-quality profile in this submarket — average credit score on applications, eviction rate, late-payment / NSF rate, and stable-employment percentage? A property-management company in the area should have these aggregated.
- How much new for-sale + rental construction is in the pipeline within 1–3 miles? Heavy new supply typically softens prices + rents 12–24 months out; constrained supply supports both.
Investment metrics
- 1% rule
- 2.05% ✓
- Cap rate
- 9.61%
- Cash-on-cash
- 11.85%
- DSCR
- 1.53
- GRM
- 4.1
CMA / ARV
- ARV (on-the-fly)
- $181,656
- Comps found
- 9
Show comp detail 9 sales within ~0.75 mi
| Address | Dist | Beds/Ba | Sqft | Sold | Price | $/sf | Match |
|---|---|---|---|---|---|---|---|
| 141 Concord | 0.07mi | 3/2.0 | 1,456 (-7%) | 6mo | $65,500 | $45 | 80 |
| 2502 Treat Hwy | 0.44mi | 3/2.0 | 1,622 (+4%) | 16mo | $226,101 | $139 | 61 |
| 110 E South St | 0.60mi | 4/1.5 (+1) | 1,595 (+2%) | 6mo | $170,000 | $107 | 57 |
| 917 E Beecher St | 0.68mi | 3/2.0 | 1,541 (-2%) | 12mo | $125,000 | $81 | 56 |
| 957 State St | 0.49mi | 3/2.0 | 1,705 (+9%) | 11mo | $198,000 | $116 | 54 |
| 1897 Allan St | 0.73mi | 3/2.0 | 1,440 (-8%) | 1mo | $250,000 | $174 | 52 |
| 656 James St | 0.68mi | 3/1.0 | 1,709 (+9%) | 6mo | $150,000 | $88 | 44 |
| 1894 Harold St | 0.63mi | 3/2.0 | 1,376 (-12%) | 8mo | $280,000 | $203 | 44 |
| 1822 Harold St | 0.63mi | 3/3.0 | 1,416 (-10%) | 23mo | $299,000 | $211 | 31 |
Match score weights: distance 35% · size 25% · config 20% · recency 20%. Top-matched comps best support the ARV.
Projected returns pro-forma
-3.0% appreciation · 3.0% rent growth · sell at horizon
- IRR
- 1.7%
- Equity multiple
- 1.07×
- Total profit
- $1,375
- Equity at exit
- $11,183
- IRR
- 11.6%
- Equity multiple
- 1.93×
- Total profit
- $19,518
- Equity at exit
- $6,485
Cash invested: $21,000 (down + closing). Projections, not guarantees.
Landlord ↔ Tenant lean methodology
- Overall (STATE)
- 62 Landlord-Friendly
- State Michigan
- 62 Landlord-Friendly · EVEN
- County
- — inherits STATE
- City
- — inherits STATE
ZIP-level market 49221
- Active inventory
- 214
- Price-to-rent
- 4.1×
Monthly cashflow live
- Estimated rent
- $1,539 medium interval (Pro) →
- Mortgage (P&I)
- −$393
- Tax est. 1.5%
- −$94 /mo · $1,125/yr
- Insurance
- −$31
- HOA
- −$490
- Vacancy / Maint / Mgmt
- −$323
- Net cashflow
- $207
Break-even live
UW: 25.0% down · 7.5% · 30yr · 1.5% tax · 5.0% vac · 8.0% maint · 8.0% mgmt
Financing live
Cash to close
- Down payment
- $18,750
- Closing costs
- $2,250
- Reserves months
- —
- Total cash needed
- —
Loan-product check · same deal, 3 products live
Conventional
25% down · 7.5% · 30yr
- Down + closing
- —
- Monthly P&I
- —
- Monthly cashflow
- —
- DSCR
- —
- Eligible?
- —
Personal DTI + credit; lowest rate.
DSCR
20% down · 8.5% · 30yr
- Down + closing
- —
- Monthly P&I
- —
- Monthly cashflow
- —
- DSCR
- —
- Eligible?
- —
No personal income docs; deal must DSCR.
Hard money
10% down · 12.0% · 12mo
- Down + closing
- —
- Monthly P&I
- —
- Monthly cashflow
- —
- DSCR
- —
- Eligible?
- —
Short-term bridge; refi at stabilization.
HOA detail
- Monthly dues
- $490 · $5,880/yr
Listing history 19 events
-
2026-06-18days on market $75,000 Active 138 DOM
-
2026-06-17days on market $75,000 Active 137 DOM
-
2026-06-16days on market $75,000 Active 136 DOM
-
2026-06-15days on market $75,000 Active 135 DOM
-
2026-06-13days on market $75,000 Active 133 DOM
-
2026-06-12days on market $75,000 Active 132 DOM
-
2026-06-09days on market $75,000 Active 129 DOM
-
2026-06-08days on market $75,000 Active 128 DOM
-
2026-06-07days on market $75,000 Active 127 DOM
-
2026-06-05days on market $75,000 Active 125 DOM
-
2026-06-04days on market $75,000 Active 123 DOM
-
2026-06-02days on market $75,000 Active 122 DOM
-
2026-06-01days on market $75,000 Active 121 DOM
-
2026-05-31days on market $75,000 Active 120 DOM
-
2026-05-31days on market $75,000 Active 119 DOM
-
2026-04-17price $75,000 253-char remark
Show marketing remark (253 chars)
Beautiful manufactured home, like new inside, 3 bedrooms, 2 full baths, all appliances can be included with the sale of this home. Low lot rent only $490 a month. This is a 2021 manufactured home in Sterling Estates manufactured home park in Adrian, MI.
-
2026-04-17price $75,000
Show marketing remark (253 chars)
Beautiful manufactured home, like new inside, 3 bedrooms, 2 full baths, all appliances can be included with the sale of this home. Low lot rent only $490 a month. This is a 2021 manufactured home in Sterling Estates manufactured home park in Adrian, MI.
-
2026-01-30$89,900 Active 253-char remark
Show marketing remark (253 chars)
Beautiful manufactured home, like new inside, 3 bedrooms, 2 full baths, all appliances can be included with the sale of this home. Low lot rent only $490 a month. This is a 2021 manufactured home in Sterling Estates manufactured home park in Adrian, MI.
-
2026-01-30$89,900 Active
Show marketing remark (253 chars)
Beautiful manufactured home, like new inside, 3 bedrooms, 2 full baths, all appliances can be included with the sale of this home. Low lot rent only $490 a month. This is a 2021 manufactured home in Sterling Estates manufactured home park in Adrian, MI.
ⓘ Source: listings_history table (triggers on properties + properties_extension) + one-shot
backfill from property_details.listing_events for pre-trigger history.
Climate risk First Street
- Flood 6/10 Major FEMA zone X (unshaded) · 70% chance over 30 yrs
- Wildfire 3/10 Moderate
- Heat 3/10 Moderate 7 d/yr ≥98°F today · 16 d/yr by 30 yrs out
- Wind 2/10 Low
- Air quality 2/10 Low 1 unhealthy d/yr today · 1 by 30 yrs out
Nearby sold comps map
Loading sold comps map…
Walkable amenities ~0.75 mi
Loading nearby amenities…
Taxation est. · year 1
- Rental income
- $18,465
- − Mortgage interest
- −$4,201
- − Property taxes
- −$1,125
- − Insurance
- −$375
- − Repairs & maintenance
- −$1,477
- − Management
- −$1,477
- − HOA
- −$5,880
- − Depreciation
- −$2,182
- Taxable income
- $1,748
- Est. tax owed @ 24.0%
- −$419
- After-tax cash flow
- $2,068/yr
For passive investors: Depreciation is non-cash, so a rental often shows a tax loss while cash-flowing — sheltering income. Rental losses are passive: they offset passive income freely, and up to $25,000/yr can offset ordinary (W-2) income if you actively participate and your MAGI is under $100k (phasing out to $0 by $150k); unused losses carry forward. On sale, claimed depreciation is recaptured at up to 25%, and gains may owe capital-gains tax (a 1031 exchange can defer both). Figures are a year-1 estimate at your 24.0% rate — not tax advice; consult a CPA.
Schools (NCES district)
- District
- Madison School District (Lenawee)
- NCES district ID
- 2622320
- Math proficiency
- 34% ▼ -10.00%
- Reading proficiency
- 51% ▼ -5.00%
- Median HH income
- $37,961
- Composite
- 35.35/100
- National rank
- #4959
- State rank
- #195 of 540 in MI
Livability — Madison
No livability data for this city. (Only ~50 U.S. cities are tracked.)
Census & demographics
- Population (ZIP)
- 41,041
Population outlook (Lenawee County) Hauer SSP2
- Today (2025)
- 95,497 people
- By 2030
- 92,722 · -2.9%
- By 2040
- 85,641 · -10.3%
- By 2050
- 77,971 · -18.4%
- By 2075
- 60,043 · -37.1%
- By 2100
- 41,468 · -56.6%
Race, ethnicity, and origin ACS 2023
- Neighborhood character
- Predominantly White (77%)
- Race & ethnicity
- White 77% Hispanic / Latino 14% Two or more races 8% Black 4%
- Hispanic origin (detail)
- Mexican 12%
- Common ancestry
- Romanian 3% Lithuanian 3% Italian 2%
- Foreign-born
- 3% · Canada
- Languages at home
- 93% English-only · Spanish 6% Arabic 1%
Political lean MEDSL · Lenawee
- 2024 margin
- Strong R (+23.0) · D 37.8% · R 60.8% · Other 1.4%
- 2008→2024 swing
- -28.1pp toward R · 2008: 5.1pp · 2024: -23.0pp
- All cycles
- 2024: R+23.0 2020: R+19.9 2016: R+21.1 2012: R+1.3 2008: D+5.1
Not yet ingested
- Civics
- —
Market trends
- HPI YoY
- ▼ -143.64%
- Current HPI
- 237.3796
- Rent YoY
- —
- Metro
- —
- State GDP YoY
- ▲ 1.37%
- F500 in state
- 28
Industry mix (Fortune 500 HQ in MI)
| Industry | F500 HQs | Revenue |
|---|---|---|
| Automotive Parts | 3 | $48B |
|
||
| Automotive | 2 | $372B |
|
||
| Chemicals | 1 | $45B |
|
||
| Automotive Retail | 1 | $29B |
|
||
| Healthcare / Medical Devices | 1 | $23B |
|
||
| Automotive Technology | 1 | $20B |
|
||
Price history
-16.6% since first listed4 events — show timeline
- 2026-04-17 Price Changed $75,000 MiRealSource-MiMLS
- 2026-04-17 Price Changed $75,000 REALCOMP
- 2026-01-30 Listed $89,900 REALCOMP
- 2026-01-30 Listed $89,900 MiRealSource-MiMLS
Cash-flow waterfall
monthlySold comps — $/sqft
last 12 mo · ≤1 miLoading sold comps…