 6-Plex
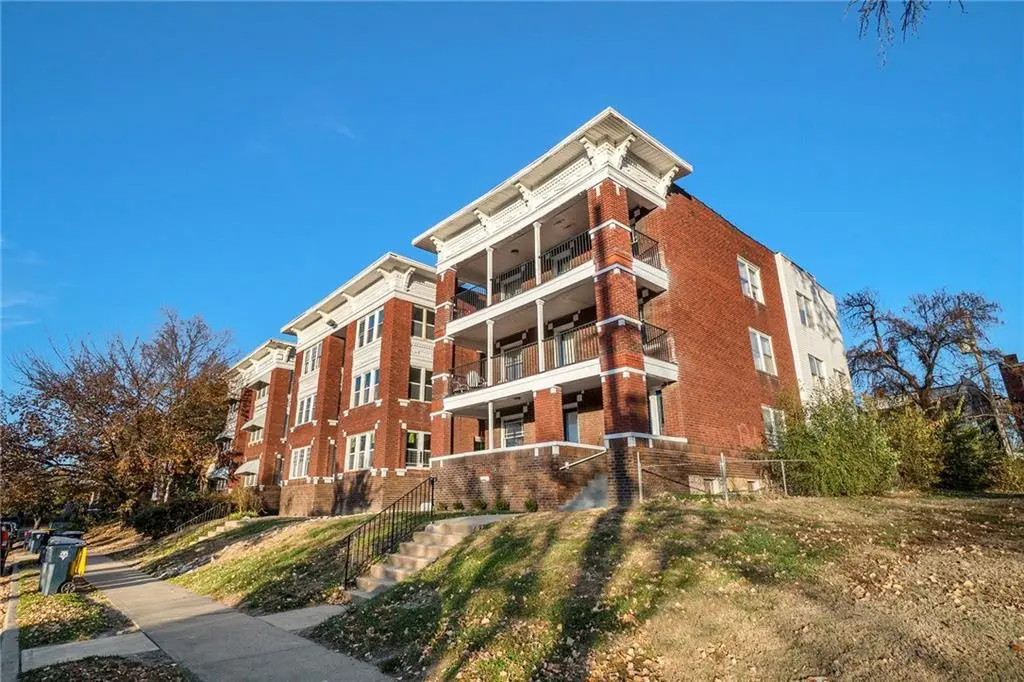
4121-4123 Walnut St · Kansas City, MO
Flood risk 1/10 · Minimal
- FEMA flood zone
- X (unshaded)
- Chance of flooding over 30 yrs
- 0.0%
- Est. flood insurance / yr
- $507 – $1,088
Fire risk 1/10 · Minimal
- Est. fire insurance / yr
- $1,054 – $1,958
Heat risk 4/10 · Minor
- Hot days now (above 106°F)
- 7 days/yr
- Hot days in 30 yrs
- 17 days/yr
Wind risk 2/10 · Minimal
- Chance of severe wind over 30 yrs
- —
Air-quality risk 3/10 · Minor
- Unhealthy air days now
- 2 days/yr
- Unhealthy air days in 30 yrs
- 3 days/yr
Risk factors via First Street. Map © Google.
Why this score? — see what drove the D grade
The composite is a weighted blend of 9 inputs, each scored 0–100. Each bar is that input's sub-score; the figure is the points it added to the 100-point composite (weight × sub-score).
- Cash flow +19.2/30.0
- DSCR +6.1/10.0
- 1% rule +5.1/10.0
- Condition / age +4.0/5.0
- Livability +3.9/5.0
- Rent growth +3.4/5.0
- Schools +1.5/10.0
- ARV discount +0.6/15.0
- Appreciation +0.0/10.0
$825,000
🖨 Deal sheet 📄 Offer letter ✓ Due diligence
Multi-family units
County records classify this as Multi-Family (5+ Unit). Listing-text estimate: 6 units. confirmed
5+ unit building — per-unit beds/baths from public records are typically unavailable; the breakdown below (if shown) is an estimate from the listing text.
Listing remarks MLS
A+ location!!! Welcome to Walnut Six a charming brick building in the heart of all the action. The location does not get any more prime, steps to the new streetcar line, walking distance to dozens of excellent restaurants, and half a block from Starbucks. Not many locations in Kansas City qualify as a walker’s paradise with a 90+ walk score! All six units are large two-bedroom + one bath with central heat and window AC. 4/6 units have fresh renovations while two are in a more classic condition. 100% new windows in 2025 let in ample natural light. Parking lot in the back of the building, although so walkable that a car is optional. Works as a long-term rental or consider turning some of the units into medium-term furnished rentals. Do not miss your opportunity to own this Kansas City gem! Why we love it? All large 2 bed units! Ability to add laundry in unit or in common basement. Some parking available in back and ample street parking out front. All units were vacated during reno and 5 of the 6 have been leased up quickly with great new tenants. We are keeping one unit vacant for showings. Info is reliable but not guaranteed. No seller/creative financing please do not ask.
Key facts
- Fresh renovations
- New streetcar line
- 100% new windows
Tags
Neighborhood map
What this means for you Summary
Snapshot
- This is a 6 × 2-bed/1.0-bath units multifamily listed at $825k. Condition is rated good.
Deal economics
- At list price, monthly cash flow is $890 ($11k/yr) — positive. Per door: $148/mo.
- The deal already cash-flows at list — no discount required.
- Meets the 1% rule at list price ($8k rent vs $825k).
- Recommended offer: $751k (9.0% below list) — sets the bar for market timing.
- Cap rate 7.6% vs local median 3.9% in Kansas City — top-decile yield for the area; either an underpriced asset or a hidden risk that comps aren't pricing in. Stress-test before assuming the spread holds.
Location & tenants
- Location reads 78/100 on livability (#28 in MO, #2,671 nationally) — a middle-class / working-renter tenant base. Strengths: amenities A+, commute A+, cost of living A+; Watch: schools C-, crime F.
- Kansas City 33 (urban): math 12% / reading 24% proficiency, ranked #308 of 324 in MO (top 95%) — low school quality limits family demand, transient renter base, plan for 1-2y turnover; 75% free/reduced lunch — lower-income household profile, screen leases tightly.
- Market conditions: Rents rising (+3.4%/yr); 162 active listings in the ZIP; 4,002 units permitted in Jackson County in 2024 (2,271 in 5+ unit buildings).
- At $8,343/mo this rent would consume 162% of the median local household income ($62k/yr) (locally 1606% of renters already pay >50% of income on rent) — very limited rent-growth headroom before tenants either downsize or default.
Forward outlook
- Local home prices are declining (-3.0%/yr); year-one equity from $6k of loan paydown is wiped out by about $25k of value loss. Plan a longer hold.
- Jackson County population projected at +4% by 2050 — modest demand growth; plan on rents tracking national, not racing it.
Negotiation context
- It's been on market 115 days — a 9% lower offer ($751k) is reasonable based on typical stale-listing flexibility.
Risks & watch-outs
- Watch-outs: built in 1915 — expect roof / HVAC / electrical / plumbing capex.
Questions for the listing agent
- It's been on market 115 days. Have you received any prior offers? Is the seller open to a 9% concession, seller financing, or rate buy-down credit?
- Can we see the unit-by-unit rent roll, current vacancy, and any below-market leases? What's the average tenancy length?
- What capital expenditures (roof, boiler, parking lot, exteriors) have been made in the last 5 years, and what's planned in the next 2?
- Built in 1915 — when were the roof, HVAC, electrical panel, plumbing, and water heater last replaced?
- Why hasn't it sold? Are there any deal-killer items the seller is aware of (foundation, flood, title, zoning, code violations)?
- Is there a deadline driving the sale (1031 exchange, divorce, estate, relocation)? That informs how much negotiation room exists.
- Crime grade is F in this area — have there been break-ins, vandalism, or insurance claims at this property in the last 3 years? What carrier currently insures it and at what premium?
- The area grade is low — what's the realistic commute time and amenity access for the typical tenant pool here? Any planned neighborhood developments (good or bad) we should know about?
- What's the average days-on-market for RENTAL listings here right now (not sales)? A rising rental-DOM trend means longer vacancies and softer asking-rent achievability than the comps imply.
- What's the recent tenant-quality profile in this submarket — average credit score on applications, eviction rate, late-payment / NSF rate, and stable-employment percentage? A property-management company in the area should have these aggregated.
- How much new apartment / multifamily construction is in the pipeline within 1–3 miles? Heavy new supply (>2% of stock underway) typically softens rents 12–24 months out; light construction supports rent growth.
Investment metrics
- 1% rule
- 1.01% ✓
- Cap rate
- 7.59%
- Cash-on-cash
- 4.62%
- DSCR
- 1.21
- GRM
- 8.2
CMA / ARV
- ARV (median comp)
- $715,356
- List price
- $825,000
- Delta
- 15.33%
- Verdict
- OVERPRICED
- Comps
- 20 within 1.0 mi
Show comp detail 3 sales within ~0.75 mi
| Address | Dist | Beds/Ba | Sqft | Sold | Price | $/sf | Match |
|---|---|---|---|---|---|---|---|
| 4200 Harrison St | 0.59mi | 12/7.0 | — | 2mo | $799,000 | — | 54 |
| 1007 W 41st St | 0.73mi | 12/6.0 | 5,075 | 12mo | $800,000 | $158 | 43 |
| 3943 Troost Ave | 0.74mi | 12/7.0 | — | 17mo | $595,000 | — | 35 |
Match score weights: distance 35% · size 25% · config 20% · recency 20%. Top-matched comps best support the ARV.
Projected returns pro-forma
-3.0% appreciation · 3.42% rent growth · sell at horizon
- IRR
- -8.6%
- Equity multiple
- 0.68×
- Total profit
- $-73,361
- Equity at exit
- $123,010
- IRR
- 1.5%
- Equity multiple
- 1.10×
- Total profit
- $24,238
- Equity at exit
- $71,331
Cash invested: $231,000 (down + closing). Projections, not guarantees.
Landlord ↔ Tenant lean methodology
- Overall (STATE)
- 81 Strongly Landlord-Friendly
- State Missouri
- 81 Strongly Landlord-Friendly · R+10
- County
- — inherits STATE
- City
- — inherits STATE
ZIP-level market 64111
- Rents YoY
- 3.4%
- Active inventory
- 162
- Price-to-rent
- 49.4×
Monthly cashflow live
- Estimated rent
- $8,343 high interval (Pro) →
- Mortgage (P&I)
- −$4,326
- Tax est. 1.5%
- −$1,031 /mo · $12,375/yr
- Insurance
- −$344
- HOA
- −$0
- Vacancy / Maint / Mgmt
- −$1,752
- Net cashflow
- $890
Break-even live
6-unit breakdown (identical units grouped — click to expand)
| Units | Beds | Baths | Est. rent |
|---|---|---|---|
| 6× units | 2 | 1 | $8,340 |
| #1 | 2 | 1 | $1,390 |
| #2 | 2 | 1 | $1,390 |
| #3 | 2 | 1 | $1,390 |
| #4 | 2 | 1 | $1,390 |
| #5 | 2 | 1 | $1,390 |
| #6 | 2 | 1 | $1,390 |
| Total (6 units) | $8,343 | ||
UW: 25.0% down · 7.5% · 30yr · 1.5% tax · 5.0% vac · 8.0% maint · 8.0% mgmt
Financing live
Cash to close
- Down payment
- $206,250
- Closing costs
- $24,750
- Reserves months
- —
- Total cash needed
- —
Loan-product check · same deal, 3 products live
Conventional
25% down · 7.5% · 30yr
- Down + closing
- —
- Monthly P&I
- —
- Monthly cashflow
- —
- DSCR
- —
- Eligible?
- —
Personal DTI + credit; lowest rate.
DSCR
20% down · 8.5% · 30yr
- Down + closing
- —
- Monthly P&I
- —
- Monthly cashflow
- —
- DSCR
- —
- Eligible?
- —
No personal income docs; deal must DSCR.
Hard money
10% down · 12.0% · 12mo
- Down + closing
- —
- Monthly P&I
- —
- Monthly cashflow
- —
- DSCR
- —
- Eligible?
- —
Short-term bridge; refi at stabilization.
Listing history 15 events
-
2026-06-18days on market $825,000 Active 115 DOM
-
2026-06-17days on market $825,000 Active 114 DOM
-
2026-06-16days on market $825,000 Active 113 DOM
-
2026-06-15days on market $825,000 Active 112 DOM
-
2026-06-13days on market $825,000 Active 110 DOM
-
2026-06-09days on market $825,000 Active 106 DOM
-
2026-06-08days on market $825,000 Active 105 DOM
-
2026-06-07days on market $825,000 Active 104 DOM
-
2026-06-05days on market $825,000 Active 101 DOM
-
2026-06-03days on market $825,000 Active 100 DOM
-
2026-06-02days on market $825,000 Active 99 DOM
-
2026-06-01days on market $825,000 Active 98 DOM
-
2026-05-31days on market $825,000 Active 97 DOM
-
2026-05-13price $825,000 1199-char remark
Show marketing remark (1199 chars)
A+ location!!! Welcome to Walnut Six a charming brick building in the heart of all the action. The location does not get any more prime, steps to the new streetcar line, walking distance to dozens of excellent restaurants, and half a block from Starbucks. Not many locations in Kansas City qualify as a walker’s paradise with a 90+ walk score! All six units are large two-bedroom + one bath with central heat and window AC. 4/6 units have fresh renovations while two are in a more classic condition. 100% new windows in 2025 let in ample natural light. Parking lot in the back of the building, although so walkable that a car is optional. Works as a long-term rental or consider turning some of the units into medium-term furnished rentals. Do not miss your opportunity to own this Kansas City gem! Why we love it? All large 2 bed units! Ability to add laundry in unit or in common basement. Some parking available in back and ample street parking out front. All units were vacated during reno and 5 of the 6 have been leased up quickly with great new tenants. We are keeping one unit vacant for showings. Info is reliable but not guaranteed. No seller/creative financing please do not ask.
-
2026-02-23$849,000 Active 1199-char remark
Show marketing remark (1199 chars)
A+ location!!! Welcome to Walnut Six a charming brick building in the heart of all the action. The location does not get any more prime, steps to the new streetcar line, walking distance to dozens of excellent restaurants, and half a block from Starbucks. Not many locations in Kansas City qualify as a walker’s paradise with a 90+ walk score! All six units are large two-bedroom + one bath with central heat and window AC. 4/6 units have fresh renovations while two are in a more classic condition. 100% new windows in 2025 let in ample natural light. Parking lot in the back of the building, although so walkable that a car is optional. Works as a long-term rental or consider turning some of the units into medium-term furnished rentals. Do not miss your opportunity to own this Kansas City gem! Why we love it? All large 2 bed units! Ability to add laundry in unit or in common basement. Some parking available in back and ample street parking out front. All units were vacated during reno and 5 of the 6 have been leased up quickly with great new tenants. We are keeping one unit vacant for showings. Info is reliable but not guaranteed. No seller/creative financing please do not ask.
ⓘ Source: listings_history table (triggers on properties + properties_extension) + one-shot
backfill from property_details.listing_events for pre-trigger history.
Climate risk First Street
- Flood 1/10 Low FEMA zone X (unshaded) · 0% chance over 30 yrs
- Wildfire 1/10 Low
- Heat 4/10 Moderate 7 d/yr ≥106°F today · 17 d/yr by 30 yrs out
- Wind 2/10 Low
- Air quality 3/10 Moderate 2 unhealthy d/yr today · 3 by 30 yrs out
Nearby sold comps map
Loading sold comps map…
Walkable amenities ~0.75 mi
Loading nearby amenities…
Taxation est. · year 1
- Rental income
- $100,116
- − Mortgage interest
- −$46,213
- − Property taxes
- −$12,375
- − Insurance
- −$4,125
- − Repairs & maintenance
- −$8,009
- − Management
- −$8,009
- − Depreciation
- −$24,000
- Taxable loss
- −$2,615
- Est. tax savings @ 24.0%
- +$628
- After-tax cash flow
- $11,303/yr
For passive investors: Depreciation is non-cash, so a rental often shows a tax loss while cash-flowing — sheltering income. Rental losses are passive: they offset passive income freely, and up to $25,000/yr can offset ordinary (W-2) income if you actively participate and your MAGI is under $100k (phasing out to $0 by $150k); unused losses carry forward. On sale, claimed depreciation is recaptured at up to 25%, and gains may owe capital-gains tax (a 1031 exchange can defer both). Figures are a year-1 estimate at your 24.0% rate — not tax advice; consult a CPA.
Condition & rehab AI · 6 photos
A charming brick building with good condition and fresh renovations, located in a prime location. Potential for further value through landscaping and interior updates.
Value-add opportunities
- Both Landscaping improvements — Enhances curb appeal and adds value
- Both Painting — Fresh paint can make a significant difference in appearance
- Both Flooring in bedrooms — Hardwood floors in living area are nice, but bedrooms could benefit from similar flooring
Renovation cost estimate screening
Value-add ROI direction
- Both Landscaping improvements — Enhances curb appeal and adds value ↑
- Both Painting — Fresh paint can make a significant difference in appearance ↑
- Both Flooring in bedrooms — Hardwood floors in living area are nice, but bedrooms could benefit from similar flooring ↑
ⓘ Cost ranges are severity-bucket heuristics (US national rule-of-thumb). Get contractor quotes + a written scope before underwriting a rehab budget.
Schools (NCES district)
- District
- Kansas City 33
- NCES district ID
- 2916400
- Math proficiency
- 12% ▼ -8.00%
- Reading proficiency
- 24% ▬ 0.00%
- Median HH income
- $35,227
- Composite
- 14.8/100
- National rank
- #9387
- State rank
- #308 of 324 in MO
Livability — Kansas City
- Score
- 78/100
- State rank
- #28
- US rank
- #2671
Category grades
Schools grade is shown separately in the Schools card above.
Census & demographics
- Census place
- Kansas City, MO
- County
- Jackson County · 687,798 people
- City population
- 439,467
- Metro
- Kansas City, MO-KS
- Population (ZIP)
- 16,887
- Household income
- $61,729
- Rent vs Own
- Severe rent burden
- 1606.0
Population outlook (Jackson County) Hauer SSP2
- Today (2025)
- 719,589 people
- By 2030
- 731,456 · +1.6%
- By 2040
- 746,689 · +3.8%
- By 2050
- 749,289 · +4.1%
- By 2075
- 736,227 · +2.3%
- By 2100
- 668,210 · -7.1%
Race, ethnicity, and origin ACS 2023
- Neighborhood character
- Predominantly White (70%)
- Race & ethnicity
- White 70% Hispanic / Latino 10% Black 10% Two or more races 9% Asian 3%
- Hispanic origin (detail)
- Mexican 8%
- Common ancestry
- Lithuanian 3% Slovak 2% Serbian 2%
- Foreign-born
- 6% · Canada, China
- Languages at home
- 90% English-only · Spanish 5% Other Asian/Pacific 1% Chinese 1%
Political lean MEDSL · Jackson
- 2024 margin
- D (+19.3) · D 58.9% · R 39.5% · Other 1.6%
- 2008→2024 swing
- -6.1pp toward R · 2008: 25.4pp · 2024: 19.3pp
- All cycles
- 2024: D+19.3 2020: D+22.0 2016: D+16.6 2012: D+19.0 2008: D+25.4
Not yet ingested
- Civics
- —
Market trends
- HPI YoY
- ▼ -341.84%
- Current HPI
- 282.068
- Rent YoY
- ▲ 3.42%
- Metro
- Kansas City, MO-KS
- State GDP YoY
- ▲ 1.84%
- F500 in state
- 20
Industry mix (Fortune 500 HQ in MO)
| Industry | F500 HQs | Revenue |
|---|---|---|
| Healthcare | 1 | $163B |
|
||
| Insurance | 1 | $21B |
|
||
| Industrial Technology | 1 | $17B |
|
||
| Retail | 1 | $16B |
|
||
| Industrial Distribution | 1 | $10B |
|
||
| Utilities | 1 | $9B |
|
||
Price history
-2.8% since first listed2 events — show timeline
- 2026-05-13 Price Changed $825,000 Heartland MLS as Distributed by MLS Grid
- 2026-02-23 Listed $849,000 Heartland MLS as Distributed by MLS Grid
Cash-flow waterfall
monthlySold comps — $/sqft
last 12 mo · ≤1 miLoading sold comps…