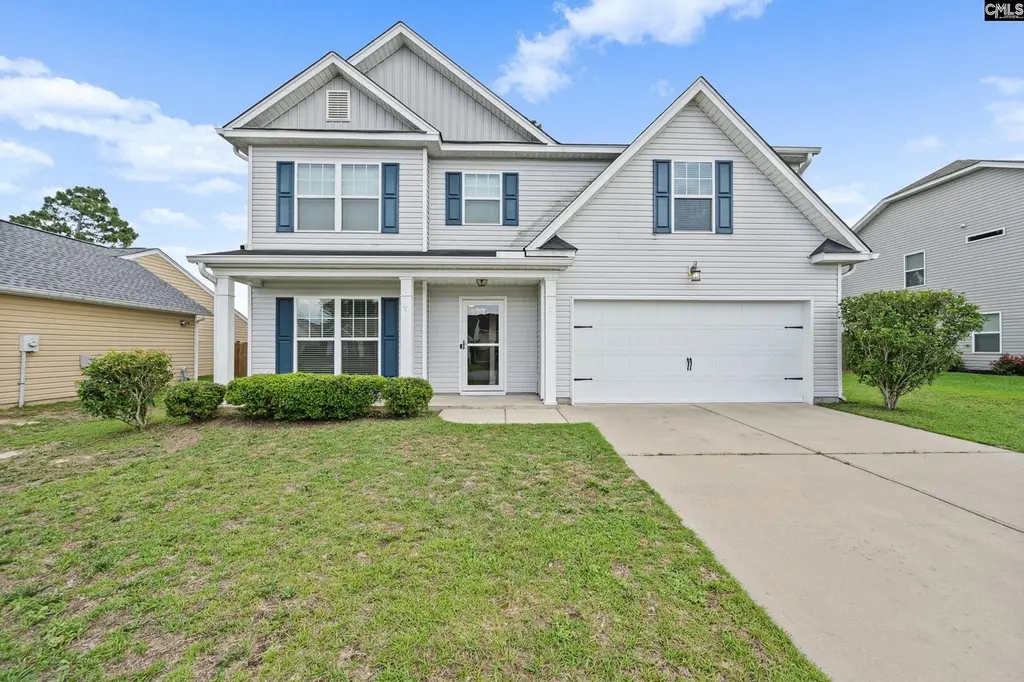
123 Castlefield Dr · Red Bank, SC
Flood risk 1/10 · Minimal
- FEMA flood zone
- X (unshaded)
- Chance of flooding over 30 yrs
- 0.0%
- Est. flood insurance / yr
- $507 – $1,088
Fire risk 5/10 · Moderate
- Est. fire insurance / yr
- $783 – $1,453
Heat risk 7/10 · Major
- Hot days now (above 108°F)
- 7 days/yr
- Hot days in 30 yrs
- 16 days/yr
Wind risk 6/10 · Moderate
- Chance of severe wind over 30 yrs
- 65.0%
Air-quality risk 3/10 · Minor
- Unhealthy air days now
- 2 days/yr
- Unhealthy air days in 30 yrs
- 2 days/yr
Risk factors via First Street. Map © Google.
Why this score? — see what drove the D grade
The composite is a weighted blend of 9 inputs, each scored 0–100. Each bar is that input's sub-score; the figure is the points it added to the 100-point composite (weight × sub-score).
- Cash flow +10.9/30.0
- ARV discount +7.5/15.0
- Appreciation +5.0/10.0
- Schools +4.2/10.0
- Livability +3.3/5.0
- DSCR +3.2/10.0
- Rent growth +2.5/5.0
- Condition / age +2.5/5.0
- 1% rule +2.1/10.0
$325,000
🖨 Deal sheet (PDF) 📄 Offer letter ✓ Due diligence
Listing remarks
Welcome to 123 Castlefield, a beautifully appointed 4-bedroom, 3 full Bath home offering 2,740st ft nestled in the heart of Lexington. Thoughtfully designed for both entertaining and everyday living, this exceptional residence offers an impressive blend of formal elegance and open, casual comfort. Step inside to find a gracious formal living room, ideal for hosting guests, alongside a stunning open concept living area that flows seamlessly into the gourmet kitchen. The kitchen features generous counter space, ample cabinetry, and a layout perfect for the home chef, all opening to the main living space to keep everyone connected. Upstairs, a spacious bonus room provides endless flexibility,
Key facts
- Wide open backyard
- Gourmet kitchen
- Spacious bonus room
Tags
Property features AI
Finance
- Other: Paved road access
- HOA & community: Property is part of an association
Exterior
- Parking: Attached garage with 2 parking spaces (garage on main level)
- Utilities: Public water; Public sewer
- Home design: Two-story home; Vinyl exterior finish
- Construction: Slab foundation
- Exterior features: Shed; Full gutters; Rear wood privacy fence
Interior
- Kitchen: Eat-in kitchen with island; Pantry; Tile flooring; Wood cabinets (other); Quartz countertops; Dishwasher, Refrigerator, Microwave (above stove)
- Bedrooms: Master bedroom with double vanity, private bath and walk-in closet (Second level); Bedroom 2 with private bath and tub/shower, carpeted (Main level); Bedroom 3 with tub/shower, private closet, carpeted (Second level); Bedroom 4 with tub/shower, private closet, carpeted (Second level)
- Flooring: Carpet in bedrooms; Concrete in living room; Vinyl in formal living room; Tile in kitchen
- Bathrooms: Three full bathrooms total; Two additional full secondary bathrooms; One full main bathroom
- Heating & cooling: Central air conditioning; Floor furnace heating
- Interior features: Ceiling fans in master bedroom, living room, and bedrooms; Concrete floors in living room; Vinyl flooring in formal living room; Dishwasher, Refrigerator, Microwave (above stove)
- Laundry & utility: Laundry in heated utility room (Washer/Dryer located on Second level)
Neighborhood map
What this means for you Summary
Snapshot
- This is a 3-bed/2.5-bath single-family listed at $325k.
Deal economics
- At list price, monthly cash flow is $-142 ($-2k/yr) — negative.
- To cash-flow at today's rent, offer at most $300k (7.7% below list).
- To meet the 1% rule (rent ≥ 1% of price), the offer needs to be $230k (29.3% below list).
- Recommended offer: $230k (29.3% below list) — sets the bar for 1% rule.
Location & tenants
- Location reads 66/100 on livability (#121 in SC) — a middle-class / working-renter tenant base. Strengths: cost of living A+, housing A+, health & safety B; Watch: employment C-, crime D+, amenities F.
- Lexington 01 (suburban): math 42% / reading 53% proficiency, ranked #11 of 80 in SC (top 14%) — families likely to look elsewhere, expect single-tenant / working-renter base with shorter leases.
- Zoned schools: Saxe Gotha Elementary (math 35% / reading 40%, grade F, #311 of 597 statewide, top 53%, 686 students, 100% FRL); White Knoll Middle (math 19% / reading 31%, grade F, #165 of 229 statewide, top 72%, 816 students, 52% FRL); White Knoll High (math 47% / reading 85%, grade B, #81 of 196 statewide, top 42%, 2,204 students, 45% FRL) — zoned schools average 66% FRL vs 30% district-wide (36 pts higher); higher-poverty schools than district average — tighter screening recommended.
- Market conditions: 1 active listings in the ZIP; 1 comparable units currently listed for rent nearby; 1,712 units permitted in Lexington County in 2024 (0 in 5+ unit buildings).
Forward outlook
- In year one you build about $12k of equity ($2k loan paydown + $10k appreciation (3.0% local appreciation)).
- Lexington County population projected at +26% by 2050 — long-run rental-demand tailwind backs the buy-and-hold thesis.
- By year 4, paydown + projected appreciation supports a ~$41k cash-out refi (75% LTV) — recoverable capital for the next deal without selling this one.
Negotiation context
- It's been on market 17 days — a 2% lower offer ($320k) is reasonable based on typical stale-listing flexibility.
- 2 sale attempts with the ask held roughly flat each time — persistent listings suggest the price (not the market) is what's stuck; bring a comps-based counter.
Risks & watch-outs
- Climate carrying-cost: major wind risk, 65% chance of damaging wind over 30y; moderate wildfire risk; extreme-heat days projected 7→16/yr by 2055 (HVAC capex compounding) — expect insurance premiums to compound above CPI over the hold.
Questions for the listing agent
- What do current leases actually rent for vs. the listed asking? Can we see a recent rent roll and the last 12 months of T-12 income?
- What does the HOA fee cover, when was the last increase, and are there any pending special assessments or reserve-fund shortfalls?
- Is there a deadline driving the sale (1031 exchange, divorce, estate, relocation)? That informs how much negotiation room exists.
- Schools are F-rated, which usually means shorter tenancies and higher turnover. Who's the typical renter profile here, and what's been the actual vacancy rate?
- Crime grade is D in this area — have there been break-ins, vandalism, or insurance claims at this property in the last 3 years? What carrier currently insures it and at what premium?
- The area grade is low — what's the realistic commute time and amenity access for the typical tenant pool here? Any planned neighborhood developments (good or bad) we should know about?
- What's the average days-on-market for RENTAL listings here right now (not sales)? A rising rental-DOM trend means longer vacancies and softer asking-rent achievability than the comps imply.
- What's the recent tenant-quality profile in this submarket — average credit score on applications, eviction rate, late-payment / NSF rate, and stable-employment percentage? A property-management company in the area should have these aggregated.
- How much new for-sale + rental construction is in the pipeline within 1–3 miles? Heavy new supply typically softens prices + rents 12–24 months out; constrained supply supports both.
Investment metrics
- 1% rule
- 0.71% ✗
- Cap rate
- 5.77%
- Cash-on-cash
- -1.87%
- DSCR
- 0.92
- GRM
- 11.8
CMA / ARV
No comps found within radius.
Projected returns pro-forma
3.0% appreciation · 3.0% rent growth · sell at horizon
- IRR
- 5.7%
- Equity multiple
- 1.33×
- Total profit
- $29,983
- Equity at exit
- $146,134
- IRR
- 8.7%
- Equity multiple
- 2.31×
- Total profit
- $119,241
- Equity at exit
- $225,210
Cash invested: $91,000 (down + closing). Projections, not guarantees.
Landlord ↔ Tenant lean methodology
- Overall (STATE)
- 90 Strongly Landlord-Friendly
- State South Carolina
- 90 Strongly Landlord-Friendly · R+6
- County
- — inherits STATE
- City
- — inherits STATE
ZIP-level market 29073-6843
- Active inventory
- 1
- Price-to-rent
- 11.8×
Monthly cashflow live
- Estimated rent
- $2,299 medium interval (Pro) →
- Mortgage (P&I)
- −$1,704
- Tax from tax record
- −$101 /mo · $1,214/yr
- Insurance
- −$135
- HOA
- −$17
- Vacancy / Maint / Mgmt
- −$483
- Net cashflow
- $-142
Break-even live
Sensitivity live
| Price | -10% $42 | -5% $-50 | +0% $-142 | +5% $-234 | +10% $-326 |
|---|---|---|---|---|---|
| Rent | -10% $-323 | -5% $-233 | +0% $-142 | +5% $-51 | +10% $40 |
| Rate | -1.0pp $22 | -0.5pp $-59 | base $-142 | +0.5pp $-226 | +1.0pp $-312 |
UW: 25.0% down · 7.5% · 30yr · 1.5% tax · 5.0% vac · 8.0% maint · 8.0% mgmt
Financing live
Cash to close
- Down payment
- $81,250
- Closing costs
- $9,750
- Reserves months
- —
- Total cash needed
- —
Loan-product check · same deal, 3 products live
Conventional
25% down · 7.5% · 30yr
- Down + closing
- —
- Monthly P&I
- —
- Monthly cashflow
- —
- DSCR
- —
- Eligible?
- —
Personal DTI + credit; lowest rate.
DSCR
20% down · 8.5% · 30yr
- Down + closing
- —
- Monthly P&I
- —
- Monthly cashflow
- —
- DSCR
- —
- Eligible?
- —
No personal income docs; deal must DSCR.
Hard money
10% down · 12.0% · 12mo
- Down + closing
- —
- Monthly P&I
- —
- Monthly cashflow
- —
- DSCR
- —
- Eligible?
- —
Short-term bridge; refi at stabilization.
Rent comps 1 comps
| Address | Beds | Baths | Sqft | Rent | $/sqft | DOM | Units | Dist |
|---|---|---|---|---|---|---|---|---|
| 919 Dovefield Ln Lexington, SC | 4.0 | 2.5 | 2022 | $2,299 | $1.14 | 25d | 1 | 1.21mi |
HOA detail
- Monthly dues
- $17 · $204/yr
Listing history 13 events
-
2026-06-22days on market $325,000 Active 17 DOM
-
2026-06-18days on market $325,000 Active 14 DOM
-
2026-06-18remarks 699-char remark
-
2026-06-18days on market $325,000 Active 1 DOM
-
2026-06-17days on market $325,000 Active 14 DOM
-
2026-06-16days on market $325,000 Active 13 DOM
-
2026-06-15days on market $325,000 Active 12 DOM
-
2026-06-14days on market $325,000 Active 10 DOM
-
2026-06-10days on market $325,000 Active 7 DOM
-
2026-06-09days on market $325,000 Active 6 DOM
-
2026-06-08days on market $325,000 Active 5 DOM
-
2026-06-07remarks 687-char remark
-
2026-06-07$325,000 Active 4 DOM
ⓘ Source: listings_history table (triggers on properties + properties_extension) + one-shot
backfill from property_details.listing_events for pre-trigger history.
Tax reassessment forecast SC · Resets to sale price
- Current annual tax
- $1,214 · $101/mo
- Projected year-2 tax
- $1,852 · $154/mo
- Expected delta
- +$638/yr (+$53/mo · 52.6%)
ⓘ Screening estimate from a state-policy table — verify with the county assessor before closing.
Climate risk First Street
- Flood 1/10 Low FEMA zone X (unshaded) · 0% chance over 30 yrs
- Wildfire 5/10 Major
- Heat 7/10 Severe 7 d/yr ≥108°F today · 16 d/yr by 30 yrs out
- Wind 6/10 Major 65% chance of damaging wind over 30 yrs
- Air quality 3/10 Moderate 2 unhealthy d/yr today · 2 by 30 yrs out
Nearby sold comps map
Loading sold comps map…
Walkable amenities ~0.75 mi
Loading nearby amenities…
Taxation est. · year 1
- Rental income
- $27,588
- − Mortgage interest
- −$18,205
- − Property taxes
- −$1,214
- − Insurance
- −$1,625
- − Repairs & maintenance
- −$2,207
- − Management
- −$2,207
- − HOA
- −$204
- − Depreciation
- −$9,455
- Taxable loss
- −$7,529
- Est. tax savings @ 24.0%
- +$1,807
- After-tax cash flow
- $106/yr
For passive investors: Depreciation is non-cash, so a rental often shows a tax loss while cash-flowing — sheltering income. Rental losses are passive: they offset passive income freely, and up to $25,000/yr can offset ordinary (W-2) income if you actively participate and your MAGI is under $100k (phasing out to $0 by $150k); unused losses carry forward. On sale, claimed depreciation is recaptured at up to 25%, and gains may owe capital-gains tax (a 1031 exchange can defer both). Figures are a year-1 estimate at your 24.0% rate — not tax advice; consult a CPA.
Schools (NCES district)
- District
- Lexington 01
- NCES district ID
- 4502700
- Math proficiency
- 42% ▼ -12.00%
- Reading proficiency
- 53% ▼ -2.00%
- Median HH income
- $61,298
- Composite
- 41.75/100
- National rank
- #3399
- State rank
- #11 of 80 in SC
Livability — Red Bank
- Score
- 66/100
- State rank
- #121
- US rank
- #11985
Category grades
Schools grade is shown separately in the Schools card above.
Census & demographics
No demographic data for this ZIP.
Market trends
- HPI YoY
- —
- Current HPI
- —
- Rent YoY
- —
- Metro
- —
- State GDP YoY
- ▲ 4.51%
- F500 in state
- 2
Industry mix (Fortune 500 HQ in SC)
| Industry | F500 HQs | Revenue |
|---|---|---|
| Packaging | 1 | $7B |
|
||
Price history
-9.7% since first listed8 events — show timeline
- 2026-06-03 Listed $325,000 Consolidated MLS
- 2026-05-12 Delisted — Consolidated MLS
- 2026-04-24 Price Changed $324,999 Consolidated MLS
- 2026-04-10 Price Changed $329,999 Consolidated MLS
- 2026-03-18 Price Changed $344,999 Consolidated MLS
- 2026-03-18 Price Changed $334,999 Consolidated MLS
- 2026-02-17 Price Changed $349,999 Consolidated MLS
- 2026-01-28 Listed $359,999 Consolidated MLS
Property tax history
+30.6%/yrLatest (2024): $1,214 · +4.4% YoY. Source: county tax records.
Cash-flow waterfall
monthlySold comps — $/sqft
last 12 mo · ≤1 miLoading sold comps…