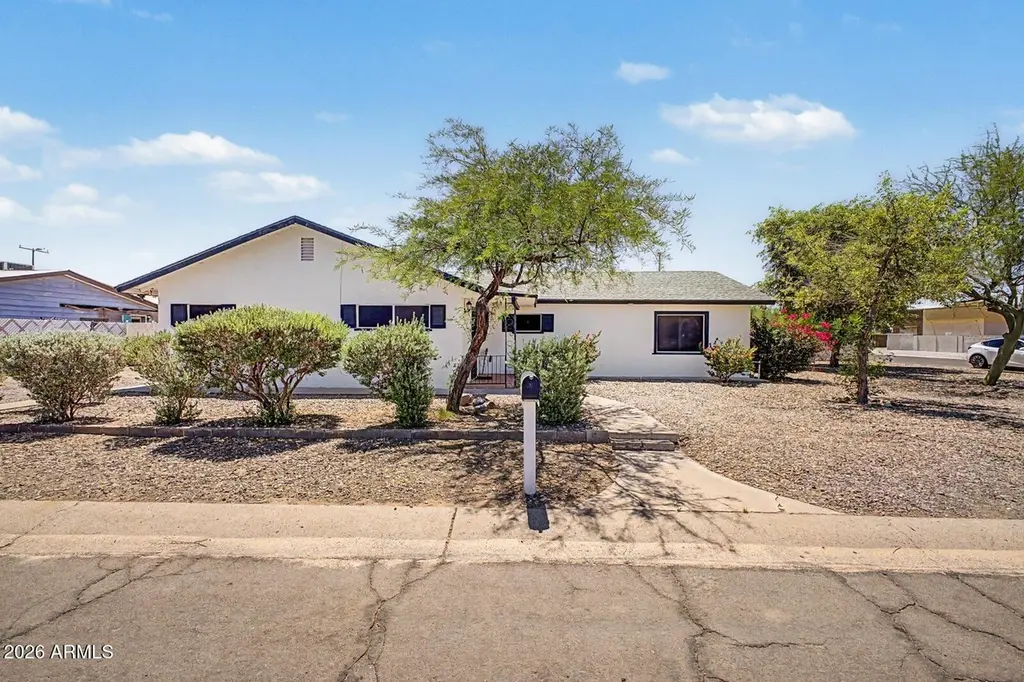
223 W 11th St · Casa Grande, AZ
Flood risk 1/10 · Minimal
- FEMA flood zone
- X (unshaded)
- Chance of flooding over 30 yrs
- 0.0%
- Est. flood insurance / yr
- $507 – $1,088
Fire risk 6/10 · Moderate
- Est. fire insurance / yr
- $610 – $1,132
Heat risk 9/10 · Severe
- Hot days now (above 113°F)
- 7 days/yr
- Hot days in 30 yrs
- 19 days/yr
Wind risk 1/10 · Minimal
- Chance of severe wind over 30 yrs
- —
Air-quality risk 2/10 · Minimal
- Unhealthy air days now
- 1 days/yr
- Unhealthy air days in 30 yrs
- 1 days/yr
Risk factors via First Street. Map © Google.
Why this score? — see what drove the B- grade
The composite is a weighted blend of 9 inputs, each scored 0–100. Each bar is that input's sub-score; the figure is the points it added to the 100-point composite (weight × sub-score).
- Cash flow +26.6/30.0
- ARV discount +15.0/15.0
- DSCR +9.1/10.0
- 1% rule +6.0/10.0
- Rent growth +3.7/5.0
- Livability +2.9/5.0
- Condition / age +2.5/5.0
- Schools +1.5/10.0
- Appreciation +0.0/10.0
$190,000
🖨 Deal sheet 📄 Offer letter ✓ Due diligence
Listing remarks
Spacious corner-lot home in the heart of Casa Grande with plenty of room and potential! Situated on an oversized lot with low-maintenance desert landscaping, this property offers a functional layout, abundant natural light, and ample outdoor space. Major system updates include a roof replaced approximately 4 years ago, with the A/C and water heater updated approximately 6 years ago. The large lot provides room for RV parking, toys, entertaining, or future possibilities. Conveniently located near schools, parks, shopping, dining, and easy freeway access. Great opportunity for a homeowner or investor looking to make it their own.
Key facts
- Major system updates
- Corner-lot
- Desert landscaping
Tags
Property features AI
Finance
- Financial info: Conventional financing available
- HOA & community: No association fees
Exterior
- Parking: 2 open parking spaces
- Utilities: City water; Public sewer
- Home design: Single family residence; Fee simple ownership
- Construction: Stucco and wood frame construction; Composition roof
- Exterior features: Corner lot; Gravel/stone front
Interior
- Bedrooms: 3 possible bedrooms
- Bathrooms: 2 full bathrooms; 1 half bathroom
- Heating & cooling: Central air conditioning; Heating present
- Interior features: Full bathroom in the master bedroom; Laundry room inside the home
- Laundry & utility: Inside laundry
Neighborhood map
What this means for you Summary
Snapshot
- This is a 3-bed/2.5-bath single-family listed at $190k.
Deal economics
- At list price, monthly cash flow is $508 ($6k/yr) — positive.
- The deal already cash-flows at list — no discount required.
- Meets the 1% rule at list price ($2k rent vs $190k).
- Recommended offer: $187k (1.5% below list) — sets the bar for market timing.
- Cap rate 9.5% vs local median 4.1% in Casa Grande — top-decile yield for the area; either an underpriced asset or a hidden risk that comps aren't pricing in. Stress-test before assuming the spread holds.
Location & tenants
- Location reads 58/100 on livability (#220 in AZ) — a working-class tenant base; expect higher turnover. Strengths: cost of living A+, housing A+; Watch: crime D+, employment D+, amenities F.
- Casa Grande Union High School District (4453) (suburban): math 14% / reading 21% proficiency, ranked #193 of 249 in AZ (top 78%) — low school quality limits family demand, transient renter base, plan for 1-2y turnover.
- Zoned schools: Casa Grande Union High School (math 18% / reading 25%, grade F, #217 of 381 statewide, top 57%, 2,132 students, 52% FRL).
- Market conditions: Rents rising fast (+4.6%/yr); 628 active listings in the ZIP; 21 comparable units currently listed for rent nearby; rentals at typical pace (median 22d on market — plan ~3-4 weeks tenant-placement turnaround); 9,504 units permitted in Pinal County in 2024 (776 in 5+ unit buildings).
- This rent runs 37% of the median local income ($68k/yr) — at the standard rent-burdened threshold; future hikes will face affordability resistance.
Forward outlook
- Local home prices are declining (-3.0%/yr); year-one equity from $1k of loan paydown is wiped out by about $6k of value loss. Plan a longer hold.
- At projected returns (-3.0% appreciation + 4.6% rent growth), your $53k cash investment doubles in ~9 years — after that, you're playing with house money.
Negotiation context
- It's been on market 23 days — a 2% lower offer ($187k) is reasonable based on typical stale-listing flexibility.
- 8 sale attempts since 26y ago with the ask held roughly flat each time — persistent listings suggest the price (not the market) is what's stuck; bring a comps-based counter.
- Current owner paid $92k; list at $190k implies a 106% gain — meaningful room to come down on a strong offer.
Risks & watch-outs
- Watch-outs: built in 1947 — expect roof / HVAC / electrical / plumbing capex.
- Climate carrying-cost: major wildfire risk; extreme-heat days projected 7→19/yr by 2055 (HVAC capex compounding) — expect insurance premiums to compound above CPI over the hold.
Questions for the listing agent
- Built in 1947 — when were the roof, HVAC, electrical panel, plumbing, and water heater last replaced?
- Is there a deadline driving the sale (1031 exchange, divorce, estate, relocation)? That informs how much negotiation room exists.
- Schools are F-rated, which usually means shorter tenancies and higher turnover. Who's the typical renter profile here, and what's been the actual vacancy rate?
- Crime grade is D in this area — have there been break-ins, vandalism, or insurance claims at this property in the last 3 years? What carrier currently insures it and at what premium?
- What's the average days-on-market for RENTAL listings here right now (not sales)? A rising rental-DOM trend means longer vacancies and softer asking-rent achievability than the comps imply.
- What's the recent tenant-quality profile in this submarket — average credit score on applications, eviction rate, late-payment / NSF rate, and stable-employment percentage? A property-management company in the area should have these aggregated.
- How much new for-sale + rental construction is in the pipeline within 1–3 miles? Heavy new supply typically softens prices + rents 12–24 months out; constrained supply supports both.
Investment metrics
- 1% rule
- 1.10% ✓
- Cap rate
- 9.50%
- Cash-on-cash
- 11.47%
- DSCR
- 1.51
- GRM
- 7.6
CMA / ARV
- ARV (on-the-fly)
- $277,530
- Comps found
- 12
Show comp detail 12 sales within ~0.75 mi
| Address | Dist | Beds/Ba | Sqft | Sold | Price | $/sf | Match |
|---|---|---|---|---|---|---|---|
| 301 W 11th St | 0.03mi | 3/2.0 | 1,481 (-7%) | 1mo | $259,000 | $175 | 84 |
| 1112 N Olive Ave | 0.30mi | 3/2.0 | 1,597 (+0%) | 1mo | $275,000 | $172 | 82 |
| 1316 N Park Ave | 0.19mi | 3/2.0 | 1,539 (-4%) | 2mo | $239,000 | $155 | 82 |
| 220 W 13th St | 0.14mi | 3/2.0 | 1,709 (+7%) | 5mo | $255,000 | $149 | 76 |
| 1112 N Center Ave | 0.16mi | 4/2.0 (+1) | 1,549 (-3%) | 10mo | $325,000 | $210 | 73 |
| 220 E Ocotillo St | 0.61mi | 4/2.0 (+1) | 1,623 (+2%) | 6mo | $324,900 | $200 | 57 |
| 308 W 3rd Ave | 0.65mi | 4/2.0 (+1) | 1,617 (+1%) | 6mo | $225,000 | $139 | 55 |
| 721 W Ocotillo St | 0.73mi | 4/2.0 (+1) | 1,562 (-2%) | 1mo | $295,000 | $189 | 55 |
| 517 W 11th St | 0.30mi | 4/2.0 (+1) | 1,425 (-11%) | 10mo | $209,000 | $147 | 53 |
| 504 E Laurel Dr | 0.53mi | 4/2.0 (+1) | 1,372 (-14%) | 8mo | $238,400 | $174 | 39 |
| 718 W Ocotillo St | 0.74mi | 3/2.0 | 1,368 (-14%) | 3mo | $260,000 | $190 | 37 |
| 305 N Morrison Ave | 0.74mi | 3/2.0 | 1,376 (-14%) | 7mo | $220,000 | $160 | 35 |
Match score weights: distance 35% · size 25% · config 20% · recency 20%. Top-matched comps best support the ARV.
Projected returns pro-forma
-3.0% appreciation · 4.6% rent growth · sell at horizon
- IRR
- 2.4%
- Equity multiple
- 1.09×
- Total profit
- $4,926
- Equity at exit
- $28,330
- IRR
- 13.3%
- Equity multiple
- 2.13×
- Total profit
- $60,133
- Equity at exit
- $16,428
Cash invested: $53,200 (down + closing). Projections, not guarantees.
Landlord ↔ Tenant lean methodology
- Overall (STATE)
- 87 Strongly Landlord-Friendly
- State Arizona
- 87 Strongly Landlord-Friendly · R+3
- County
- — inherits STATE
- City
- — inherits STATE
ZIP-level market 85122
- Home prices YoY
- -22.4%
- Rents YoY
- 4.6%
- Active inventory
- 628
- Price-to-rent
- 7.6×
Monthly cashflow live
- Estimated rent
- $2,085 high interval (Pro) →
- Mortgage (P&I)
- −$996
- Tax from tax record
- −$63 /mo · $758/yr
- Insurance
- −$79
- HOA
- −$0
- Vacancy / Maint / Mgmt
- −$438
- Net cashflow
- $508
Break-even live
UW: 25.0% down · 7.5% · 30yr · 1.5% tax · 5.0% vac · 8.0% maint · 8.0% mgmt
Financing live
Cash to close
- Down payment
- $47,500
- Closing costs
- $5,700
- Reserves months
- —
- Total cash needed
- —
Loan-product check · same deal, 3 products live
Conventional
25% down · 7.5% · 30yr
- Down + closing
- —
- Monthly P&I
- —
- Monthly cashflow
- —
- DSCR
- —
- Eligible?
- —
Personal DTI + credit; lowest rate.
DSCR
20% down · 8.5% · 30yr
- Down + closing
- —
- Monthly P&I
- —
- Monthly cashflow
- —
- DSCR
- —
- Eligible?
- —
No personal income docs; deal must DSCR.
Hard money
10% down · 12.0% · 12mo
- Down + closing
- —
- Monthly P&I
- —
- Monthly cashflow
- —
- DSCR
- —
- Eligible?
- —
Short-term bridge; refi at stabilization.
Rent comps 21 comps
| Address | Beds | Baths | Sqft | Rent | $/sqft | DOM | Units | Dist |
|---|---|---|---|---|---|---|---|---|
| 541 W Melrose Dr Casa Grande, AZ | 3.0 | 2.0 | 1101 | $1,600 | $1.45 | 24d | 1 | 0.53mi |
| 1584 N Wood St Casa Grande, AZ | 4.0 | 2.0 | 1928 | $1,800 | $0.93 | 14d | 1 | 0.78mi |
| 919 N Gilbert Ave Casa Grande, AZ | 3.0 | 2.0 | 1630 | $1,975 | $1.21 | 5d | 1 | 0.79mi |
| 801 E 2nd St Casa Grande, AZ | 3.0 | 2.0 | 1200 | $1,650 | $1.38 | 24d | 1 | 0.82mi |
| 1640 N Cameron St Unit 1640 Casa Grande, AZ | 3.0 | 2.5 | 1577 | $3,250 | $2.06 | 24d | 1 | 0.90mi |
| 920 E 4th St Casa Grande, AZ | 3.0 | 2.0 | 1073 | $1,295 | $1.21 | 3d | 1 | 0.91mi |
| 1640 N Cameron St Casa Grande, AZ | 3.0 | 2.0 | 1577 | $3,250 | $2.06 | 23d | 1 | 0.91mi |
| 1640 N Cameron St Casa Grande, AZ | 3.0 | 2.0 | 1577 | $3,250 | $2.06 | 21d | 1 | 0.91mi |
| 1642 N Cameron St Casa Grande, AZ | 3.0 | 2.5 | 1577 | $3,250 | $2.06 | 24d | 1 | 0.91mi |
| 1131 E Trinity Pl Casa Grande, AZ | 4.0 | 2.5 | 1600 | $1,650 | $1.03 | 24d | 1 | 1.03mi |
| 1013 E Doan St Casa Grande, AZ | 4.0 | 2.0 | 1120 | $1,700 | $1.52 | 24d | 1 | 1.15mi |
| 928 N Pueblo Dr Casa Grande, AZ | 3.0 | 2.0 | 1300 | $1,550 | $1.19 | 24d | 1 | 1.21mi |
| 846 N Pueblo Dr #138 Casa Grande, AZ | 3.0 | 2.0 | 1324 | $1,700 | $1.28 | 14d | 1 | 1.21mi |
| 75 S Trekell Rd Casa Grande, AZ | 2.0–3.0 | 2.0 | 1035 | $1,750 | $1.69 | 1d | 18 | 1.29mi |
| 1620 N Trekell Rd Casa Grande, AZ | 1.0–3.0 | 1.0–2.5 | 1090 | $2,640 | $2.42 | 1d | 1 | 1.29mi |
| 1025 N Menze St Casa Grande, AZ | 3.0 | 1.5 | 1301 | $1,695 | $1.30 | 12d | 1 | 1.32mi |
| 1007 N Menze St Casa Grande, AZ | 4.0 | 2.0 | 1539 | $1,580 | $1.03 | 5d | 1 | 1.32mi |
| 1858 N Center Ave Casa Grande, AZ | 2.0 | 2.0 | 1146 | $1,500 | $1.31 | 24d | 1 | 1.36mi |
| 1846 N Princeton Ave Casa Grande, AZ | 4.0 | 2.0 | 1786 | $1,750 | $0.98 | 4d | 1 | 1.42mi |
| 767 W Barrus Dr Casa Grande, AZ | 3.0 | 2.0 | 1463 | $1,695 | $1.16 | 24d | 1 | 1.43mi |
| 1775 N Terrace Cir Casa Grande, AZ | 3.0 | 2.0 | 1628 | $1,699 | $1.04 | 14d | 1 | 1.44mi |
Listing history 32 events
-
2026-06-08statusdays on market $190,000 Pending 23 DOM
-
2026-06-07days on market $190,000 Active 22 DOM
-
2026-06-04days on market $190,000 Active 19 DOM
-
2026-06-03days on market $190,000 Active 18 DOM
-
2026-06-02days on market $190,000 Active 17 DOM
-
2026-06-01days on market $190,000 Active 16 DOM
-
2026-05-31days on market $190,000 Active 15 DOM
-
2026-05-22status Active
-
2026-05-18status Pending
-
2026-05-05$190,000 Active
-
2026-04-27historical
-
2026-04-27historical
-
2026-04-07price $211,000
-
2026-04-07price $211,000
-
2026-04-01status Active
-
2026-04-01status Active
-
2026-04-01historical
-
2026-04-01historical
-
2026-03-25price $220,000
-
2026-03-25price $220,000
-
2026-03-06price $227,700
-
2026-03-06$227,700 Active
-
2026-03-02price $237,000
-
2026-02-19$240,000 Active
-
2008-09-08historical
-
2008-03-07$135,000
-
2003-08-22soldstatus $92,300
-
2001-01-02soldstatus $87,000
-
2000-12-05soldstatus $87,000
-
2000-10-16historical
-
2000-07-10$87,000
-
1999-05-20soldstatus $88,000
ⓘ Source: listings_history table (triggers on properties + properties_extension) + one-shot
backfill from property_details.listing_events for pre-trigger history.
Tax reassessment forecast AZ · Resets to sale price
- Current annual tax
- $758 · $63/mo
- Projected year-2 tax
- $1,254 · $104/mo
- Expected delta
- +$496/yr (+$41/mo · 65.5%)
ⓘ Screening estimate from a state-policy table — verify with the county assessor before closing.
Climate risk First Street
- Flood 1/10 Low FEMA zone X (unshaded) · 0% chance over 30 yrs
- Wildfire 6/10 Major
- Heat 9/10 Extreme 7 d/yr ≥113°F today · 19 d/yr by 30 yrs out
- Wind 1/10 Low
- Air quality 2/10 Low 1 unhealthy d/yr today · 1 by 30 yrs out
Nearby sold comps map
Loading sold comps map…
Walkable amenities ~0.75 mi
Loading nearby amenities…
Taxation est. · year 1
- Rental income
- $25,019
- − Mortgage interest
- −$10,643
- − Property taxes
- −$758
- − Insurance
- −$950
- − Repairs & maintenance
- −$2,002
- − Management
- −$2,002
- − Depreciation
- −$5,527
- Taxable income
- $3,138
- Est. tax owed @ 24.0%
- −$753
- After-tax cash flow
- $5,348/yr
For passive investors: Depreciation is non-cash, so a rental often shows a tax loss while cash-flowing — sheltering income. Rental losses are passive: they offset passive income freely, and up to $25,000/yr can offset ordinary (W-2) income if you actively participate and your MAGI is under $100k (phasing out to $0 by $150k); unused losses carry forward. On sale, claimed depreciation is recaptured at up to 25%, and gains may owe capital-gains tax (a 1031 exchange can defer both). Figures are a year-1 estimate at your 24.0% rate — not tax advice; consult a CPA.
Schools (NCES district)
- District
- Casa Grande Union High School District (4453)
- NCES district ID
- 0401740
- Math proficiency
- 14% ▼ -15.00%
- Reading proficiency
- 21% ▼ -10.00%
- Median HH income
- $45,373
- Composite
- 15.38/100
- National rank
- #9319
- State rank
- #193 of 249 in AZ
Livability — Casa Grande
- Score
- 58/100
- State rank
- #220
- US rank
- #21534
Category grades
Schools grade is shown separately in the Schools card above.
Census & demographics
- Census place
- Casa Grande, AZ
- County
- Pinal County · 399,947 people
- City population
- 69,701
- Metro
- Phoenix-Mesa-Chandler, AZ
- Population (ZIP)
- 61,624
- Household income
- $68,443
- Rent vs Own
- Severe rent burden
- 1250.0
Population outlook (Pinal County) Hauer SSP2
- Today (2025)
- 437,574 people
- By 2030
- 446,903 · +2.1%
- By 2040
- 452,589 · +3.4%
- By 2050
- 444,126 · +1.5%
- By 2075
- 430,300 · -1.7%
- By 2100
- 393,536 · -10.1%
Race, ethnicity, and origin ACS 2023
- Neighborhood character
- Diverse neighborhood (Simpson 0.63)
- Race & ethnicity
- Hispanic / Latino 44% White 42% Two or more races 21% Black 4% Native American 4% Asian 1%
- Hispanic origin (detail)
- Mexican 40%
- Common ancestry
- Lithuanian 1% Slovak 1% Portuguese 1%
- Foreign-born
- 12% · Canada
- Languages at home
- 75% English-only · Spanish 23% Tagalog/Filipino 1% Other Indo-European 1%
Political lean MEDSL · Pinal
- 2024 margin
- Strong R (+22.1) · D 38.5% · R 60.6%
- 2008→2024 swing
- -7.6pp toward R · 2008: -14.5pp · 2024: -22.1pp
- All cycles
- 2024: R+22.1 2020: R+17.3 2016: R+19.3 2012: R+17.1 2008: R+14.5
Not yet ingested
- Civics
- —
Market trends
- HPI YoY
- ▼ -67.32%
- Current HPI
- 233.148
- Rent YoY
- ▲ 4.60%
- Metro
- Phoenix-Mesa-Chandler, AZ
- State GDP YoY
- ▲ 4.54%
- F500 in state
- 20
Industry mix (Fortune 500 HQ in AZ)
| Industry | F500 HQs | Revenue |
|---|---|---|
| Technology | 2 | $13B |
|
||
| Mining / Metals | 1 | $23B |
|
||
| Environmental Services | 1 | $16B |
|
||
| Metals / Steel | 1 | $14B |
|
||
| Technology Distribution | 1 | $9B |
|
||
| Homebuilding | 1 | $8B |
|
||
Price history
+115.9% since first listed25 events — show timeline
- 2026-05-22 Relisted — ARMLS
- 2026-05-18 Pending — ARMLS
- 2026-05-05 Listed $190,000 ARMLS
- 2026-04-27 Listing Removed — MLSSAZ
- 2026-04-27 Listing Removed — ARMLS
- 2026-04-07 Price Changed $211,000 MLSSAZ
- 2026-04-07 Price Changed $211,000 ARMLS
- 2026-04-01 Relisted — ARMLS
- 2026-04-01 Relisted — MLSSAZ
- 2026-04-01 Listing Removed — MLSSAZ
- 2026-04-01 Listing Removed — ARMLS
- 2026-03-25 Price Changed $220,000 MLSSAZ
- 2026-03-25 Price Changed $220,000 ARMLS
- 2026-03-06 Price Changed $227,700 ARMLS
- 2026-03-06 Listed $227,700 MLSSAZ
- 2026-03-02 Price Changed $237,000 ARMLS
- 2026-02-19 Listed $240,000 ARMLS
- 2008-09-08 Listing Removed — ARMLS
- 2008-03-07 Listed $135,000 ARMLS
- 2003-08-22 Sold (Public Records) $92,300 Public Records
- 2001-01-02 Sold (MLS) $87,000 ARMLS
- 2000-12-05 Sold (Public Records) $87,000 Public Records
- 2000-10-16 Listing Removed — ARMLS
- 2000-07-10 Listed $87,000 ARMLS
- 1999-05-20 Sold (Public Records) $88,000 Public Records
Property tax history
+0.6%/yrLatest (2025): $758 · +6.7% YoY. Source: county tax records.
Cash-flow waterfall
monthlySold comps — $/sqft
last 12 mo · ≤1 miLoading sold comps…