 Duplex
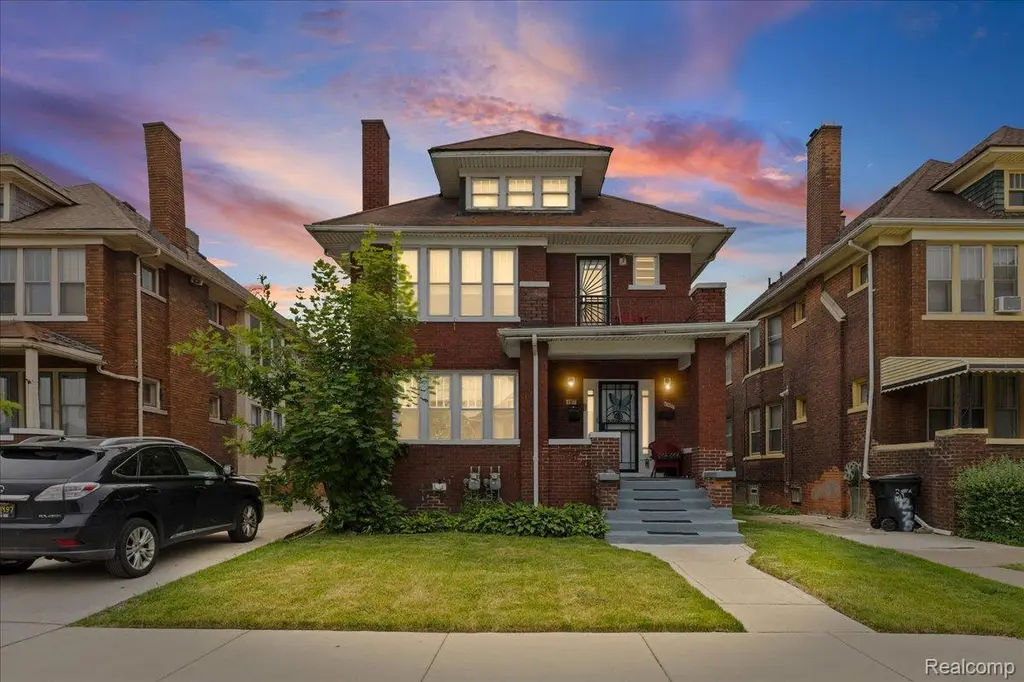
4267 Seebaldt St · Detroit, MI
Flood risk 1/10 · Minimal
- FEMA flood zone
- X (unshaded)
- Chance of flooding over 30 yrs
- 0.0%
- Est. flood insurance / yr
- $473 – $860
Fire risk 1/10 · Minimal
- Est. fire insurance / yr
- $784 – $1,456
Heat risk 3/10 · Minor
- Hot days now (above 97°F)
- 7 days/yr
- Hot days in 30 yrs
- 15 days/yr
Wind risk 2/10 · Minimal
- Chance of severe wind over 30 yrs
- —
Air-quality risk 4/10 · Minor
- Unhealthy air days now
- 4 days/yr
- Unhealthy air days in 30 yrs
- 6 days/yr
Risk factors via First Street. Map © Google.
Why this score? — see what drove the B- grade
The composite is a weighted blend of 9 inputs, each scored 0–100. Each bar is that input's sub-score; the figure is the points it added to the 100-point composite (weight × sub-score).
- Cash flow +25.1/30.0
- Appreciation +10.0/10.0
- DSCR +8.2/10.0
- ARV discount +7.5/15.0
- 1% rule +6.1/10.0
- Livability +3.7/5.0
- Rent growth +2.5/5.0
- Condition / age +2.5/5.0
- Schools +1.3/10.0
$219,900
🖨 Deal sheet (PDF) 📄 Offer letter ✓ Due diligence
Multi-family units
County records classify this as Multi-Family (2-4 Unit). Listing-text estimate: 2 units. confirmed
Listing remarks MLS
Fantastic opportunity for an owner occupy OR investor. House hack in this spacious classic two family townhouse or keep it as an AirBnB or long term rental! You will enjoy the huge covered front porch and relaxing back deck, just in time for summer entertaining. Large renovated units featured updated kitchens and bathrooms, each with its own fireplace and separate entry. Large bedrooms and great rooms, the upstairs unit has a foyer and private balcony! Minutes from New Center, Midtown, Downtown and all the shops, services, hospitals and amenities of the city. Keep it as a perfect short term rental for traveling healthcare tenants, fellowships, students and tourists or move in and rent the other. Home already has gas forced air and some additional updated systems. One long term month to month tenant currently paying $2,500 a month. BATVAI
Key facts
- Relaxing back deck
- Updated bathrooms
- Updated kitchens
Tags
Property features AI
Finance
- Other: Pets allowed: contact for details
- Financial info: Property type: Residential income (multi-family); Two units total; Each unit listed as furnished; One unit example rent listed at $2,500 (actual rent); Investor details: multi-family income property with two furnished 2-bedroom units
- HOA & community: No HOA information provided
Exterior
- Parking: No parking details provided
- Security: No security details provided
- Utilities: Water available; Public sewer
- Home design: Residential income property (multi-family); Two-story building; Brick construction
- Construction: Brick exterior; Asphalt roof; Block and brick/mortar foundation; Approximately 3,550 above-grade finished square feet
- Exterior features: Covered porch and terrace; Patio; Paved road access
Interior
- Kitchen: No specific kitchen appliance list provided
- Bedrooms: Two 2-bedroom units (each unit listed as 2 bedrooms)
- Flooring: No flooring details provided
- Bathrooms: Two full bathrooms (building total); Each unit has 1 bathroom
- Heating & cooling: Forced air heating; Natural gas heating; No cooling
- Interior features: Gas water heater; Full unfinished basement with interior entry
- Laundry & utility: No laundry details provided
Neighborhood map
What this means for you Summary
Snapshot
- This is a 2 × 2-bed/1.0-bath units multifamily listed at $220k.
Deal economics
- At list price, monthly cash flow is $488 ($6k/yr) — positive. Per door: $244/mo.
- The deal already cash-flows at list — no discount required.
- Meets the 1% rule at list price ($2k rent vs $220k).
Location & tenants
- Location reads 73/100 on livability (#218 in MI) — a middle-class / working-renter tenant base. Strengths: amenities A+, commute A+, cost of living A+; Watch: schools F, crime F, employment F.
- Detroit Public Schools Community District (urban): math 10% / reading 24% proficiency, ranked #499 of 540 in MI (top 92%) — low school quality limits family demand, transient renter base, plan for 1-2y turnover; 90% free/reduced lunch — lower-income household profile, screen leases tightly.
- Market conditions: 248 active listings in the ZIP; 9 comparable units currently listed for rent nearby; rentals leasing fast (median 4d on market — plan ~1-2 weeks tenant-placement turnaround); lower-income renter base — watch delinquency; 2,639 units permitted in Wayne County in 2024 (1,216 in 5+ unit buildings).
- At $2,432/mo this rent would consume 85% of the median local household income ($34k/yr) (locally 1418% of renters already pay >50% of income on rent) — very limited rent-growth headroom before tenants either downsize or default.
Forward outlook
- In year one you build about $24k of equity ($2k loan paydown + $22k appreciation (10.0% local appreciation)).
- Wayne County population projected at -17% by 2050 — secular population decline; favor cash flow + early exit over multi-decade hold.
- At projected returns (10.0% appreciation + 3.0% rent growth), your $62k cash investment doubles in ~2 years — after that, you're playing with house money.
- By year 2, paydown + projected appreciation supports a ~$38k cash-out refi (75% LTV) — recoverable capital for the next deal without selling this one.
Negotiation context
- Only 9 days on market — expect competitive offers; lowballing is unlikely to land.
- 8 sale attempts since 9y ago with the ask held roughly flat each time — persistent listings suggest the price (not the market) is what's stuck; bring a comps-based counter.
- Current owner paid $38k; list at $220k implies a 486% gain — meaningful room to come down on a strong offer.
Risks & watch-outs
- Watch-outs: built in 1916 — expect roof / HVAC / electrical / plumbing capex.
Questions for the listing agent
- Can we see the unit-by-unit rent roll, current vacancy, and any below-market leases? What's the average tenancy length?
- What capital expenditures (roof, boiler, parking lot, exteriors) have been made in the last 5 years, and what's planned in the next 2?
- Built in 1916 — when were the roof, HVAC, electrical panel, plumbing, and water heater last replaced?
- Is there a deadline driving the sale (1031 exchange, divorce, estate, relocation)? That informs how much negotiation room exists.
- Schools are F-rated, which usually means shorter tenancies and higher turnover. Who's the typical renter profile here, and what's been the actual vacancy rate?
- Crime grade is F in this area — have there been break-ins, vandalism, or insurance claims at this property in the last 3 years? What carrier currently insures it and at what premium?
- What's the average days-on-market for RENTAL listings here right now (not sales)? A rising rental-DOM trend means longer vacancies and softer asking-rent achievability than the comps imply.
- What's the recent tenant-quality profile in this submarket — average credit score on applications, eviction rate, late-payment / NSF rate, and stable-employment percentage? A property-management company in the area should have these aggregated.
- How much new apartment / multifamily construction is in the pipeline within 1–3 miles? Heavy new supply (>2% of stock underway) typically softens rents 12–24 months out; light construction supports rent growth.
Investment metrics
- 1% rule
- 1.11% ✓
- Cap rate
- 8.95%
- Cash-on-cash
- 9.50%
- DSCR
- 1.42
- GRM
- 7.5
CMA / ARV
- ARV (on-the-fly)
- $74,250
- Comps found
- 12
Show comp detail 12 sales within ~0.75 mi
| Address | Dist | Beds/Ba | Sqft | Sold | Price | $/sf | Match |
|---|---|---|---|---|---|---|---|
| 3224 Hogarth St | 0.45mi | 4/2.5 | 2,683 (-2%) | 4mo | $65,000 | $24 | 69 |
| 4317 Virginia Park St | 0.35mi | 4/2.0 | 2,590 (-6%) | 9mo | $70,000 | $27 | 62 |
| 4571-4573 Vancouver St | 0.33mi | 4/2.0 | 2,470 (-10%) | 3mo | $76,000 | $31 | 62 |
| 5101 Oregon St | 0.47mi | 4/2.0 | 2,558 (-7%) | 11mo | $180,000 | $70 | 53 |
| 4387 Pingree St | 0.51mi | 4/4.5 | 2,564 (-7%) | 9mo | $134,000 | $52 | 51 |
| 8776 Dexter Ave | 0.73mi | 4/2.0 | 2,900 (+6%) | 7mo | $71,000 | $24 | 47 |
| 3284 Northwestern St | 0.39mi | 4/2.0 | 2,380 (-14%) | 11mo | $45,000 | $19 | 46 |
| 3744 Blaine St | 0.64mi | 4/2.5 | 2,372 (-14%) | 6mo | $50,000 | $21 | 40 |
| 4046 Blaine St | 0.60mi | 4/2.0 | 2,486 (-10%) | 18mo | $72,000 | $29 | 37 |
| 5200 Oregon St | 0.50mi | 4/2.0 | 2,352 (-14%) | 16mo | $45,000 | $19 | 35 |
| 5200 Oregon St #5204 | 0.50mi | 4/2.0 | 2,352 (-14%) | 16mo | $45,000 | $19 | 35 |
| 8810-8808 Quincy St | 0.71mi | 4/2.5 | 2,352 (-14%) | 16mo | $68,000 | $29 | 27 |
Match score weights: distance 35% · size 25% · config 20% · recency 20%. Top-matched comps best support the ARV.
Projected returns pro-forma
10.0% appreciation · 3.0% rent growth · sell at horizon
- IRR
- 31.2%
- Equity multiple
- 3.45×
- Total profit
- $150,805
- Equity at exit
- $198,103
- IRR
- 27.0%
- Equity multiple
- 7.82×
- Total profit
- $419,640
- Equity at exit
- $427,217
Cash invested: $61,572 (down + closing). Projections, not guarantees.
Landlord ↔ Tenant lean methodology
- Overall (STATE)
- 62 Landlord-Friendly
- State Michigan
- 62 Landlord-Friendly · EVEN
- County
- — inherits STATE
- City
- — inherits STATE
ZIP-level market 48204
- Home prices YoY
- 18.5%
- Active inventory
- 248
- Price-to-rent
- 15.1×
Monthly cashflow live
- Estimated rent
- $2,432 high interval (Pro) →
- Mortgage (P&I)
- −$1,153
- Tax from tax record
- −$189 /mo · $2,266/yr
- Insurance
- −$92
- HOA
- −$0
- Vacancy / Maint / Mgmt
- −$511
- Net cashflow
- $488
Break-even live
Sensitivity live
| Price | -10% $612 | -5% $550 | +0% $488 | +5% $425 | +10% $363 |
|---|---|---|---|---|---|
| Rent | -10% $296 | -5% $392 | +0% $488 | +5% $584 | +10% $680 |
| Rate | -1.0pp $598 | -0.5pp $544 | base $488 | +0.5pp $431 | +1.0pp $373 |
2-unit breakdown (identical units grouped — click to expand)
| Units | Beds | Baths | Est. rent |
|---|---|---|---|
| 2× units | 2 | 1 | $2,432 |
| #1 | 2 | 1 | $1,216 |
| #2 | 2 | 1 | $1,216 |
| Total (2 units) | $2,432 | ||
UW: 25.0% down · 7.5% · 30yr · 1.5% tax · 5.0% vac · 8.0% maint · 8.0% mgmt
Financing live
Cash to close
- Down payment
- $54,975
- Closing costs
- $6,597
- Reserves months
- —
- Total cash needed
- —
Loan-product check · same deal, 3 products live
Conventional
25% down · 7.5% · 30yr
- Down + closing
- —
- Monthly P&I
- —
- Monthly cashflow
- —
- DSCR
- —
- Eligible?
- —
Personal DTI + credit; lowest rate.
DSCR
20% down · 8.5% · 30yr
- Down + closing
- —
- Monthly P&I
- —
- Monthly cashflow
- —
- DSCR
- —
- Eligible?
- —
No personal income docs; deal must DSCR.
Hard money
10% down · 12.0% · 12mo
- Down + closing
- —
- Monthly P&I
- —
- Monthly cashflow
- —
- DSCR
- —
- Eligible?
- —
Short-term bridge; refi at stabilization.
Rent comps 9 comps
| Address | Beds | Baths | Sqft | Rent | $/sqft | DOM | Units | Dist |
|---|---|---|---|---|---|---|---|---|
| 3799 W Philadelphia St Detroit, MI | 5.0 | 2.0 | 2200 | $1,650 | $0.75 | 18d | 1 | 0.47mi |
| 5315 Spokane St Detroit, MI | 3.0 | 1.0 | 2110 | $1,200 | $0.57 | 18d | 1 | 0.65mi |
| 7370 La Salle Blvd Detroit, MI | 4.0 | 3.0 | 3610 | $4,500 | $1.25 | 45d | 1 | 0.98mi |
| 2509 Gladstone St Unit 1 Detroit, MI | 3.0 | 2.0 | 3000 | $2,650 | $0.88 | 0d | 1 | 1.06mi |
| 8951 La Salle Blvd Unit NA Detroit, MI | 4.0 | 2.5 | 2440 | $2,500 | $1.02 | 0d | 1 | 1.21mi |
| 8951 La Salle Blvd Detroit, MI | 5.0 | 2.5 | 2440 | $2,500 | $1.02 | 16d | 1 | 1.21mi |
| 8951 La Salle Blvd Detroit, MI | 4.0 | 2.5 | 2440 | $2,500 | $1.02 | 3d | 1 | 1.21mi |
| 2080 Gladstone St #1 Detroit, MI | 4.0 | 2.0 | 2426 | $3,000 | $1.24 | 0d | 1 | 1.31mi |
| 2028 Gladstone St Unit 1 Detroit, MI | 5.0 | 2.0 | 2500 | $2,850 | $1.14 | 4d | 1 | 1.36mi |
Listing history 7 events
-
2026-06-21days on market $219,900 Active 9 DOM
-
2026-06-18days on market $219,900 Active 6 DOM
-
2026-06-17days on market $219,900 Active 5 DOM
-
2026-06-16days on market $219,900 Active 4 DOM
-
2026-06-15days on market $219,900 Active 3 DOM
-
2026-06-13remarks 699-char remark
-
2026-06-13$219,900 Active 1 DOM
ⓘ Source: listings_history table (triggers on properties + properties_extension) + one-shot
backfill from property_details.listing_events for pre-trigger history.
Tax reassessment forecast MI · Partial reset (capped growth)
- Current annual tax
- $2,266 · $189/mo
- Projected year-2 tax
- $2,826 · $236/mo
- Expected delta
- +$560/yr (+$47/mo · 24.7%)
ⓘ Screening estimate from a state-policy table — verify with the county assessor before closing.
Climate risk First Street
- Flood 1/10 Low FEMA zone X (unshaded) · 0% chance over 30 yrs
- Wildfire 1/10 Low
- Heat 3/10 Moderate 7 d/yr ≥97°F today · 15 d/yr by 30 yrs out
- Wind 2/10 Low
- Air quality 4/10 Moderate 4 unhealthy d/yr today · 6 by 30 yrs out
Nearby sold comps map
Loading sold comps map…
Walkable amenities ~0.75 mi
Loading nearby amenities…
Taxation est. · year 1
- Rental income
- $29,184
- − Mortgage interest
- −$12,318
- − Property taxes
- −$2,266
- − Insurance
- −$1,100
- − Repairs & maintenance
- −$2,335
- − Management
- −$2,335
- − Depreciation
- −$6,397
- Taxable income
- $2,434
- Est. tax owed @ 24.0%
- −$584
- After-tax cash flow
- $5,267/yr
For passive investors: Depreciation is non-cash, so a rental often shows a tax loss while cash-flowing — sheltering income. Rental losses are passive: they offset passive income freely, and up to $25,000/yr can offset ordinary (W-2) income if you actively participate and your MAGI is under $100k (phasing out to $0 by $150k); unused losses carry forward. On sale, claimed depreciation is recaptured at up to 25%, and gains may owe capital-gains tax (a 1031 exchange can defer both). Figures are a year-1 estimate at your 24.0% rate — not tax advice; consult a CPA.
Schools (NCES district)
- District
- Detroit Public Schools Community District
- NCES district ID
- 2601103
- Math proficiency
- 10% ▼ -2.00%
- Reading proficiency
- 24% ▲ 6.00%
- Median HH income
- $25,815
- Composite
- 13.06/100
- National rank
- #9564
- State rank
- #499 of 540 in MI
Livability — Detroit
- Score
- 73/100
- State rank
- #218
- US rank
- #5427
Category grades
Schools grade is shown separately in the Schools card above.
Census & demographics
- Census place
- Detroit, MI
- County
- Wayne County · 1,562,939 people
- City population
- 572,865
- Metro
- Detroit-Warren-Dearborn, MI
- Population (ZIP)
- 20,696
- Household income
- $34,468
- Rent vs Own
- Severe rent burden
- 1418.0
Population outlook (Wayne County) Hauer SSP2
- Today (2025)
- 1,675,273 people
- By 2030
- 1,620,300 · -3.3%
- By 2040
- 1,502,341 · -10.3%
- By 2050
- 1,384,039 · -17.4%
- By 2075
- 1,124,592 · -32.9%
- By 2100
- 881,193 · -47.4%
Race, ethnicity, and origin ACS 2023
- Neighborhood character
- Predominantly Black (86%)
- Race & ethnicity
- Black 86% Two or more races 7% Hispanic / Latino 5% White 4% Native American 2%
- Hispanic origin (detail)
- Mexican 4%
- Common ancestry
- Hispanic 1% Romanian 1%
- Foreign-born
- 2% · Canada
- Languages at home
- 95% English-only · Spanish 4%
Political lean MEDSL · Wayne
- 2024 margin
- Strong D (+29.0) · D 62.7% · R 33.7% · Other 3.6%
- 2008→2024 swing
- -20.5pp toward R · 2008: 49.5pp · 2024: 29.0pp
- All cycles
- 2024: D+29.0 2020: D+38.1 2016: D+37.3 2012: D+46.9 2008: D+49.5
Not yet ingested
- Civics
- —
Market trends
- HPI YoY
- ▲ 36.51%
- Current HPI
- 234.0465
- Rent YoY
- —
- Metro
- Detroit-Warren-Dearborn, MI
- State GDP YoY
- ▲ 1.37%
- F500 in state
- 28
Industry mix (Fortune 500 HQ in MI)
| Industry | F500 HQs | Revenue |
|---|---|---|
| Automotive Parts | 3 | $48B |
|
||
| Automotive | 2 | $372B |
|
||
| Chemicals | 1 | $45B |
|
||
| Automotive Retail | 1 | $29B |
|
||
| Healthcare / Medical Devices | 1 | $23B |
|
||
| Automotive Technology | 1 | $20B |
|
||
Price history
+266.5% since first listed17 events — show timeline
- 2026-06-12 Listed $219,900 REALCOMP
- 2026-06-12 Listed $219,900 MiRealSource-MiMLS
- 2017-12-05 Pending — REALCOMP
- 2017-12-05 Sold (MLS) $37,500 MiRealSource-MiMLS
- 2017-12-05 Sold (MLS) $37,500 REALCOMP
- 2017-10-20 Relisted — REALCOMP
- 2017-10-12 Listing Removed — REALCOMP
- 2017-10-10 Price Changed $39,900 MiRealSource-MiMLS
- 2017-10-10 Price Changed $39,900 REALCOMP
- 2017-09-01 Relisted — REALCOMP
- 2017-08-14 Listing Removed — REALCOMP
- 2017-08-04 Relisted — REALCOMP
- 2017-07-12 Listing Removed — REALCOMP
- 2017-06-16 Listed $60,000 MiRealSource-MiMLS
- 2017-06-16 Relisted — REALCOMP
- 2017-06-13 Listing Removed — REALCOMP
- 2017-06-10 Listed $60,000 REALCOMP
Property tax history
+5.7%/yrLatest (2025): $2,266 · +6.4% YoY. Source: county tax records.
Cash-flow waterfall
monthlySold comps — $/sqft
last 12 mo · ≤1 miLoading sold comps…