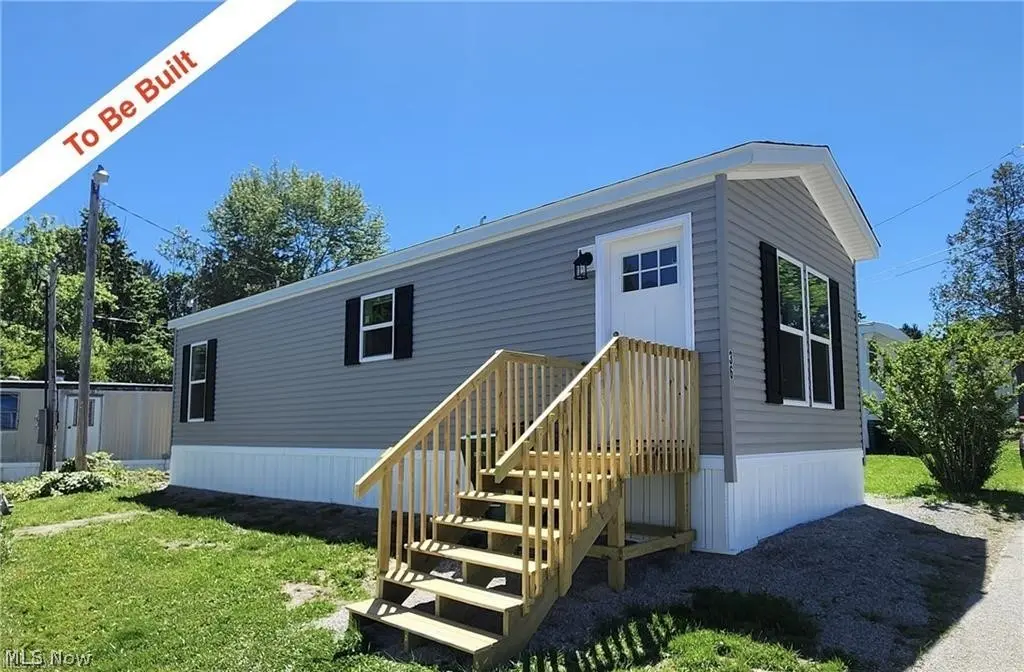
8323 Eagle Rd #50 · Kirtland, OH
Flood risk 1/10 · Minimal
- FEMA flood zone
- X (unshaded)
- Chance of flooding over 30 yrs
- 0.0%
- Est. flood insurance / yr
- $507 – $1,088
Fire risk 1/10 · Minimal
- Est. fire insurance / yr
- $713 – $1,323
Heat risk 2/10 · Minimal
- Hot days now (above 94°F)
- 7 days/yr
- Hot days in 30 yrs
- 16 days/yr
Wind risk 1/10 · Minimal
- Chance of severe wind over 30 yrs
- —
Air-quality risk 3/10 · Minor
- Unhealthy air days now
- 3 days/yr
- Unhealthy air days in 30 yrs
- 4 days/yr
Risk factors via First Street. Map © Google.
Why this score? — see what drove the B+ grade
The composite is a weighted blend of 9 inputs, each scored 0–100. Each bar is that input's sub-score; the figure is the points it added to the 100-point composite (weight × sub-score).
- Cash flow +30.0/30.0
- 1% rule +10.0/10.0
- DSCR +10.0/10.0
- ARV discount +7.5/15.0
- Schools +6.8/10.0
- Condition / age +5.0/5.0
- Livability +4.0/5.0
- Rent growth +3.5/5.0
- Appreciation +0.0/10.0
$55,227
🖨 Deal sheet 📄 Offer letter ✓ Due diligence
Listing remarks
Why settle when you can have everything brand new—at an unbeatable price—in the highly sought-after city of Kirtland? Welcome to Eagle Mobile Home Park, where convenience meets comfort in a peaceful, well-located community just minutes from local parks, shopping, and daily amenities—yet tucked away from the hustle and bustle. This is your opportunity to customize your own 1-bedroom, 1-bath home and step into the freedom of homeownership—say goodbye to the restrictions of apartment living! This home comes with a 7 year warranty. Inside, you'll enjoy a bright, open-concept layout that blends the eat-in kitchen and living area—perfect for relaxing or entertaining.
Key facts
- 7 year warranty
- Peaceful community
- Eat-in kitchen
Tags
Property features AI
Finance
- Other: Home warranty included
- Financial info: Pets allowed with breed restrictions
- HOA & community: Eagle Mobile Home Park community; Monthly association fee; Association covers management, sewer, trash and water; Has land lease ($405)
Exterior
- Parking: On-site parking; On-street parking
- Utilities: Public water; Private sewer
- Home design: Single-story home; To be built (property condition)
- Construction: Vinyl siding; Asphalt/fiberglass roof; Built by builder
- Exterior features: On-site parking; On-street parking
Interior
- Kitchen: Eat-in kitchen
- Bedrooms: 1 main-level bedroom
- Bathrooms: 1 full bathroom (main level)
- Heating & cooling: Forced air heating (gas)
- Interior features: Crown molding; Eat-in kitchen; Open floorplan; Recessed lighting
- Laundry & utility: Washer hookup in hall on main level
Neighborhood map
What this means for you Summary
Snapshot
- This is a 1-bed/1.0-bath single-family listed at $55k. Condition is rated excellent.
Deal economics
- At list price, monthly cash flow is $423 ($5k/yr) — positive.
- The deal already cash-flows at list — no discount required.
- Meets the 1% rule at list price ($1k rent vs $55k).
- Cap rate 15.5% vs local median 3.5% in Kirtland — top-decile yield for the area; either an underpriced asset or a hidden risk that comps aren't pricing in. Stress-test before assuming the spread holds.
Location & tenants
- Location reads 80/100 on livability (#109 in OH, #1,647 nationally) — a professional / high-income tenant draw. Strengths: schools A+, crime A+, employment A+; Watch: health & safety D, amenities F, commute F.
- Kirtland Local (suburban): math 73% / reading 80% proficiency, ranked #57 of 656 in OH (top 9%) — strong family-tenant draw, lease renewals of 3-5y typical; only 9% free/reduced lunch — higher-income household profile.
- Market conditions: Rents rising fast (+4.0%/yr); 187 active listings in the ZIP; solid renter incomes; 448 units permitted in Lake County in 2024 (0 in 5+ unit buildings).
- This rent is only 16% of the median local income ($79k/yr) — well below the 30% rent-burden line; pricing power to push rent on renewal without tenant pushback.
Forward outlook
- Local home prices are declining (-3.0%/yr); year-one equity from $382 of loan paydown is wiped out by about $2k of value loss. Plan a longer hold.
- Lake County population projected to shrink 8% by 2050 — rents likely to lag national; underwrite the cash flow, not the appreciation.
- At projected returns (-3.0% appreciation + 4.0% rent growth), your $15k cash investment doubles in ~4 years — after that, you're playing with house money.
Negotiation context
- Only 8 days on market — expect competitive offers; lowballing is unlikely to land.
Questions for the listing agent
- Is there a deadline driving the sale (1031 exchange, divorce, estate, relocation)? That informs how much negotiation room exists.
- Schools are A-rated — typically a magnet for longer-tenancy family renters. What's the average tenant stay here, and is there a school-zone premium baked into asking?
- What's the average days-on-market for RENTAL listings here right now (not sales)? A rising rental-DOM trend means longer vacancies and softer asking-rent achievability than the comps imply.
- What's the recent tenant-quality profile in this submarket — average credit score on applications, eviction rate, late-payment / NSF rate, and stable-employment percentage? A property-management company in the area should have these aggregated.
- How much new for-sale + rental construction is in the pipeline within 1–3 miles? Heavy new supply typically softens prices + rents 12–24 months out; constrained supply supports both.
Investment metrics
- 1% rule
- 1.84% ✓
- Cap rate
- 15.48%
- Cash-on-cash
- 32.82%
- DSCR
- 2.46
- GRM
- 4.5
CMA / ARV
- ARV (on-the-fly)
- $14,472
- Comps found
- 3
Show comp detail 3 sales within ~0.75 mi
| Address | Dist | Beds/Ba | Sqft | Sold | Price | $/sf | Match |
|---|---|---|---|---|---|---|---|
| 9735 Chillicothe Rd #29 | 0.26mi | 2/1.0 (+1) | 552 (+3%) | 1mo | $10,000 | $18 | 77 |
| 8323 Eagle Rd #56 | 0.23mi | 1/1.0 | 560 (+4%) | 10mo | $50,000 | $89 | 73 |
| 9735 Chillicothe Rd #26 | 0.29mi | 2/1.0 (+1) | 564 (+5%) | 2mo | $15,500 | $27 | 71 |
Match score weights: distance 35% · size 25% · config 20% · recency 20%. Top-matched comps best support the ARV.
Projected returns pro-forma
-3.0% appreciation · 4.01% rent growth · sell at horizon
- IRR
- 29.1%
- Equity multiple
- 2.23×
- Total profit
- $19,048
- Equity at exit
- $8,235
- IRR
- 37.1%
- Equity multiple
- 4.60×
- Total profit
- $55,713
- Equity at exit
- $4,775
Cash invested: $15,464 (down + closing). Projections, not guarantees.
Landlord ↔ Tenant lean methodology
- Overall (STATE)
- 73 Landlord-Friendly
- State Ohio
- 73 Landlord-Friendly · R+6
- County
- — inherits STATE
- City
- — inherits STATE
ZIP-level market 44094
- Rents YoY
- 4.0%
- Active inventory
- 187
- Price-to-rent
- 4.5×
Monthly cashflow live
- Estimated rent
- $1,018 medium interval (Pro) →
- Mortgage (P&I)
- −$290
- Tax est. 1.5%
- −$69 /mo · $828/yr
- Insurance
- −$23
- HOA
- −$0
- Vacancy / Maint / Mgmt
- −$214
- Net cashflow
- $423
Break-even live
UW: 25.0% down · 7.5% · 30yr · 1.5% tax · 5.0% vac · 8.0% maint · 8.0% mgmt
Financing live
Cash to close
- Down payment
- $13,807
- Closing costs
- $1,657
- Reserves months
- —
- Total cash needed
- —
Loan-product check · same deal, 3 products live
Conventional
25% down · 7.5% · 30yr
- Down + closing
- —
- Monthly P&I
- —
- Monthly cashflow
- —
- DSCR
- —
- Eligible?
- —
Personal DTI + credit; lowest rate.
DSCR
20% down · 8.5% · 30yr
- Down + closing
- —
- Monthly P&I
- —
- Monthly cashflow
- —
- DSCR
- —
- Eligible?
- —
No personal income docs; deal must DSCR.
Hard money
10% down · 12.0% · 12mo
- Down + closing
- —
- Monthly P&I
- —
- Monthly cashflow
- —
- DSCR
- —
- Eligible?
- —
Short-term bridge; refi at stabilization.
Listing history 7 events
-
2026-06-18days on market $55,227 Active 8 DOM
-
2026-06-17days on market $55,227 Active 7 DOM
-
2026-06-16days on market $55,227 Active 6 DOM
-
2026-06-15days on market $55,227 Active 5 DOM
-
2026-06-13days on market $55,227 Active 3 DOM
-
2026-06-13remarks 669-char remark
-
2026-06-13$55,227 Active 2 DOM
ⓘ Source: listings_history table (triggers on properties + properties_extension) + one-shot
backfill from property_details.listing_events for pre-trigger history.
Climate risk First Street
- Flood 1/10 Low FEMA zone X (unshaded) · 0% chance over 30 yrs
- Wildfire 1/10 Low
- Heat 2/10 Low 7 d/yr ≥94°F today · 16 d/yr by 30 yrs out
- Wind 1/10 Low
- Air quality 3/10 Moderate 3 unhealthy d/yr today · 4 by 30 yrs out
Nearby sold comps map
Loading sold comps map…
Walkable amenities ~0.75 mi
Loading nearby amenities…
Taxation est. · year 1
- Rental income
- $12,222
- − Mortgage interest
- −$3,094
- − Property taxes
- −$828
- − Insurance
- −$276
- − Repairs & maintenance
- −$978
- − Management
- −$978
- − Depreciation
- −$1,607
- Taxable income
- $4,461
- Est. tax owed @ 24.0%
- −$1,071
- After-tax cash flow
- $4,004/yr
For passive investors: Depreciation is non-cash, so a rental often shows a tax loss while cash-flowing — sheltering income. Rental losses are passive: they offset passive income freely, and up to $25,000/yr can offset ordinary (W-2) income if you actively participate and your MAGI is under $100k (phasing out to $0 by $150k); unused losses carry forward. On sale, claimed depreciation is recaptured at up to 25%, and gains may owe capital-gains tax (a 1031 exchange can defer both). Figures are a year-1 estimate at your 24.0% rate — not tax advice; consult a CPA.
Condition & rehab AI · 13 photos
This home is in excellent condition with no visible repairs or maintenance needed. It is move-in ready and has the potential to be further enhanced with some exterior painting and landscaping improvements to increase its resale and rental value.
Value-add opportunities
- Both Painting the exterior siding and trim — Fresh paint can enhance curb appeal and add value to the home.
- Both Landscaping improvements — Well-maintained landscaping can improve curb appeal and add value to the home.
Renovation cost estimate screening
Value-add ROI direction
- Both Painting the exterior siding and trim — Fresh paint can enhance curb appeal and add value to the home. ↑
- Both Landscaping improvements — Well-maintained landscaping can improve curb appeal and add value to the home. ↑
ⓘ Cost ranges are severity-bucket heuristics (US national rule-of-thumb). Get contractor quotes + a written scope before underwriting a rehab budget.
Schools (NCES district)
- District
- Kirtland Local
- NCES district ID
- 3904787
- Math proficiency
- 73% ▼ -10.00%
- Reading proficiency
- 80% ▼ -2.00%
- Median HH income
- $83,416
- Composite
- 67.93/100
- National rank
- #360
- State rank
- #57 of 656 in OH
Livability — Kirtland
- Score
- 80/100
- State rank
- #109
- US rank
- #1647
Category grades
Schools grade is shown separately in the Schools card above.
Census & demographics
- Census place
- Kirtland, OH
- County
- Lake County · 204,927 people
- Metro
- Cleveland-Elyria, OH
- Population (ZIP)
- 36,873
- Household income
- $78,772
- Rent vs Own
- Severe rent burden
- 1381.0
Population outlook (Lake County) Hauer SSP2
- Today (2025)
- 230,022 people
- By 2030
- 228,151 · -0.8%
- By 2040
- 221,018 · -3.9%
- By 2050
- 212,754 · -7.5%
- By 2075
- 200,309 · -12.9%
- By 2100
- 183,315 · -20.3%
Race, ethnicity, and origin ACS 2023
- Neighborhood character
- Predominantly White (86%)
- Race & ethnicity
- White 86% Black 7% Two or more races 4% Hispanic / Latino 2% Asian 2%
- Common ancestry
- Romanian 7% Lithuanian 2% Slovak 2%
- Foreign-born
- 7% · Canada, China
- Languages at home
- 92% English-only · Russian/Polish/Slavic 3% Other Indo-European 1% German/W. Germanic 1%
Political lean MEDSL · Lake
- 2024 margin
- R (+14.3) · D 42.4% · R 56.7%
- 2008→2024 swing
- -15.2pp toward R · 2008: 0.8pp · 2024: -14.3pp
- All cycles
- 2024: R+14.3 2020: R+13.6 2016: R+15.6 2012: R+1.7 2008: D+0.8
Not yet ingested
- Civics
- —
Market trends
- HPI YoY
- ▼ -229.28%
- Current HPI
- 179.81
- Rent YoY
- ▲ 4.01%
- Metro
- Cleveland-Elyria, OH
- State GDP YoY
- ▲ 1.98%
- F500 in state
- 48
Industry mix (Fortune 500 HQ in OH)
| Industry | F500 HQs | Revenue |
|---|---|---|
| Insurance | 3 | $145B |
|
||
| Industrial Machinery | 3 | $49B |
|
||
| Financial Services | 3 | $24B |
|
||
| Consumer Goods | 2 | $93B |
|
||
| Aerospace / Defense | 2 | $47B |
|
||
| Utilities | 2 | $33B |
|
||
Price history
1 event — show timeline
- 2026-06-08 Listed $55,227 MLSNOW
Cash-flow waterfall
monthlySold comps — $/sqft
last 12 mo · ≤1 miLoading sold comps…