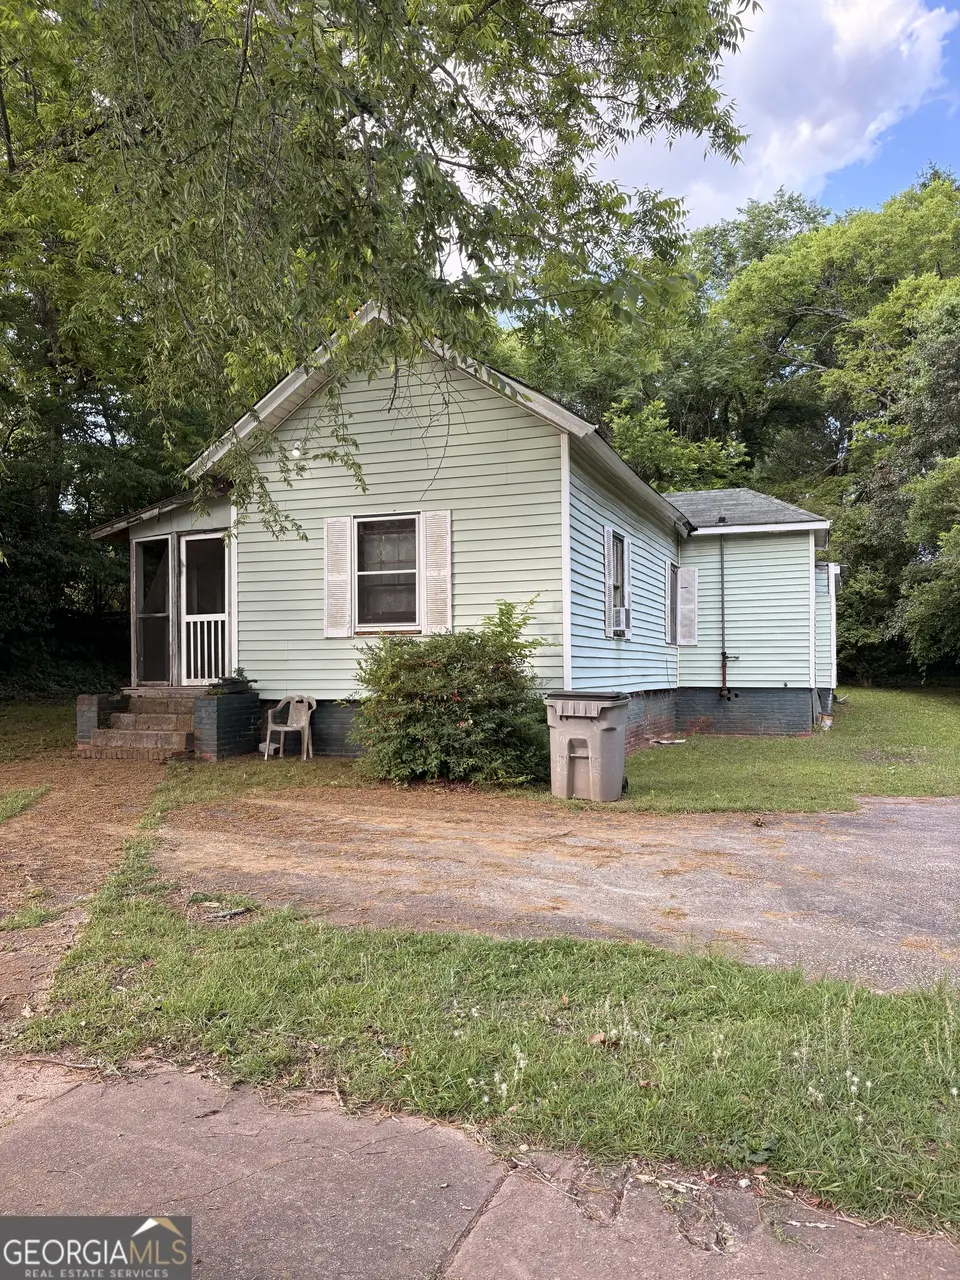
903 Troup St · LaGrange, GA
Flood risk 1/10 · Minimal
- FEMA flood zone
- X (unshaded)
- Chance of flooding over 30 yrs
- 0.0%
- Est. flood insurance / yr
- $507 – $1,088
Fire risk 3/10 · Minor
- Est. fire insurance / yr
- $963 – $1,789
Heat risk 6/10 · Moderate
- Hot days now (above 105°F)
- 7 days/yr
- Hot days in 30 yrs
- 18 days/yr
Wind risk 6/10 · Moderate
- Chance of severe wind over 30 yrs
- 55.0%
Air-quality risk 3/10 · Minor
- Unhealthy air days now
- 4 days/yr
- Unhealthy air days in 30 yrs
- 4 days/yr
Risk factors via First Street. Map © Google.
Why this score? — see what drove the B- grade
The composite is a weighted blend of 9 inputs, each scored 0–100. Each bar is that input's sub-score; the figure is the points it added to the 100-point composite (weight × sub-score).
- Cash flow +30.0/30.0
- 1% rule +10.0/10.0
- DSCR +10.0/10.0
- ARV discount +7.5/15.0
- Livability +3.0/5.0
- Condition / age +2.5/5.0
- Rent growth +2.3/5.0
- Schools +2.3/10.0
- Appreciation +0.0/10.0
$49,900
🖨 Deal sheet 📄 Offer letter ✓ Due diligence
Listing remarks
Located in the heart of LaGrange, this 3-bedroom, 1-bath home is packed with potential for a savvy buyer ready to renovate and add value. The property features a screened front porch and is conveniently positioned near WellStar West Georgia Medical Center, LaGrange College, the industrial park, and Callaway Stadium, making it appealing for future rental or resale opportunities. Homes in this area continue to see strong demand, and with the right improvements, this property could truly become a standout in the neighborhood. Perfect for a renovation project or long-term investment opportunity.
Key facts
- Screened front porch
- 0.24 acre lot
- Built 1925
Tags
Property features AI
Finance
- Other: Listing terms: Cash or Conventional
- HOA & community: No homeowners association; Community sidewalks
Exterior
- Parking: Parking pad (open parking)
- Utilities: Public water; Public sewer; Electricity available; Natural gas available; High-speed internet available; Cable available; Phone available; Sewer connected; Water available
- Home design: Single-family house; Residential property; Built in 1925
- Construction: Vinyl siding; Composition roof; Built in 1925; Crawl space foundation
- Exterior features: Level lot; Sidewalks
Interior
- Kitchen: Microwave; Refrigerator
- Bedrooms: 3 bedrooms on the main level
- Flooring: Carpet; Laminate
- Bathrooms: 1 full bathroom (main level)
- Heating & cooling: Central heating (natural gas); Central air; Ceiling fans; Window unit(s); Gas heating available
- Interior features: One-level layout; Den; Family room; Crawl space basement; Fixer condition
- Laundry & utility: Washer; Dryer; Laundry closet; Gas water heater
Neighborhood map
What this means for you Summary
Snapshot
- This is a 2-bed/1.0-bath single-family listed at $50k.
Deal economics
- At list price, monthly cash flow is $723 ($9k/yr) — positive.
- The deal already cash-flows at list — no discount required.
- Meets the 1% rule at list price ($1k rent vs $50k).
- Cap rate 23.7% vs local median 3.4% in LaGrange — top-decile yield for the area; either an underpriced asset or a hidden risk that comps aren't pricing in. Stress-test before assuming the spread holds.
Location & tenants
- Location reads 60/100 on livability (#393 in GA) — a middle-class / working-renter tenant base. Strengths: cost of living A+, housing A; Watch: crime F, amenities F, commute F.
- Troup County (rural): math 26% / reading 29% proficiency, ranked #109 of 174 in GA (top 63%) — low school quality limits family demand, transient renter base, plan for 1-2y turnover.
- Zoned schools: Gardner-Newman Middle School (math 25% / reading 32%, grade F, #260 of 470 statewide, top 56%, 1,039 students, 94% FRL); Lagrange High School (math 25% / reading 12%, grade F, #254 of 424 statewide, top 61%, 1,301 students, 45% FRL).
- Market conditions: Rents soft (-1.0%/yr); 305 active listings in the ZIP; 7 comparable units currently listed for rent nearby; rentals lingering (median 44d on market — plan ~5-8 weeks vacancy on turnover, expect pricing pressure); 57% of comp listings sitting > 30 days — soft ceiling on asking rent; 474 units permitted in Troup County in 2024 (87 in 5+ unit buildings).
Forward outlook
- Local home prices are declining (-3.0%/yr); year-one equity from $345 of loan paydown is wiped out by about $1k of value loss. Plan a longer hold.
- Troup County population projected at +15% by 2050 — long-run rental-demand tailwind backs the buy-and-hold thesis.
- At projected returns (-3.0% appreciation + 0.0% rent growth), your $14k cash investment doubles in ~2 years — after that, you're playing with house money.
Negotiation context
- Only 12 days on market — expect competitive offers; lowballing is unlikely to land.
Risks & watch-outs
- Watch-outs: built in 1925 — expect roof / HVAC / electrical / plumbing capex.
- Climate carrying-cost: major wind risk, 55% chance of damaging wind over 30y; extreme-heat days projected 7→18/yr by 2055 (HVAC capex compounding) — expect insurance premiums to compound above CPI over the hold.
Questions for the listing agent
- Built in 1925 — when were the roof, HVAC, electrical panel, plumbing, and water heater last replaced?
- Is there a deadline driving the sale (1031 exchange, divorce, estate, relocation)? That informs how much negotiation room exists.
- Schools are D-rated, which usually means shorter tenancies and higher turnover. Who's the typical renter profile here, and what's been the actual vacancy rate?
- Crime grade is F in this area — have there been break-ins, vandalism, or insurance claims at this property in the last 3 years? What carrier currently insures it and at what premium?
- What's the average days-on-market for RENTAL listings here right now (not sales)? A rising rental-DOM trend means longer vacancies and softer asking-rent achievability than the comps imply.
- What's the recent tenant-quality profile in this submarket — average credit score on applications, eviction rate, late-payment / NSF rate, and stable-employment percentage? A property-management company in the area should have these aggregated.
- How much new for-sale + rental construction is in the pipeline within 1–3 miles? Heavy new supply typically softens prices + rents 12–24 months out; constrained supply supports both.
Investment metrics
- 1% rule
- 2.64% ✓
- Cap rate
- 23.69%
- Cash-on-cash
- 62.11%
- DSCR
- 3.76
- GRM
- 3.2
CMA / ARV
- ARV (on-the-fly)
- $137,218
- Comps found
- 1
Show comp detail 1 sale within ~0.75 mi
| Address | Dist | Beds/Ba | Sqft | Sold | Price | $/sf | Match |
|---|---|---|---|---|---|---|---|
| 614 Cottage Ln | 0.40mi | 2/2.0 | 996 (+14%) | 10mo | $156,000 | $157 | 46 |
Match score weights: distance 35% · size 25% · config 20% · recency 20%. Top-matched comps best support the ARV.
Projected returns pro-forma
-3.0% appreciation · 0.0% rent growth · sell at horizon
- IRR
- 57.7%
- Equity multiple
- 3.44×
- Total profit
- $34,123
- Equity at exit
- $7,440
- IRR
- 61.5%
- Equity multiple
- 6.31×
- Total profit
- $74,134
- Equity at exit
- $4,314
Cash invested: $13,972 (down + closing). Projections, not guarantees.
Landlord ↔ Tenant lean methodology
- Overall (STATE)
- 90 Strongly Landlord-Friendly
- State Georgia
- 90 Strongly Landlord-Friendly · R+3
- County
- — inherits STATE
- City
- — inherits STATE
ZIP-level market 30240
- Home prices YoY
- -26.0%
- Rents YoY
- -1.0%
- Active inventory
- 305
- Price-to-rent
- 3.2×
Monthly cashflow live
- Estimated rent
- $1,316 high interval (Pro) →
- Mortgage (P&I)
- −$262
- Tax from tax record
- −$34 /mo · $405/yr
- Insurance
- −$21
- HOA
- −$0
- Vacancy / Maint / Mgmt
- −$276
- Net cashflow
- $723
Break-even live
UW: 25.0% down · 7.5% · 30yr · 1.5% tax · 5.0% vac · 8.0% maint · 8.0% mgmt
Financing live
Cash to close
- Down payment
- $12,475
- Closing costs
- $1,497
- Reserves months
- —
- Total cash needed
- —
Loan-product check · same deal, 3 products live
Conventional
25% down · 7.5% · 30yr
- Down + closing
- —
- Monthly P&I
- —
- Monthly cashflow
- —
- DSCR
- —
- Eligible?
- —
Personal DTI + credit; lowest rate.
DSCR
20% down · 8.5% · 30yr
- Down + closing
- —
- Monthly P&I
- —
- Monthly cashflow
- —
- DSCR
- —
- Eligible?
- —
No personal income docs; deal must DSCR.
Hard money
10% down · 12.0% · 12mo
- Down + closing
- —
- Monthly P&I
- —
- Monthly cashflow
- —
- DSCR
- —
- Eligible?
- —
Short-term bridge; refi at stabilization.
Rent comps 7 comps
| Address | Beds | Baths | Sqft | Rent | $/sqft | DOM | Units | Dist |
|---|---|---|---|---|---|---|---|---|
| 601 Wilburn Ave Unit D LaGrange, GA | 2.0 | 1.5 | 1000 | $1,100 | $1.10 | 43d | 1 | 0.42mi |
| 408 Jackson St LaGrange, GA | 2.0 | 1.5 | 938 | $925 | $0.99 | 11d | 3 | 0.51mi |
| 119 Old Airport Rd LaGrange, GA | 1.0 | 1.0 | 722 | $1,527 | $2.11 | 43d | 1 | 0.88mi |
| 1900 Vernon Rd LaGrange, GA | 1.0–2.0 | 1.0–2.0 | 997 | $1,750 | $1.75 | 3d | 21 | 1.02mi |
| 1101 Truitt Ave Lagrange, GA | 3.0 | 2.0 | 1023 | $1,300 | $1.27 | 43d | 1 | 1.08mi |
| 1007 Vernon St Unit B LaGrange, GA | 2.0 | 1.0 | 900 | $2,200 | $2.44 | 43d | 1 | 1.15mi |
| 207 Harwell Ave LaGrange, GA | 2.0 | 1.5 | 1000 | $1,050 | $1.05 | 21d | 1 | 1.43mi |
Listing history 5 events
-
2026-06-02status $49,900 Under Contract 12 DOM
-
2026-06-01days on market $49,900 New 12 DOM
-
2026-05-31days on market $49,900 New 11 DOM
-
2026-05-30days on market $49,900 New 10 DOM
-
2026-05-20$49,900 New
ⓘ Source: listings_history table (triggers on properties + properties_extension) + one-shot
backfill from property_details.listing_events for pre-trigger history.
Tax reassessment forecast GA · Resets to sale price
- Current annual tax
- $405 · $34/mo
- Projected year-2 tax
- $459 · $38/mo
- Expected delta
- +$54/yr (+$5/mo · 13.4%)
ⓘ Screening estimate from a state-policy table — verify with the county assessor before closing.
Climate risk First Street
- Flood 1/10 Low FEMA zone X (unshaded) · 0% chance over 30 yrs
- Wildfire 3/10 Moderate
- Heat 6/10 Major 7 d/yr ≥105°F today · 18 d/yr by 30 yrs out
- Wind 6/10 Major 55% chance of damaging wind over 30 yrs
- Air quality 3/10 Moderate 4 unhealthy d/yr today · 4 by 30 yrs out
Nearby sold comps map
Loading sold comps map…
Walkable amenities ~0.75 mi
Loading nearby amenities…
Taxation est. · year 1
- Rental income
- $15,789
- − Mortgage interest
- −$2,795
- − Property taxes
- −$405
- − Insurance
- −$250
- − Repairs & maintenance
- −$1,263
- − Management
- −$1,263
- − Depreciation
- −$1,452
- Taxable income
- $8,361
- Est. tax owed @ 24.0%
- −$2,007
- After-tax cash flow
- $6,672/yr
For passive investors: Depreciation is non-cash, so a rental often shows a tax loss while cash-flowing — sheltering income. Rental losses are passive: they offset passive income freely, and up to $25,000/yr can offset ordinary (W-2) income if you actively participate and your MAGI is under $100k (phasing out to $0 by $150k); unused losses carry forward. On sale, claimed depreciation is recaptured at up to 25%, and gains may owe capital-gains tax (a 1031 exchange can defer both). Figures are a year-1 estimate at your 24.0% rate — not tax advice; consult a CPA.
Schools (NCES district)
- District
- Troup County
- NCES district ID
- 1300001
- Math proficiency
- 26% ▼ -10.00%
- Reading proficiency
- 29% ▼ -4.00%
- Median HH income
- $41,354
- Composite
- 23.3/100
- National rank
- #7920
- State rank
- #109 of 174 in GA
Livability — LaGrange
- Score
- 60/100
- State rank
- #393
- US rank
- #19555
Category grades
Schools grade is shown separately in the Schools card above.
Census & demographics
- Census place
- LaGrange, GA
- County
- Troup County · 57,111 people
- City population
- 57,111
- Metro
- LaGrange, GA-AL
- Population (ZIP)
- 31,271
- Household income
- $61,584
- Rent vs Own
- Severe rent burden
- 1033.0
Population outlook (Troup County) Hauer SSP2
- Today (2025)
- 75,537 people
- By 2030
- 78,250 · +3.6%
- By 2040
- 83,184 · +10.1%
- By 2050
- 87,167 · +15.4%
- By 2075
- 95,643 · +26.6%
- By 2100
- 94,234 · +24.8%
Race, ethnicity, and origin ACS 2023
- Neighborhood character
- Diverse neighborhood (Simpson 0.55)
- Race & ethnicity
- White 59% Black 31% Hispanic / Latino 5% Asian 2% Two or more races 2%
- Hispanic origin (detail)
- Mexican 2%
- Common ancestry
- Serbian 2% Italian 1% Slovak 1%
- Foreign-born
- 5% · Canada, South Korea, China
- Languages at home
- 94% English-only · Spanish 4% Other Indo-European 1%
Political lean MEDSL · Troup
- 2024 margin
- Strong R (+24.4) · D 37.6% · R 62.0%
- 2008→2024 swing
- -5.4pp toward R · 2008: -19.0pp · 2024: -24.4pp
- All cycles
- 2024: R+24.4 2020: R+21.9 2016: R+23.4 2012: R+17.8 2008: R+19.0
Not yet ingested
- Civics
- —
Market trends
- HPI YoY
- ▼ -88.20%
- Current HPI
- 251.5869
- Rent YoY
- ▼ -0.96%
- Metro
- LaGrange, GA-AL
- State GDP YoY
- ▲ 2.66%
- F500 in state
- 28
Industry mix (Fortune 500 HQ in GA)
| Industry | F500 HQs | Revenue |
|---|---|---|
| Paper / Packaging | 2 | $29B |
|
||
| Retail | 1 | $160B |
|
||
| Transportation / Logistics | 1 | $91B |
|
||
| Airlines | 1 | $62B |
|
||
| Consumer Goods | 1 | $47B |
|
||
| Utilities | 1 | $25B |
|
||
Price history
1 event — show timeline
- 2026-05-20 Listed $49,900 GAMLS
Property tax history
+4.6%/yrLatest (2025): $405 · +62.4% YoY. Source: county tax records.
Cash-flow waterfall
monthlySold comps — $/sqft
last 12 mo · ≤1 miLoading sold comps…