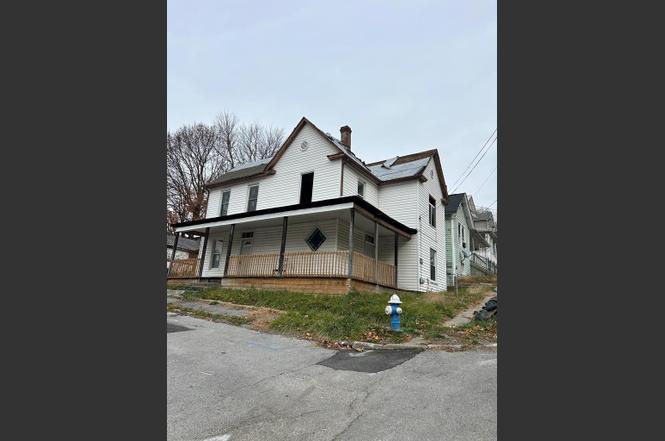
309 Pearis St · Bluefield, WV
Flood risk 1/10 · Minimal
- FEMA flood zone
- X (unshaded)
- Chance of flooding over 30 yrs
- 0.0%
- Est. flood insurance / yr
- $507 – $1,088
Fire risk 4/10 · Minor
- Est. fire insurance / yr
- $787 – $1,461
Heat risk 2/10 · Minimal
- Hot days now (above 90°F)
- 8 days/yr
- Hot days in 30 yrs
- 23 days/yr
Wind risk 2/10 · Minimal
- Chance of severe wind over 30 yrs
- 0.0%
Air-quality risk 1/10 · Minimal
- Unhealthy air days now
- 0 days/yr
- Unhealthy air days in 30 yrs
- 0 days/yr
Risk factors via First Street. Map © Google.
Why this score? — see what drove the D+ grade
The composite is a weighted blend of 9 inputs, each scored 0–100. Each bar is that input's sub-score; the figure is the points it added to the 100-point composite (weight × sub-score).
- Cash flow +15.0/30.0
- ARV discount +7.5/15.0
- Appreciation +6.7/10.0
- 1% rule +5.0/10.0
- DSCR +5.0/10.0
- Livability +2.8/5.0
- Schools +2.6/10.0
- Rent growth +2.5/5.0
- Condition / age +2.5/5.0
$25,000
🖨 Deal sheet (PDF) 📄 Offer letter ✓ Due diligence
Listing remarks
House needs finished in complete renovation. Needs roof . Has some new windows. Some construction supplies convey but not all. Negotiable.
Key facts
- 3,572 sq ft lot
- Built 1901
- Listed 214 days
Property features AI
Exterior
- Utilities: Public water; Public sewer
- Home design: Single-family residence; 2 stories
- Construction: Frame construction
- Exterior features: Corner lot
Interior
- Bathrooms: 1 full bathroom
- Heating & cooling: No heating
- Interior features: Insulated windows
Neighborhood map
What this means for you Summary
Snapshot
- This is a 4-bed/1.0-bath single-family listed at $25k.
Deal economics
- At list price, monthly cash flow is $833 ($10k/yr) — positive.
- The deal already cash-flows at list — no discount required.
- Meets the 1% rule at list price ($1k rent vs $25k).
- Recommended offer: $22k (12.0% below list) — sets the bar for market timing.
- Cap rate 46.3% vs local median 5.2% in Bluefield — top-decile yield for the area; either an underpriced asset or a hidden risk that comps aren't pricing in. Stress-test before assuming the spread holds.
Location & tenants
- Location reads 56/100 on livability (#265 in WV) — a working-class tenant base; expect higher turnover. Strengths: cost of living A+, housing A+; Watch: crime D+, schools F, amenities F.
- Mercer County Schools (town): math 26% / reading 37% proficiency, ranked #28 of 55 in WV (top 51%) — families likely to look elsewhere, expect single-tenant / working-renter base with shorter leases.
- Market conditions: 52 active listings in the ZIP; 4 units permitted in Mercer County in 2024 (0 in 5+ unit buildings).
Forward outlook
- In year one you build about $1k of equity ($173 loan paydown + $856 appreciation (3.4% local appreciation)).
- Mercer County population projected at -18% by 2050 — secular population decline; favor cash flow + early exit over multi-decade hold.
- At projected returns (3.4% appreciation + 3.0% rent growth), your $7k cash investment doubles in ~1 year — after that, you're playing with house money.
Negotiation context
- It's been on market 215 days — a 12% lower offer ($22k) is reasonable based on typical stale-listing flexibility.
Risks & watch-outs
- Watch-outs: built in 1901 — expect roof / HVAC / electrical / plumbing capex.
Questions for the listing agent
- It's been on market 215 days. Have you received any prior offers? Is the seller open to a 12% concession, seller financing, or rate buy-down credit?
- Built in 1901 — when were the roof, HVAC, electrical panel, plumbing, and water heater last replaced?
- Why hasn't it sold? Are there any deal-killer items the seller is aware of (foundation, flood, title, zoning, code violations)?
- Is there a deadline driving the sale (1031 exchange, divorce, estate, relocation)? That informs how much negotiation room exists.
- Schools are F-rated, which usually means shorter tenancies and higher turnover. Who's the typical renter profile here, and what's been the actual vacancy rate?
- Crime grade is D in this area — have there been break-ins, vandalism, or insurance claims at this property in the last 3 years? What carrier currently insures it and at what premium?
- The area grade is low — what's the realistic commute time and amenity access for the typical tenant pool here? Any planned neighborhood developments (good or bad) we should know about?
- What's the average days-on-market for RENTAL listings here right now (not sales)? A rising rental-DOM trend means longer vacancies and softer asking-rent achievability than the comps imply.
- What's the recent tenant-quality profile in this submarket — average credit score on applications, eviction rate, late-payment / NSF rate, and stable-employment percentage? A property-management company in the area should have these aggregated.
- How much new for-sale + rental construction is in the pipeline within 1–3 miles? Heavy new supply typically softens prices + rents 12–24 months out; constrained supply supports both.
Investment metrics
- 1% rule
- 5.02% ✓
- Cap rate
- 46.26%
- Cash-on-cash
- 142.72%
- DSCR
- 7.35
- GRM
- 1.7
CMA / ARV
- ARV (on-the-fly)
- $117,760
- Comps found
- 2
Show comp detail 2 sales within ~0.75 mi
| Address | Dist | Beds/Ba | Sqft | Sold | Price | $/sf | Match |
|---|---|---|---|---|---|---|---|
| 220 Pine St | 0.30mi | 4/2.0 | 1,798 (-2%) | 23mo | $115,000 | $64 | 59 |
| 812 Highland Ave | 0.14mi | 4/2.0 | 2,114 (+15%) | 24mo | $52,900 | $25 | 45 |
Match score weights: distance 35% · size 25% · config 20% · recency 20%. Top-matched comps best support the ARV.
Projected returns pro-forma
3.42% appreciation · 3.0% rent growth · sell at horizon
- IRR
- —
- Equity multiple
- 9.09×
- Total profit
- $56,612
- Equity at exit
- $11,843
- IRR
- —
- Equity multiple
- 19.08×
- Total profit
- $126,551
- Equity at exit
- $18,733
Cash invested: $7,000 (down + closing). Projections, not guarantees.
Landlord ↔ Tenant lean methodology
- Overall (STATE)
- 83 Strongly Landlord-Friendly
- State West Virginia
- 83 Strongly Landlord-Friendly · R+22
- County
- — inherits STATE
- City
- — inherits STATE
ZIP-level market 24701
- Home prices YoY
- 1.6%
- Active inventory
- 52
- Price-to-rent
- 1.7×
Monthly cashflow live
- Estimated rent
- $1,254 medium interval (Pro) →
- Mortgage (P&I)
- −$131
- Tax from tax record
- −$17 /mo · $202/yr
- Insurance
- −$10
- HOA
- −$0
- Vacancy / Maint / Mgmt
- −$263
- Net cashflow
- $833
Break-even live
Sensitivity live
| Price | -10% $847 | -5% $840 | +0% $833 | +5% $825 | +10% $818 |
|---|---|---|---|---|---|
| Rent | -10% $733 | -5% $783 | +0% $833 | +5% $882 | +10% $932 |
| Rate | -1.0pp $845 | -0.5pp $839 | base $833 | +0.5pp $826 | +1.0pp $819 |
UW: 25.0% down · 7.5% · 30yr · 1.5% tax · 5.0% vac · 8.0% maint · 8.0% mgmt
Financing live
Cash to close
- Down payment
- $6,250
- Closing costs
- $750
- Reserves months
- —
- Total cash needed
- —
Loan-product check · same deal, 3 products live
Conventional
25% down · 7.5% · 30yr
- Down + closing
- —
- Monthly P&I
- —
- Monthly cashflow
- —
- DSCR
- —
- Eligible?
- —
Personal DTI + credit; lowest rate.
DSCR
20% down · 8.5% · 30yr
- Down + closing
- —
- Monthly P&I
- —
- Monthly cashflow
- —
- DSCR
- —
- Eligible?
- —
No personal income docs; deal must DSCR.
Hard money
10% down · 12.0% · 12mo
- Down + closing
- —
- Monthly P&I
- —
- Monthly cashflow
- —
- DSCR
- —
- Eligible?
- —
Short-term bridge; refi at stabilization.
Listing history 17 events
-
2026-06-19days on market $25,000 Active 215 DOM
-
2026-06-18days on market $25,000 Active 214 DOM
-
2026-06-17days on market $25,000 Active 213 DOM
-
2026-06-16days on market $25,000 Active 212 DOM
-
2026-06-15days on market $25,000 Active 211 DOM
-
2026-06-14days on market $25,000 Active 209 DOM
-
2026-06-12days on market $25,000 Active 208 DOM
-
2026-06-09days on market $25,000 Active 205 DOM
-
2026-06-08days on market $25,000 Active 204 DOM
-
2026-06-07days on market $25,000 Active 203 DOM
-
2026-06-05days on market $25,000 Active 200 DOM
-
2026-06-02days on market $25,000 Active 198 DOM
-
2026-06-01days on market $25,000 Active 197 DOM
-
2026-05-31days on market $25,000 Active 196 DOM
-
2026-05-30days on market $25,000 Active 195 DOM
-
2026-04-16price $25,000
-
2025-11-16$29,000 Active
ⓘ Source: listings_history table (triggers on properties + properties_extension) + one-shot
backfill from property_details.listing_events for pre-trigger history.
Tax reassessment forecast WV · Resets to sale price
- Current annual tax
- $202 · $17/mo
- Projected year-2 tax
- $202 · $17/mo
- Expected delta
- $0/yr ($0/mo · 0.0%)
ⓘ Screening estimate from a state-policy table — verify with the county assessor before closing.
Climate risk First Street
- Flood 1/10 Low FEMA zone X (unshaded) · 0% chance over 30 yrs
- Wildfire 4/10 Moderate
- Heat 2/10 Low 8 d/yr ≥90°F today · 23 d/yr by 30 yrs out
- Wind 2/10 Low 0% chance of damaging wind over 30 yrs
- Air quality 1/10 Low 0 unhealthy d/yr today · 0 by 30 yrs out
Nearby sold comps map
Loading sold comps map…
Walkable amenities ~0.75 mi
Loading nearby amenities…
Taxation est. · year 1
- Rental income
- $15,051
- − Mortgage interest
- −$1,400
- − Property taxes
- −$202
- − Insurance
- −$125
- − Repairs & maintenance
- −$1,204
- − Management
- −$1,204
- − Depreciation
- −$727
- Taxable income
- $10,189
- Est. tax owed @ 24.0%
- −$2,445
- After-tax cash flow
- $7,545/yr
For passive investors: Depreciation is non-cash, so a rental often shows a tax loss while cash-flowing — sheltering income. Rental losses are passive: they offset passive income freely, and up to $25,000/yr can offset ordinary (W-2) income if you actively participate and your MAGI is under $100k (phasing out to $0 by $150k); unused losses carry forward. On sale, claimed depreciation is recaptured at up to 25%, and gains may owe capital-gains tax (a 1031 exchange can defer both). Figures are a year-1 estimate at your 24.0% rate — not tax advice; consult a CPA.
Schools (NCES district)
- District
- Mercer County Schools
- NCES district ID
- 5400840
- Math proficiency
- 26% ▼ -13.00%
- Reading proficiency
- 37% ▼ -6.00%
- Median HH income
- $35,064
- Composite
- 25.98/100
- National rank
- #7325
- State rank
- #28 of 55 in WV
Livability — Bluefield
- Score
- 56/100
- State rank
- #265
- US rank
- #22470
Category grades
Schools grade is shown separately in the Schools card above.
Census & demographics
- Census place
- Bluefield, WV
- County
- Mercer County · 33,615 people
- City population
- 17,117
- Metro
- Bluefield, WV-VA
- Population (ZIP)
- 17,117
- Household income
- $50,455
- Rent vs Own
- Severe rent burden
- 302.0
Population outlook (Mercer County) Hauer SSP2
- Today (2025)
- 57,860 people
- By 2030
- 55,781 · -3.6%
- By 2040
- 51,365 · -11.2%
- By 2050
- 47,476 · -17.9%
- By 2075
- 38,851 · -32.9%
- By 2100
- 30,053 · -48.1%
Race, ethnicity, and origin ACS 2023
- Neighborhood character
- Predominantly White (82%)
- Race & ethnicity
- White 82% Black 9% Two or more races 7% Hispanic / Latino 2%
- Common ancestry
- Slovak 2% Serbian 1% Danish 1%
- Foreign-born
- 1%
- Languages at home
- 96% English-only · Spanish 3%
Political lean MEDSL · Mercer
- 2024 margin
- Solid R (+57.3) · D 20.6% · R 77.9% · Other 1.5%
- 2008→2024 swing
- -29.8pp toward R · 2008: -27.6pp · 2024: -57.3pp
- All cycles
- 2024: R+57.3 2020: R+54.4 2016: R+55.3 2012: R+47.1 2008: R+27.6
Not yet ingested
- Civics
- —
Market trends
- HPI YoY
- ▲ 3.42%
- Current HPI
- 215.9682
- Rent YoY
- —
- Metro
- Bluefield, WV-VA
- State GDP YoY
- —
- F500 in state
- 0
Price history
-13.8% since first listed2 events — show timeline
- 2026-04-16 Price Changed $25,000 MTCBOR
- 2025-11-16 Listed $29,000 MTCBOR
Property tax history
-4.5%/yrLatest (2025): $202 · +27.7% YoY. Source: county tax records.
Cash-flow waterfall
monthlySold comps — $/sqft
last 12 mo · ≤1 miLoading sold comps…