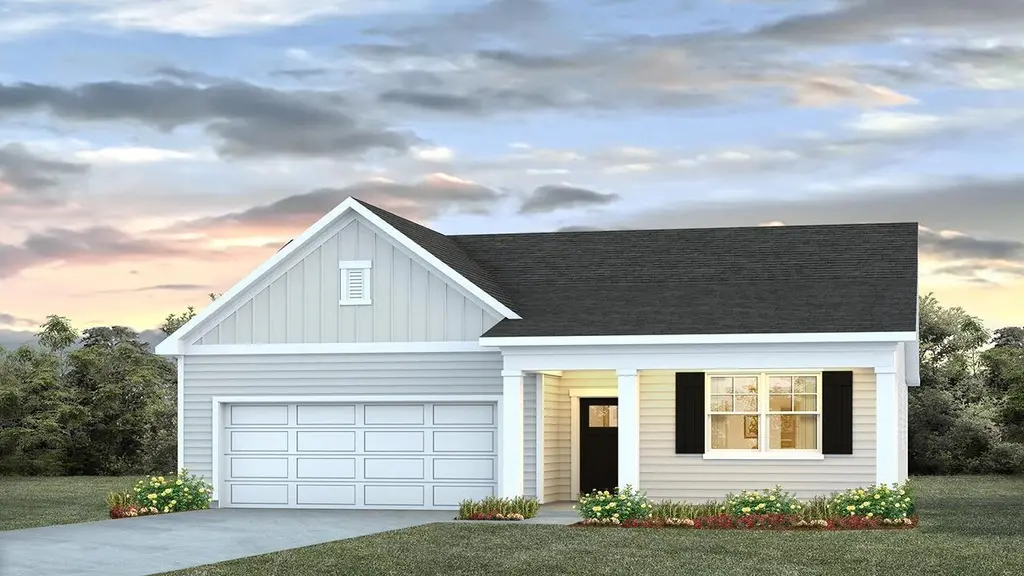
1061 Laurel Oaks Dr · Summerville, SC
Flood risk 1/10 · Minimal
- FEMA flood zone
- X (unshaded)
- Chance of flooding over 30 yrs
- 0.0%
- Est. flood insurance / yr
- $507 – $1,088
Fire risk 1/10 · Minimal
- Est. fire insurance / yr
- $783 – $1,453
Heat risk 8/10 · Major
- Hot days now (above 108°F)
- 7 days/yr
- Hot days in 30 yrs
- 17 days/yr
Wind risk 8/10 · Major
- Chance of severe wind over 30 yrs
- 98.0%
Air-quality risk 3/10 · Minor
- Unhealthy air days now
- 3 days/yr
- Unhealthy air days in 30 yrs
- 3 days/yr
Risk factors via First Street. Map © Google.
Why this score? — see what drove the D grade
The composite is a weighted blend of 9 inputs, each scored 0–100. Each bar is that input's sub-score; the figure is the points it added to the 100-point composite (weight × sub-score).
- Cash flow +11.9/30.0
- ARV discount +10.6/15.0
- Schools +4.1/10.0
- Condition / age +4.0/5.0
- 1% rule +3.6/10.0
- DSCR +3.5/10.0
- Livability +3.2/5.0
- Rent growth +2.9/5.0
- Appreciation +0.0/10.0
$378,400
🖨 Deal sheet 📄 Offer letter ✓ Due diligence
Listing remarks
Single family home community located in the DD2 District of Summerville. Welcome to 1061 Laurel Oaks Drive, situated on a private conservation lot, located in the Pineview North community. Pineview North is a sought-after Summerville community in the top-rated DD2 school district. It's centrally located and just three minutes from I-26, making commuting easy and keeping shops, dining, and key destinations close by. It's a convenient, friendly neighborhood. This home features the Cali. This single-story floorplan offers a comfortable and intuitive layout designed for the rhythm of everyday life. With four bedrooms and two bathrooms all on one level, the home feels both open and easy to navig
Key facts
- Centrally located
- 6,098 sq ft lot
- 2 garage spots
Tags
Property features AI
Exterior
- Parking: 2 covered garage spaces (2 total parking spaces)
- Home design: Single-family property
- Exterior features: Living area approximately 1,774
Interior
- Bedrooms: 4 bedrooms
- Bathrooms: 2 full bathrooms
- Interior features: Spec home (CALI plan); Active listing
Neighborhood map
What this means for you Summary
Snapshot
- This is a 4-bed/2.0-bath single-family listed at $378k. Condition is rated good.
Deal economics
- At list price, monthly cash flow is $-100 ($-1k/yr) — negative.
- To cash-flow at today's rent, offer at most $364k (3.8% below list).
- To meet the 1% rule (rent ≥ 1% of price), the offer needs to be $324k (14.3% below list).
- Recommended offer: $324k (14.3% below list) — sets the bar for 1% rule.
- Cap rate 6.0% vs local median 4.0% in Summerville — top-decile yield for the area; either an underpriced asset or a hidden risk that comps aren't pricing in. Stress-test before assuming the spread holds.
Location & tenants
- Location reads 63/100 on livability (#167 in SC) — a middle-class / working-renter tenant base. Strengths: housing A+, schools B+, cost of living B+; Watch: amenities F, commute F, health & safety F.
- Dorchester 02 (suburban): math 40% / reading 55% proficiency, ranked #12 of 80 in SC (top 15%) — families likely to look elsewhere, expect single-tenant / working-renter base with shorter leases.
- Market conditions: Rents rising (+1.4%/yr); 741 active listings in the ZIP; 6 comparable units currently listed for rent nearby; rentals at typical pace (median 23d on market — plan ~3-4 weeks tenant-placement turnaround); solid renter incomes; 1,199 units permitted in Dorchester County in 2024 (0 in 5+ unit buildings).
- At $3,242/mo this rent would consume 45% of the median local household income ($86k/yr) (locally 1309% of renters already pay >50% of income on rent) — very limited rent-growth headroom before tenants either downsize or default.
Forward outlook
- Local home prices are declining (-3.0%/yr); year-one equity from $3k of loan paydown is wiped out by about $11k of value loss. Plan a longer hold.
- Dorchester County population projected at +43% by 2050 — long-run rental-demand tailwind backs the buy-and-hold thesis.
Negotiation context
- It's been on market 21 days — a 2% lower offer ($373k) is reasonable based on typical stale-listing flexibility.
Risks & watch-outs
- Climate carrying-cost: severe wind risk, 98% chance of damaging wind over 30y; extreme-heat days projected 7→17/yr by 2055 (HVAC capex compounding) — expect insurance premiums to compound above CPI over the hold.
Questions for the listing agent
- What do current leases actually rent for vs. the listed asking? Can we see a recent rent roll and the last 12 months of T-12 income?
- What does the HOA fee cover, when was the last increase, and are there any pending special assessments or reserve-fund shortfalls?
- Is there a deadline driving the sale (1031 exchange, divorce, estate, relocation)? That informs how much negotiation room exists.
- Schools are B-rated — typically a magnet for longer-tenancy family renters. What's the average tenant stay here, and is there a school-zone premium baked into asking?
- The area grade is low — what's the realistic commute time and amenity access for the typical tenant pool here? Any planned neighborhood developments (good or bad) we should know about?
- What's the average days-on-market for RENTAL listings here right now (not sales)? A rising rental-DOM trend means longer vacancies and softer asking-rent achievability than the comps imply.
- What's the recent tenant-quality profile in this submarket — average credit score on applications, eviction rate, late-payment / NSF rate, and stable-employment percentage? A property-management company in the area should have these aggregated.
- How much new for-sale + rental construction is in the pipeline within 1–3 miles? Heavy new supply typically softens prices + rents 12–24 months out; constrained supply supports both.
Investment metrics
- 1% rule
- 0.86% ✗
- Cap rate
- 5.98%
- Cash-on-cash
- -1.13%
- DSCR
- 0.95
- GRM
- 9.7
CMA / ARV
- ARV (on-the-fly)
- $406,246
- Comps found
- 12
Show comp detail 12 sales within ~0.75 mi
| Address | Dist | Beds/Ba | Sqft | Sold | Price | $/sf | Match |
|---|---|---|---|---|---|---|---|
| 1007 Laurel Oaks Dr | 0.00mi | 4/2.0 | 1,774 (0%) | 1mo | $383,400 | $216 | 99 |
| 1011 Laurel Oaks Dr | 0.00mi | 4/2.0 | 1,774 (0%) | 2mo | $391,400 | $221 | 98 |
| 1021 Laurel Oaks Dr | 0.00mi | 4/2.0 | 1,774 (0%) | 3mo | $393,400 | $222 | 98 |
| 1009 Laurel Oaks Dr | 0.00mi | 4/2.0 | 1,618 (-9%) | 3mo | $382,400 | $236 | 83 |
| 1015 Laurel Oaks Dr | 0.00mi | 3/2.0 (-1) | 1,618 (-9%) | 2mo | $385,400 | $238 | 79 |
| 123 Pressley Ave | 0.36mi | 4/1.0 | 1,908 (+8%) | 2mo | $355,000 | $186 | 65 |
| 101 Dukes Ct | 0.70mi | 3/2.0 (-1) | 1,764 (-1%) | 1mo | $525,000 | $298 | 61 |
| 415 Waring St | 0.45mi | 4/2.0 | 2,000 (+13%) | 3mo | $407,000 | $204 | 55 |
| 710 S Magnolia St | 0.44mi | 4/2.5 | 2,035 (+15%) | 1mo | $465,000 | $229 | 52 |
| 100 Gray Pine Ln | 0.57mi | 3/2.5 (-1) | 1,909 (+8%) | 8mo | $505,000 | $265 | 47 |
| 137 White Pine Way | 0.72mi | 3/2.0 (-1) | 1,548 (-13%) | 3mo | $393,000 | $254 | 38 |
| 139 White Pine Way | 0.72mi | 3/2.5 (-1) | 2,016 (+14%) | 7mo | $460,000 | $228 | 31 |
Match score weights: distance 35% · size 25% · config 20% · recency 20%. Top-matched comps best support the ARV.
Projected returns pro-forma
-3.0% appreciation · 1.45% rent growth · sell at horizon
- IRR
- -19.9%
- Equity multiple
- 0.31×
- Total profit
- $-72,582
- Equity at exit
- $56,421
- IRR
- -16.6%
- Equity multiple
- 0.14×
- Total profit
- $-90,888
- Equity at exit
- $32,717
Cash invested: $105,952 (down + closing). Projections, not guarantees.
Landlord ↔ Tenant lean methodology
- Overall (STATE)
- 90 Strongly Landlord-Friendly
- State South Carolina
- 90 Strongly Landlord-Friendly · R+6
- County
- — inherits STATE
- City
- — inherits STATE
ZIP-level market 29483
- Home prices YoY
- -34.6%
- Rents YoY
- 1.4%
- Active inventory
- 741
- Price-to-rent
- 9.7×
Monthly cashflow live
- Estimated rent
- $3,242 high interval (Pro) →
- Mortgage (P&I)
- −$1,984
- Tax est. 1.5%
- −$473 /mo · $5,676/yr
- Insurance
- −$158
- HOA
- −$46
- Vacancy / Maint / Mgmt
- −$681
- Net cashflow
- $-100
Break-even live
UW: 25.0% down · 7.5% · 30yr · 1.5% tax · 5.0% vac · 8.0% maint · 8.0% mgmt
Financing live
Cash to close
- Down payment
- $94,600
- Closing costs
- $11,352
- Reserves months
- —
- Total cash needed
- —
Loan-product check · same deal, 3 products live
Conventional
25% down · 7.5% · 30yr
- Down + closing
- —
- Monthly P&I
- —
- Monthly cashflow
- —
- DSCR
- —
- Eligible?
- —
Personal DTI + credit; lowest rate.
DSCR
20% down · 8.5% · 30yr
- Down + closing
- —
- Monthly P&I
- —
- Monthly cashflow
- —
- DSCR
- —
- Eligible?
- —
No personal income docs; deal must DSCR.
Hard money
10% down · 12.0% · 12mo
- Down + closing
- —
- Monthly P&I
- —
- Monthly cashflow
- —
- DSCR
- —
- Eligible?
- —
Short-term bridge; refi at stabilization.
Rent comps 6 comps
| Address | Beds | Baths | Sqft | Rent | $/sqft | DOM | Units | Dist |
|---|---|---|---|---|---|---|---|---|
| 708 S Laurel St Summerville, SC | 3.0 | 2.0 | 1543 | $3,900 | $2.53 | 23d | 1 | 0.04mi |
| 117 Pine Grove Ave Summerville, SC | 3.0 | 1.5 | 2100 | $2,800 | $1.33 | 2d | 1 | 0.63mi |
| 121 Grand Palm Ln Summerville, SC | 3.0 | 2.5 | 1464 | $2,100 | $1.43 | 14d | 1 | 1.05mi |
| 131 Boone St Summerville, SC | 3.0 | 2.0 | 1352 | $1,825 | $1.35 | 23d | 1 | 1.10mi |
| 1120 Central Ave Summerville, SC | 3.0 | 2.0 | 2332 | $3,100 | $1.33 | 23d | 1 | 1.33mi |
| 260 Pidgeon Bay Rd Summerville, SC | 2.0–3.0 | 2.0 | 1286 | $2,148 | $1.67 | 2d | 5 | 1.48mi |
HOA detail
- Monthly dues
- $46 · $552/yr
Listing history 14 events
-
2026-06-18days on market $378,400 Active 21 DOM
-
2026-06-17days on market $378,400 Active 20 DOM
-
2026-06-16days on market $378,400 Active 19 DOM
-
2026-06-15days on market $378,400 Active 18 DOM
-
2026-06-13days on market $378,400 Active 16 DOM
-
2026-06-13days on market $378,400 Active 15 DOM
-
2026-06-10days on market $378,400 Active 13 DOM
-
2026-06-09days on market $378,400 Active 12 DOM
-
2026-06-08days on market $378,400 Active 11 DOM
-
2026-06-07days on market $378,400 Active 10 DOM
-
2026-06-03days on market $378,400 Active 6 DOM
-
2026-06-03days on market $378,400 Active 5 DOM
-
2026-06-01days on market $378,400 Active 4 DOM
-
2026-05-31days on market $378,400 Active 3 DOM
ⓘ Source: listings_history table (triggers on properties + properties_extension) + one-shot
backfill from property_details.listing_events for pre-trigger history.
Climate risk First Street
- Flood 1/10 Low FEMA zone X (unshaded) · 0% chance over 30 yrs
- Wildfire 1/10 Low
- Heat 8/10 Severe 7 d/yr ≥108°F today · 17 d/yr by 30 yrs out
- Wind 8/10 Severe 98% chance of damaging wind over 30 yrs
- Air quality 3/10 Moderate 3 unhealthy d/yr today · 3 by 30 yrs out
Nearby sold comps map
Loading sold comps map…
Walkable amenities ~0.75 mi
Loading nearby amenities…
Taxation est. · year 1
- Rental income
- $38,903
- − Mortgage interest
- −$21,196
- − Property taxes
- −$5,676
- − Insurance
- −$1,892
- − Repairs & maintenance
- −$3,112
- − Management
- −$3,112
- − HOA
- −$552
- − Depreciation
- −$11,008
- Taxable loss
- −$7,646
- Est. tax savings @ 24.0%
- +$1,835
- After-tax cash flow
- $636/yr
For passive investors: Depreciation is non-cash, so a rental often shows a tax loss while cash-flowing — sheltering income. Rental losses are passive: they offset passive income freely, and up to $25,000/yr can offset ordinary (W-2) income if you actively participate and your MAGI is under $100k (phasing out to $0 by $150k); unused losses carry forward. On sale, claimed depreciation is recaptured at up to 25%, and gains may owe capital-gains tax (a 1031 exchange can defer both). Figures are a year-1 estimate at your 24.0% rate — not tax advice; consult a CPA.
Condition & rehab AI · 12 photos
This single-family home in Summerville, SC is in excellent condition with a modern kitchen, well-maintained bathrooms, and a clean interior. It offers a good ROI with minimal maintenance required and potential for value-adding improvements.
Value-add opportunities
- Both Painting interior walls — Fresh paint can enhance the home's curb appeal and interior aesthetics.
- Both Landscaping improvements — Enhanced landscaping can improve curb appeal and attract potential buyers/tenants.
- Both Add a smart home system — A smart home system can increase the home's value by making it more energy-efficient and convenient for potential buyers/tenants.
Renovation cost estimate screening
Value-add ROI direction
- Both Painting interior walls — Fresh paint can enhance the home's curb appeal and interior aesthetics. ↑
- Both Landscaping improvements — Enhanced landscaping can improve curb appeal and attract potential buyers/tenants. ↑
- Both Add a smart home system — A smart home system can increase the home's value by making it more energy-efficient and convenient for potential buyers/tenants. ↑
ⓘ Cost ranges are severity-bucket heuristics (US national rule-of-thumb). Get contractor quotes + a written scope before underwriting a rehab budget.
Schools (NCES district)
- District
- Dorchester 02
- NCES district ID
- 4502010
- Math proficiency
- 40% ▼ -13.00%
- Reading proficiency
- 55% ▼ -4.00%
- Median HH income
- $57,937
- Composite
- 41.41/100
- National rank
- #3475
- State rank
- #12 of 80 in SC
Livability — Summerville
- Score
- 63/100
- State rank
- #167
- US rank
- #15058
Category grades
Schools grade is shown separately in the Schools card above.
Census & demographics
- Census place
- Summerville, SC
- County
- Dorchester County · 182,866 people
- City population
- 171,668
- Metro
- Charleston-North Charleston, SC
- Population (ZIP)
- 59,186
- Household income
- $85,750
- Rent vs Own
- Severe rent burden
- 1309.0
Population outlook (Dorchester County) Hauer SSP2
- Today (2025)
- 186,982 people
- By 2030
- 203,967 · +9.1%
- By 2040
- 237,160 · +26.8%
- By 2050
- 267,479 · +43.1%
- By 2075
- 333,025 · +78.1%
- By 2100
- 366,560 · +96.0%
Race, ethnicity, and origin ACS 2023
- Neighborhood character
- Predominantly White (68%)
- Race & ethnicity
- White 68% Black 19% Hispanic / Latino 7% Two or more races 6% Asian 1%
- Hispanic origin (detail)
- Mexican 3% Puerto Rican 1%
- Common ancestry
- Slovak 3% Lithuanian 3% Romanian 3%
- Foreign-born
- 5% · Canada
- Languages at home
- 93% English-only · Spanish 4%
Political lean MEDSL · Dorchester
- 2024 margin
- R (+14.6) · D 41.8% · R 56.4% · Other 1.9%
- 2008→2024 swing
- +0.9pp no change · 2008: -15.5pp · 2024: -14.6pp
- All cycles
- 2024: R+14.6 2020: R+10.5 2016: R+17.5 2012: R+16.0 2008: R+15.5
Not yet ingested
- Civics
- —
Market trends
- HPI YoY
- ▼ -131.42%
- Current HPI
- 248.8406
- Rent YoY
- ▲ 1.45%
- Metro
- Charleston-North Charleston, SC
- State GDP YoY
- ▲ 4.51%
- F500 in state
- 2
Industry mix (Fortune 500 HQ in SC)
| Industry | F500 HQs | Revenue |
|---|---|---|
| Packaging | 1 | $7B |
|
||
Cash-flow waterfall
monthlySold comps — $/sqft
last 12 mo · ≤1 miLoading sold comps…